No statistical excess in EXPLORER/NAUTILUS observations in the year 2001
Abstract
A recent report on gravitational wave detector data from the NAUTILUS and EXPLORER detector groups claims a statistically significant excess of coincident events when the detectors are oriented in a way that maximizes their sensitivity to gravitational wave sources in the galactic plane. While not claiming a detection of gravitational waves, they do strongly suggest that the origin of the excess is of gravitational wave origin. In this note we show that the statistical analysis that led them to the conclusion that there is a statistical excess is flawed and that the reported observation is entirely consistent with the normal Poisson statistics of the reported detector background.
pacs:
0480, 04301 Introduction
The NAUTILUS and EXPLORER gravitational wave detector group has recently reported an examination of 90 days of data taken in 2001 [1]. From each detector’s data they identify events, which they calibrate in terms of excitation energy. Over the 90 days of observation they identify 31 events that are coincident between the two detectors, both in terms of arrival time and excitation energy. They bin these 31 events in terms of the sidereal hour of event arrival and, separately, in terms of the solar hour of the event arrival. The expected number of events in each bin owing to background is Poisson. The number of background events in each bin is estimated by examining events that are coincident following an unphysical time lag. Examining the sidereal and solar hour binning Astone et al. [1] claim
-
•
there is a statistically significant excess of events corresponding to sidereal hour 3;
-
•
an even more significant excess when the sidereal hour 3 and 4 bins are combined; and
-
•
the event distribution with respect to sidereal hour is significantly different than the binning with respect to solar hour.
Since the detectors have a non-trivial detector pattern, an event excess at certain sidereal hours, but none when the data are binned by solar hour, would be suggestive of detector excitations associated with gravitational radiation incident from a fixed direction in the sky. The authors draw attention to this, stating that they “wait for a stronger confirmation of our result before reaching any definite conclusion and claiming that gravitational waves have been observed” [1, next to final paragraph]. Here we show that
-
•
the number of observed events arriving in sidereal hour 3 is not statistically in excess of the number expected from the Poisson statistics of the reported detector background;
-
•
the number of observed events in the combined hour 3 and 4 pair are not statistically in excess of the number expected from the Poisson statistics of the reported detector background and the beam (i.e., the antenna pattern) of the two detectors; and
-
•
the event distribution in solar hour and sidereal are statistically indistinguishable.
We conclude that the published observations do not support the published conclusion that the observations are inconsistent with Poisson statistics, or that there is a statistical difference between the distribution of events in sidereal hour vs. solar hour, or that there is an event excess associated with times when the detectors are favorably oriented with respect to the galactic plane.
2 The observations and their interpretation
2.1 Sidereal hour 3
Table 1 summarizes the observations that the EXPLORER/NAUTILUS detector group cite as demonstrating a statistically significant excess in sidereal hour 3 [1, figure 5].222The tabulated numbers were taken from an electronic version of the figure, which was enlarged and superposed with a grid. In sidereal hour 3 they observe four events when their background estimate suggests an average of 0.9 events. (No estimate of the uncertainty in the background is provided in [1] and, while a matter of concern for that analysis, we will accept the implication that the expected number of background events in each hour is known to a high precision.) They go on to note that when the expected number of events in a Poisson process is 0.9 the probability of observing four or more events is quite small:
| (1) |
On this point their claim of a statistical excess in the number of events hinges.
Neglected, however, is the fact that they have undertaken 24 separate experiments, corresponding to the 24 different sidereal hours. The correct question to ask is whether, over these 24 different experiments, there is a signficant probability that at at least one hour will be exceptional at this level: i.e., that at least one of these 24 Poisson experiments will have a number of events in excess of the expected number at the 1.4% level. This probability is
| (2) |
i.e., if we were to simply draw from a Poisson distribution 24 times (or from 24 different Poisson processes once), we would expect an “excess” at this level slightly more than 1 in 4 times. On this basis the observations reported in [1] do not support the conclusion that there is unexpectedly large number of events in sidereal hour 3, or in any sidereal hour bin, contrary to the claim in [1, §6].
Context is critical in assessing the significance of a data feature identified through analysis. The more independent tests one performs on a random data set, the more likely it is that something “apparently” significant will turn-up: i.e., every random data will show “unusual” characteristics if looked at in enough different ways. Mistakenly identifying such “unusual characteristics” as significant is sometimes referred to as the cluster illusion. In this case we see that the “cluster” of events at sidereal hour 3 is an illusion: noise alone would produce this outcome more frequently than one in four observations. More colloquially, the cluster illusion can be thought of as shooting the arrow first and drawing the bull s eye later.
2.2 Sidereal hours 3 and 4
A second claim made in [1] is that the combination of hour 3 with hour 4 (corresponding to 7 events when 1.7 are expected) is significant, though hour 4 is not, by itself, noteworthy. This claim of significance is not made quantitative in [1], through they emphasize its potential significance by the a posteriori reasoning that the detectors are at these times more sensitive to radiation originating in the galactic plane (though not the galactic center) than at other times.
As previously discussed, the significance of this, or any other, observation about the data cannot be judged independently of its context. Astone et al. [1] did not set-out to examine adjacent two-hour combinations, nor did they bin the data in two hour intervals. Instead, having found what they considered to be an unusual hour they subsequently noted that an adjacent hour had an expected count of 0.8 and an actual count of 3 and claimed this as giving added significance to the claim of an event excess at or about sidereal hour 3.
It is next to impossible to evaluate the significance of a hypothesis like this one, which is framed a posteriori: i.e., after the data have been examined and contingent on what was found in that first examination. To do so requires that we enumerate all the alternative hypotheses that would have been suggested by all possible observations: an impossible task. For this reason the results of “testing” a posteriori hypotheses are generally considered inadmissible as evidence for or against any claim.
Nevertheless, it is still instructive to consider the hour 3/4 pairing and attempt to bound its significance. That starting point is the relevance of the pairing of hours 3 and 4. That pairing was suggested after and because hour 3 was (mistakenly) identified as significant. The probability of flipping a coin and obtaining heads is not made more or less likely if, on the previous throw of the coin, heads was also obtained; similarly, because the pairing was noted both after and because hour 3 was identified as “significant”, the significance of the count in the hour 4 bin is not enhanced by its being adjacent to hour 3. An alternative way of expressing the same point is that knowing that hour 3 had four counts one shouldn’t be surprised that the combined count of hour 3 and hour 4 is greater still. Correspondingly, hour 4 stands alone.
A proper evaluation of the significance of the hour 4 count requires an understanding of all of the equivalent observations about the data that, had they occurred, would have been considered significant. Exactly because the hour 4 count was identified a posteriori this is difficult to do. For guidance, we turn to the a posteriori justification given for judging the hour 3/4 pairing significant. Counting all hours similar to hour 4 under this reasoning will give us a lower-bound on the number of equivalent hypotheses and, thus, an upper-bound on the significance of the particular hour 4 count.
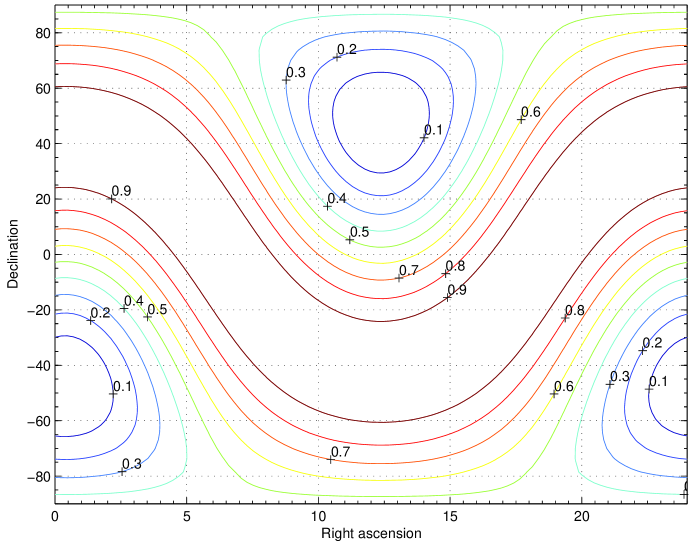
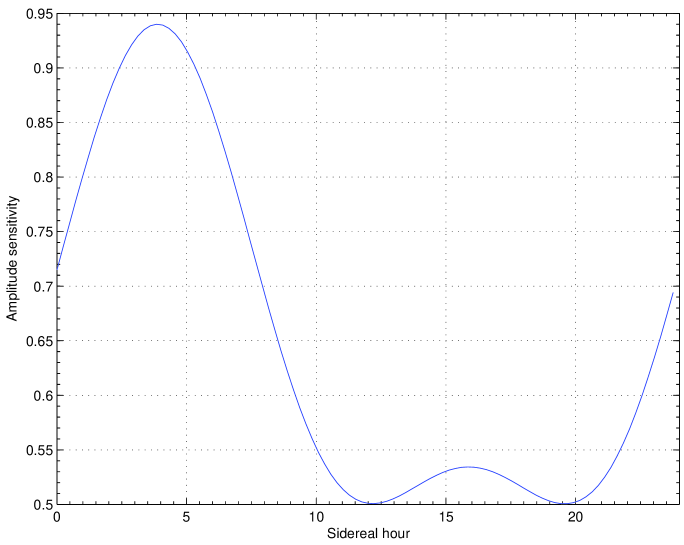
The a posteriori rationale for focusing on the hour 3/4 combination is its relative sensitivity to galactic plane sources. Important to this point is that bar detectors like EXPLORER and NAUTILUS have rather broad beams (i.e., antenna patterns). In particular, owing just to the antenna beam (i.e., ignoring the angular width of the galactic plane) an offset of hours of right ascension from “optimal” overlap with the galactic plane reduces the amplitude sensitivity to sources randomly distributed throughout the galactic plane by only 5%. Indeed, over the entire 24 hour sidereal hour period the sensitivity of the detector pair to equidistant sources in the galactic plane never falls below 50%: see figures 1 and 2.
Since the focus is on galactic plane sources we assume that the hypothesis to be tested involves sources at distances sufficient that they are in fact distributed in a two-dimensional disk (as opposed to so near that the distribution is isotropic). Assuming that the bursts are standard candles, half of the sources observed with strain amplitude above the detector amplitude threshold will have a strain amplitude at the detector greater than and 75% of the sources will have an amplitude greater than . As is apparent from figure 2 the amplitude sensitivity of the detector varies by no more than 10% over hours 1–6; consequently, 75% of the events observable when the detector is at peak sensitivity (approximately sidereal hour 3.5) would also have been above threshold in any of hours 1–6.
Thus the a posteriori explanation for the combined count in the hour 3 and 4 bins would have fit equally well a combination of hour 3 and any of hours 1, 2, 4, 5 or 6. In this set of five hours the background can be expected to yield an hour like hour 4 with probability
| (3) |
i.e., one in five times. Correspondingly, hour 4 is not exceptional by any of the usual standards of evidence for a significant result.
It is important to recognize that this is an upper limit on the significance of the hour 4 count: the actual significance is likely lower because we have not taken into account other associations, identified a posteriori, that might have been justified through other a posteriori reasoning. Based on this minimum number of possible associations we have evaluated the maximum significance of the noted association. This is sufficient to show that there is no statistical excess associated with favorable detector orientation relative to the galactic plane.
2.3 Comparison of sidereal and solar hour distributions
A third claim made in [1] is that the distribution of events when binned according to sidereal hour is significantly different then when binned according to solar hour. This claim, too, is not made quantitative in [1]; however, we can examine it here. Given the Poisson parameter describing the detector background and the number of observed events that they report we can calculate the probability of the particular observation of number of events in the 24 different sidereal (solar) hours that they have made, assuming Poisson statistics with the background rate they have estimated:
| (4) |
where
| (5) |
is the Poisson distribution, is the observed number of events in sidereal (solar) hour and is the expected number of events in sidereal (solar) hour k. Focus on the ratio of the probability of the particular observation reported on in [1] when binned by sidereal hour to the probability when binned by solar hour:
| (6) | |||||
| (7) | |||||
| (8) |
For the particular observation reported in [1] and summarized in table 1 the observed value of is 20.5%: i.e., assuming nothing more than Poisson statistics at the background rate, binning the reported observations in sidereal hours yields a distribution about five times less likely than binning in solar hours.
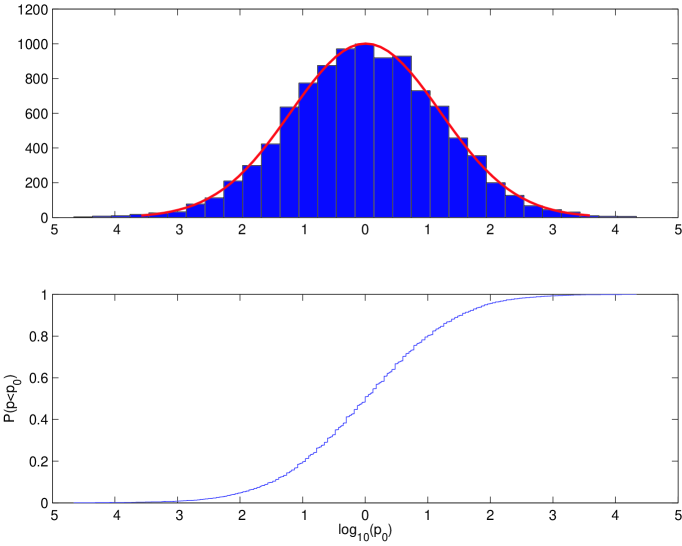
To determine the significance of this result we can perform a Monte Carlo simulation, distributing 31 events (the total number observed and reported on in [1, figure 5]) randomly in time, binning the results by sidereal hour and by solar hour, calculating for this simulated observation of a Poisson process and computing the distribution of that emerges. Figure 3 shows the results of such a Monte Carlo made under the simplifying assumption that the Poisson parameter is the same for all bins and equal to 31/24 (corresponding to 31 events distributed over 24 hours). The first panel of Figure 3 shows a histogram of the distribution of and the second panel shows the probability that is less than some . From these two figures it is clear that a value of less than 20.5% is expected approximately 28% of the time: i.e., more frequently than one in every four experiments when the observations are entirely of detector background noise. The claim that the there is a difference in the distribution of events when binned by solar or sidereal hour is thus unsupported by the data.
Before leaving this claim behind it is worth noting that the comparison of sidereal and solar hour distributions is not entirely independent of the identification of an excess in a particular sidereal hour, as is apparent from the definition of the odds ratio in terms of the probabilities associated with the observed number in each hour bin.
3 Discussion
The interpretation of features identified in a data set cannot be separated from the context in which they were identified. As the number of independent hypotheses increases the likelihood of a large fluctuation leading to a false alarm in at least one also increases; correspondingly, the threshold for a significant result must also be increased. Astone [1] sought first to identify whether the observed counts in each of 24 sidereal hours was consistent with the Poisson statistics of the background. They overestimated the significance of the observed count in sidereal hour 3 by separating it from the context of the 23 other independent hypotheses they tested on the EXPLORER/NAUTILUS coincidence data. By treating the count in each hour as if it were the only hypothesis being tested on the data they underestimated their actual false alarm rate.
The context necessary for determining the significance of a data set feature is unambiguous for a priori hypotheses: i.e., hypotheses clearly articulated in advance of the analysis. On the other hand, it is next to impossible to determine the necessary context for testing a posteriori hypotheses: i.e., hypotheses that arise after the analysis is underway and are suggested by the outcome of a priori hypotheses. A proper accounting of all the possible a posteriori hypotheses that might have been suggested by equivalent post hoc reasoning is required to put the significance of an a posteriori hypothesis on a proper footing. Attempts to do so almost always fall prey to the so-called “Texas Sharpshooter Fallacy”, so-named after the proverbial Texas “sharpshooter” who would fire first and draw the bull’s eye later.
It is for this reason that it is common to draw the distinction between confirmatory and exploratory data analysis. Confirmatory analysis involves only a priori hypotheses with significance levels set with full understanding of the context of the analysis. Their goal is to test the a priori hypotheses. The results of properly executed confirmatory analyses are statistically sound and reliable. Exploratory analyses, on the other hand, are fishing expeditions. Their proper goal is not to test hypotheses, but to suggest new hypotheses to be tested in later confirmatory analyses. Since one can’t test hypotheses identified in exploratory analyses in the data set in which that are identified conclusions regarding them are rarely published without confirmatory analysis. The most common exception to this rule are those rare circumstances when something truly unexpected stands-out so clearly that it remains strongly “significant” by any reasonable attempt to account for the context of the hypothesis. That is not the case with any of the hypotheses identified by Astone et al.
4 Conclusions
The observations reported in [1] are entirely consistent with the estimates of the detector noise background: no result reported rises beyond the level of a “1 ” event. The mistaken claim of an excess in sidereal hour 3 arises from a failure to consider the number of trials involved in binning the data into 24 one hour bins. When a proper account of the trials is taken into account, the observation of the number of events in hour 3 is seen to be entirely consistent with the reported detector background by all usual standards of evidence. The claim that the hour 3/4 combination is also large, and of which much is made through a posteriori reasoning, is seen to be poorly framed and, on closer examination, to also be consistent with the reported detector background. Finally, when the binning of the observations into sidereal hours and solar hours are compared the particular distribution of events is also seen to be consistent with reported statistics of the detector background. We conclude that there is no statistical evidence to support the suggestions of an event excess in the reported NAUTILUS and EXPLORER data.
References
References
- [1] Astone P et al 2002 Class. Quant. Grav. 19 5449–64
-
Sidereal Solar Hour Poisson Observed Poisson Observed param. number param. number 0 0.6 2 1.00 2 1 1.0 1 1.30 2 2 1.1 0 1.20 1 3 0.9 4 0.90 0 4 0.8 3 1.00 0 5 0.7 1 1.30 2 6 0.6 1 1.20 2 7 0.6 1 1.00 1 8 0.7 0 0.90 1 9 1.0 1 0.50 1 10 0.5 0 0.60 2 11 0.7 1 0.80 1 12 1.5 1 0.60 0 13 1.6 2 1.30 2 14 2.2 3 1.50 1 15 0.9 0 1.50 2 16 1.0 1 1.00 1 17 1.3 1 0.80 1 18 1.3 2 1.10 1 19 0.9 1 1.10 3 20 1.7 2 0.80 1 21 1.5 1 0.90 0 22 1.1 1 0.90 2 23 1.1 1 1.20 2