Criticality and convergence in Newtonian collapse
Abstract
We study through numerical simulation the spherical collapse of isothermal gas in Newtonian gravity. We observe a critical behavior which occurs at the threshold of gravitational instability leading to core formation. This was predicted in a previous work by two of the present authors. We describe it in detail in this work. For a given initial density profile, we find a critical temperature , which is of the same order as the virial temperature of the initial configuration. For the exact critical temperature, the collapse converges to a self-similar form, the first member in Hunter’s family of self-similar solutions. For a temperature close to , the collapse first approaches this critical solution. Later on, in the supercritical case (), the collapse converges to another self-similar solution, which is called the Larson-Penston solution. In the subcritical case (), the gas bounces and disperses to infinity. We find two scaling laws with respect to : one for the collapsed mass in the supercritical case and the other, which was not predicted before, for the maximum density reached before dispersal in the subcritical case. The value of the critical exponent is measured to be in the supercritical case, which agrees well with the predicted value . These critical properties are quite similar to those observed in the collapse of a radiation fluid in general relativity. We study the response of the system to temperature fluctuation and discuss astrophysical implications for the interstellar medium structure and for the star formation process. Newtonian critical behavior is important not only because it provides a simple model for general relativity but also because it is relevant for astrophysical systems such as molecular clouds.
pacs:
04.40.-b, 64.60.Ak, 97.10.XqI introduction
The Newtonian isothermal gas is a relevant description for important astrophysical systems. It is indeed a good description for cold molecular clouds found in the galactic interstellar medium. In these clouds the typical cooling time is usually much shorter than the dynamical time; as a result they are in thermal equilibrium with whatever steady heating source is present, for example the blackbody radiation of the cosmic microwave background, extragalactic ultraviolet radiation, or local stars. The molecular clouds can be described as isothermal. Since they are the prime location for star formation, their physics determines the whole star formation history in the galaxy. A detailed understanding of the physics of these systems will lead to predictions for the properties of star formation.
There are two possible theoretical approaches for the self-gravitating Newtonian gas: statistical physics and dynamics. The traditional statistical physics approach deals with equilibrium configurations of the system and gave the first description of Jeans gravitational instability which is a fundamental behavior in the physics of self-gravitating systems (Chandrasekhar chandrasekhar1939 , Padmanabhan padmanabhan1990 ). Using the modern tools of statistical field theory and renormalization groups, de Vega, Sanchez and Combes devega1996 and Semelin et al. semelin1999 give a theoretical basis to the observed self-similar properties of the gas. These statistical methods are useful, generally speaking, to describe systems undergoing second order phase transition and exhibiting critical behavior. Investigating the critical behavior of the gas is also the subject of the present work, where we choose to describe the system through dynamics rather than statistical physics and through the renormalization group.
The basic behavior of a clump of isothermal gas is the following. In a sufficiently dense and/or cold configuration, the gas will collapse due to its self-gravity, while in a diffuse and/or hot one it will expand due to its internal pressure forces. A critical behavior appears at the transition between these two regimes.
In fact, Choptuik choptuik1993 showed the existence of a so-called critical phenomenon in the spherical collapse of a massless scalar field by general relativistic numerical simulations. The simulations were performed for a one-parameter family of initial data sets. He found a self-similar solution with critical properties at the threshold of black hole formation. In this first case, the self-similarity holds for a discrete set of transformations only (periodicity in logarithmic time). He showed that the mass of the formed black hole follows a scaling law, and that the phenomenon is universal in the sense that it does not depend on the one-parameter family of initial data sets. Soon after that, similar critical phenomena were observed in the spherical collapse of radiation fluid by Evans and Coleman ec1994 . In this second case, self-similarity holds for a continuous set of transformations. Koike, Hara and Adachi kha1995 gave a clear picture of these phenomena by using the renormalization group approach. Recently, critical phenomena have been found in perfect fluids with more general equation of state maison1996 ; kha1999 ; nc2000 and in a variety of systems. Astrophysical implications of the critical phenomena have been studied in the scenario of primordial black hole formation by Yokoyama yokoyama1998 and Niemeyer and Jedamzik nj1998 . See gundlach1999 for a recent review of critical phenomena in gravitational collapse.
The solution with critical properties is only one of several known self-similar solutions. See Carr and Coley cc1999 for a recent review of self-similar solutions in general relativity. It was conjectured by Carr carr1993 that a generic solution gradually evolves toward a self-similar form, which suggest that one of the self-similar solutions may be an attractor solution. This is called the self-similarity hypothesis. In Newtonian gravity, a self-similar solution, the so-called Larson-Penston solution penston1969 ; larson1969 is known to be an attractor solution in the spherical collapse of isothermal gas hn1997 ; hm2000 ; ti1999 . In general relativity, Harada and Maeda hm2001 showed by numerical simulations that the general relativistic counterpart of the Larson-Penston solution, which was discovered by Ori and Piran op1987 , is an attractor solution in the spherical collapse of a perfect fluid with (), where and are the pressure and energy density, respectively. This convergence is quite important in general relativity because it provides a strong counterexample against the cosmic censorship conjecture in spherical collapse op1987 ; op1990 ; harada1998 ; hm2001 . See hin2002 for a recent review of cosmic censorship and related topics. In the context of the self-similarity hypothesis, the stability criterion for general relativistic self-similar solutions against kink mode was recently obtained by Harada harada2001 , through a generalization of the Newtonian analysis op1988 .
The present paper shows that critical phenomena exist in Newtonian gravity also. We concentrate on a spherically symmetric system of isothermal gas in Newtonian gravity. The existence of a critical phenomenon was predicted by Harada and Maeda hm2001 and Maeda and Harada mh2001 . In these papers, based on the renormalization group analysis, it was predicted that a critical phenomenon is associated with the first member of Hunter’s family of continuous self-similar solutions hunter1977 . The criticality appears in the scaling law for the collapsed mass, which is satisfied for continuous values of the mass. The value of the critical exponent was predicted to be . The critical phenomenon observed in this paper agrees very well with the above predictions, and gives a precise meaning to the collapsed mass in Newtonian gravity. We have also observed that the scaling law holds over many orders of magnitude in terms of the parameter.
The organization of this paper is as follows. In Sec. II, we apply the renormalization group analysis to the Newtonian isothermal gas system and draw the expected properties for the critical phenomenon. In Sec. III, we present the results from numerical simulations of Newtonian collapse. In Sec. IV we study the response of the system to temperature fluctuations and discuss astrophysical applications. In Sec. V, we summarize the paper.
II Renormalization group analysis
In this section, we review the renormalization group analysis of the critical behavior in a spherical system of Newtonian isothermal gas. Part of the following discussion is based on Maeda and Harada mh2001 .
The dynamics of a spherically symmetric isothermal gas system is described in the following set of equations:
| (1) | |||
| (2) | |||
| (3) | |||
| (4) |
where , , , and denote the density, radial velocity, total mass inside the radial coordinate, sound speed, and gravitational constant, respectively. The sound speed is related to the temperature of the gas as
| (5) |
where and are the Boltzmann constant and mass of each particle, respectively.
In order to apply the renormalization group approach, it is convenient to redefine the physical quantities as follows:
| (6) |
In terms of these new quantities, the basic equations reduce to the following form:
| (7) | |||
| (8) | |||
| (9) | |||
| (10) |
We can see that the above hatted system does not contain any dependence on the temperature (or sound speed), which simplifies the analysis.
The initial conditions for the bare system are specified by the density and velocity profiles at the initial time ( is the time when the density singularity occurs in the center or, more physically, the time of core formation). Suppose the initial density and velocity profiles are given by functions and ,
| (11) |
respectively. Using the relations of the hatted quantities to the bare quantities, we specify the initial conditions for the hatted system by
| (12) |
Therefore, the parameter-dependent system (1)–(4) with unique initial conditions is equivalent to the parameter-independent system (7)–(10) with a one-parameter family of initial conditions. The parameter is or .
Although we avoid to fully repeat the analysis by Koike, Hara and Adachi kha1995 , we need to review it briefly. We introduce the variables
| (13) |
is the scaling variable in the renormalization group transformation. Suppose a self-similar solution exists, with a unique relevant (unstable) mode, which turns out to be the critical solution. This self-similar solution can be considered as a fixed point of the renormalization group transformation. The uniqueness of the unstable mode implies that the fixed point has a stable manifold of codimension one. This manifold is referred to as a critical surface. Any one-parameter family of initial data sets with parameter generically has an intersection with the critical surface of the fixed point . will be driven to under the renormalization group transformation, and hence is the initial data set with the critical value . We consider an initial data in the one-parameter family, close to , i.e.,
| (14) |
where is a solution of the partially differential equations and . Then, for large , we have
| (15) |
where and are the eigenvalue and eigenfunction of the relevant mode, respectively. Now we choose so that the first term and the second term are of the same order, i.e.,
| (16) |
At , the solution is deviating from the critical solution. If the collapse bounces to expansion, which will be the case for a subcritical collapse, the above condition obviously holds for the velocity field at the moment of the bounce. On the other hand, if the finite mass near the center shrinks considerably faster than for the critical collapse, which will be the case for the supercritical case, we have a for which the above condition also holds. Since the deviation from the critical collapse grows at , the relation implies that the radius of the core collapse or bounce is given by , where .
In order to see clearly that self-similar solutions exist in the present hatted system, we introduce the following quantities:
| (17) |
Then, the equations transform to
| (18) | |||
| (19) | |||
| (20) | |||
| (21) |
where the dot and prime denote the partial derivatives with respect to and , respectively, and . The self-similar solutions are obtained by numerical integration of the ordinary differential equations which follow from the above equations with the assumption , and . If we assume the existence of the critical solution, using the relation
| (22) |
we obtain the scaling law for the collapsed mass or the “core” mass for the supercritical collapse,
| (23) |
For the subcritical case, using the relation
| (24) |
we obtain the scaling law for the maximum density,
| (25) |
In fact, for Eqs. (18)–(21), there is a discrete set of self-similar solutions with analyticity at the center and at the sonic point, such as the homogeneous free-fall, Larson-Penston, Hunter (a), (b), (c) and (d) solutions, and so on. Larson-Penston solution describes the coherent collapse of the cloud for . This solution can be extended beyond to a late-time solution in which a finite mass collapses to the center and grows with time . Hunter (a) solution for describes an “exploding collapse” in which the mass of the central collapsing region gets smaller and smaller, converging to zero as reaches , being surrounded by an expanding envelope. The central density still blows up to a “singularity” at . This solution can also be extended beyond to a late-time solution in which the whole cloud expands away; the singularity disappears and the central density keeps decreasing.
Maeda and Harada mh2001 found a unique relevant (unstable) mode for the Hunter (a) solution but no relevant mode for the Larson-Penston solution. It was concluded that the former is a critical solution while the latter is an attractor solution. In the former case, the eigenvalue of the unique relevant mode was evaluated to by solving the eigenvalue problem. Other members of Hunter’s family have more than one relevant modes, which implies that these solutions are not critical solutions. The homogeneous free-fall solution suffers from kink instability op1988 . The value of the critical exponent is . Since we have seen that the parameter for the family of initial data sets is given by the temperature , the scaling laws in the present system are given by
| (26) |
for the supercritical case, and
| (27) |
for the subcritical case. It should be noted that the parameter is not necessarily the temperature but may be the mass or the radius of the cloud if we fix the temperature.
III numerical simulations
We have performed numerical simulations of the spherical collapse of an isothermal Newtonian gas. The basic equations for the evolution of the system are given by Eqs. (1)–(4). The code is based on the Lagrangian description of hydrodynamics and a finite difference scheme. We have chosen Lagrangian (comoving) radial coordinates, attached to spherical shells with infinitesimal thickness. The mass inside coordinate is consequently constant throughout the simulation. We call such coordinates mass coordinates. Shells are initially positioned at constant intershell distance and their mass is computed from the desired density profile (we do not use equal mass shells). With these choices, we achieve high accuracy for the dynamics in the dense central region where the shells collapse during the simulations. The number of shells used in the simulation is . One simulation with shells has been run to check the influence of numerical resolution. No effect has been detected. This is proof of the accuracy of the code. In this section, we adopt units in which and the total mass and initial radius of the cloud are unity.
We have computed the evolution of four types of initial density profiles. Details of the models for the initial density profiles are summarized in Table 1. The initial velocity profile is always set to be identically zero. This assumption seems the most relevant for astrophysical applications, but the same dynamics should develop for different initial velocity profiles. Model 2 is our reference model, in which the initial density profile is given by a quartic polynomial and both the density and the density gradient (i.e., pressure forces) are continuous at the cloud surface. We have computed collapse simulations for various values of the temperature. (Actually, we have computed for various sound speeds and calculated the temperature because the sound speed is rather dynamically meaningful.)
For each model, we find a critical temperature , which is of the same order of magnitude as the virial temperature estimated from the initial gravitational energy of the system. For temperatures just below , the cloud collapses and the central density goes to infinity in a finite time, producing a singularity. We call this collapse a supercritical collapse. For temperatures just above the critical temperature, the cloud begins to collapse but bounces afterward, and the density finally goes to zero everywhere. We call this incomplete “collapse” a subcritical collapse. The results for the critical temperture for each model are summarized in Table 1. In this table, we quote only the number of digits that are common between the critical values computed using the two different resolutions, and .
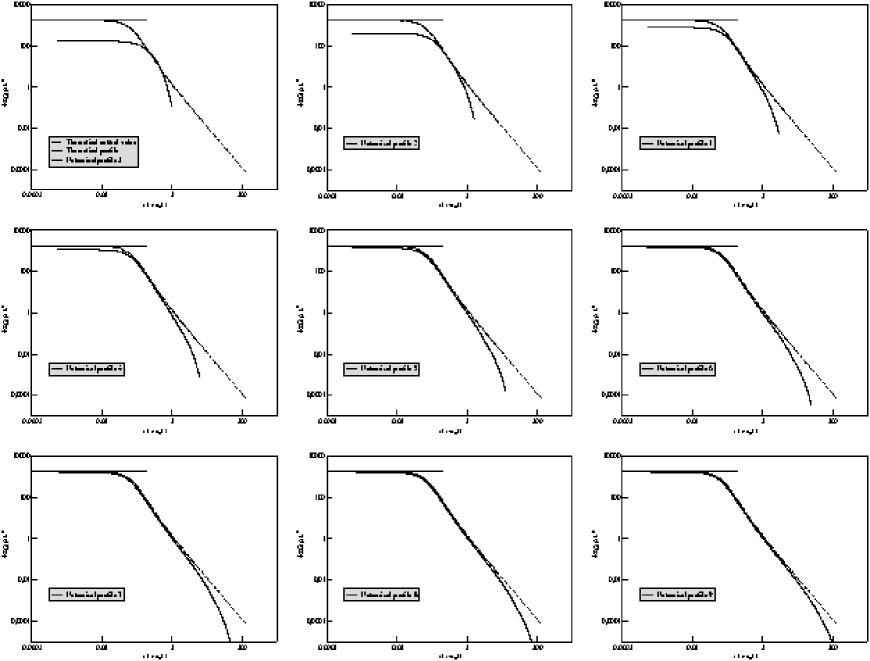
In the critical and supercritical cases, we can estimate the time of singularity formation at the center in different ways. First we can just define it as the instant when the numerical density reaches a very high threshold (e.g., while initially of the order of one). Or we can assume the convergence to a self-similar behavior and use the relation for the central density . Both approaches have been tried and give the same results. When the temperature is fine-tuned to the critical one, a case that we call the critical case for convenience, the simulations show that the collapse approaches the Hunter (a) solution for a while before it deviates. The finer the tuning of the temperature, the closer the approach and the later the deviation. Figure 1 shows density profiles in terms of the dimensionless quantity for a tuning of the temperature to the critical temperature , along with the theoretical Hunter (a) solution. In this case we estimate using the relation. This estimation is local in time and it gives the value which would take if Hunter (a) solution was fully realized. We can see that the density profile converges to Hunter (a) solution. A discrepancy appears at large radii because the numerical configuration has a finite mass while the theoretical Hunter (a) solution has an infinite mass. This discrepancy moves to larger and larger value of as we approach . Therefore, we associate the Hunter (a) solution to the critical case.
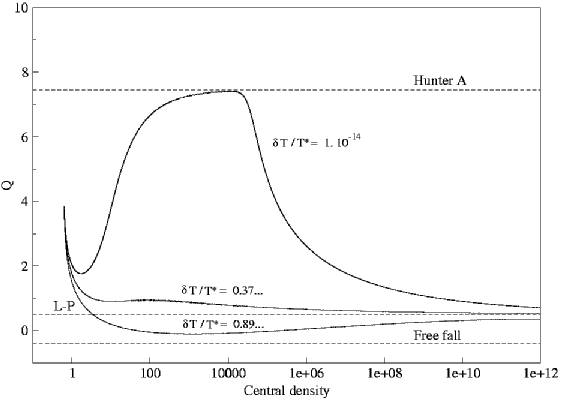
In the near-critical supercritical case, the collapse first approaches the critical solution. Figure 2 shows the evolution of the nondimensional central density parameter
| (28) |
as a function of the central density itself. Here again, we estimate locally. We compute at each time step , using the following relation
| (29) |
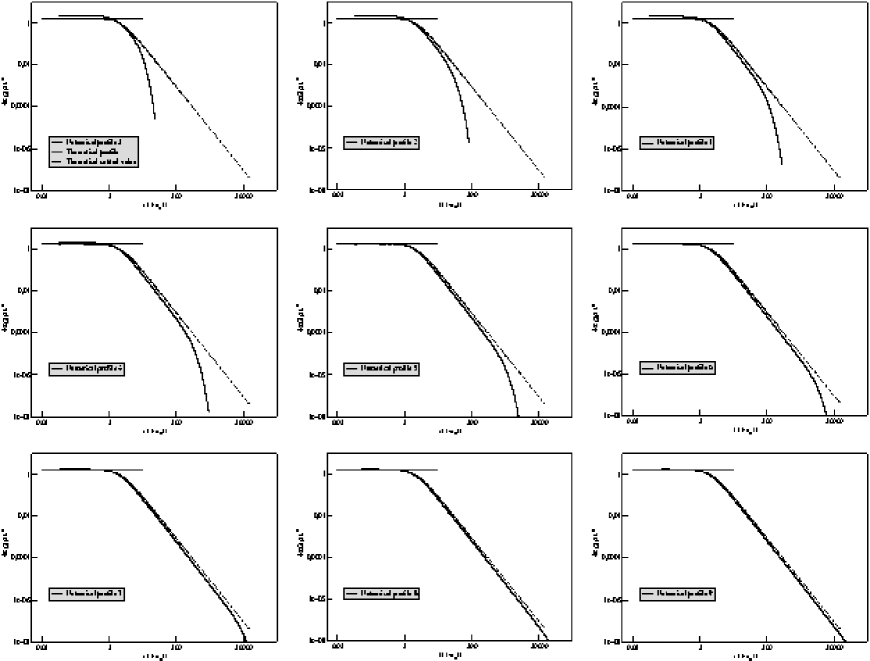
where and are the time and central density at the -th step. We can then deduce . In this figure, the theoretical values for self-similar solutions, such as the homogeneous free-fall, Larson-Penston and Hunter (a) solutions, are also plotted. We find that the curve of the critical collapse approaches the value of the Hunter (a) (critical) solution. However, it afterward deviates and approaches the value of the Larson-Penston solution. This happens because the tuning of the temperature to the critical temperature is not perfect, and because the critical solution is unstable against such fluctuations. During and after the approach to the critical solution, the surrounding region expands away and leaves a finite-mass “core” in the central region. The density field in the central collapsed core at late times is well described by the Larson-Penston solution. This is the case early on for a supercritical collapse also, where the temperature is not fine-tuned to the critical temperature. This type of collapse also produce a finite (more massive) core and an expanding shell. We can see the convergence to Larson-Penston solution in Fig. 3. Therefore we identify the Larson-Penston solution as an attractor solution.
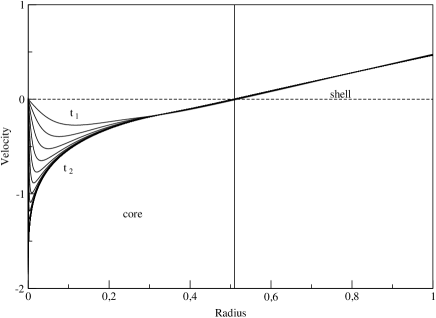
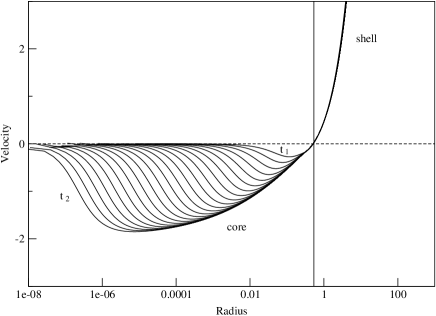
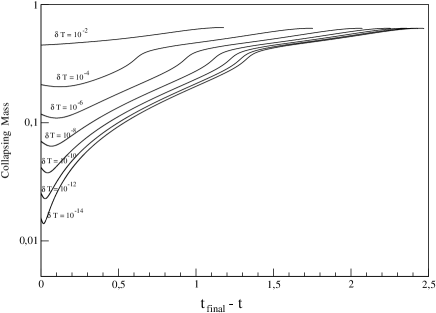
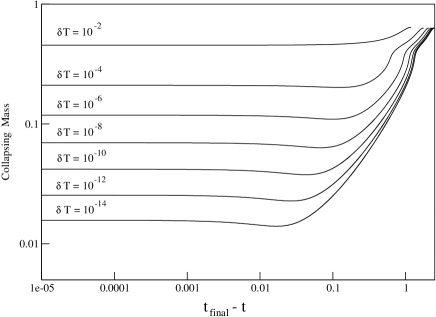
Figure 4 shows the velocity profile around the center for a supercritical collapse. We can see that a finite-size collapsing core is formed. Moreover the physical radius of the collapsing core is almost constant. Figure 5 shows the time evolution of the collapsing mass, for different (supercritical) values of the temperature. We can see that at all supercritical temperature, the collapsing mass tends to a constant and therefore the “core” mass is well defined at the time of the singularity. Figure 6 shows the relation between the core mass and the temperature fluctuation . The numerical results reproduce the scaling law derived by the renormalization group analysis in the previous section. The numerical value of the critical exponent is , which agrees well with the theoretical value determined from the eigenvalue problem of the linear mode analysis. It should be noted that the power-law relation holds approximately for .
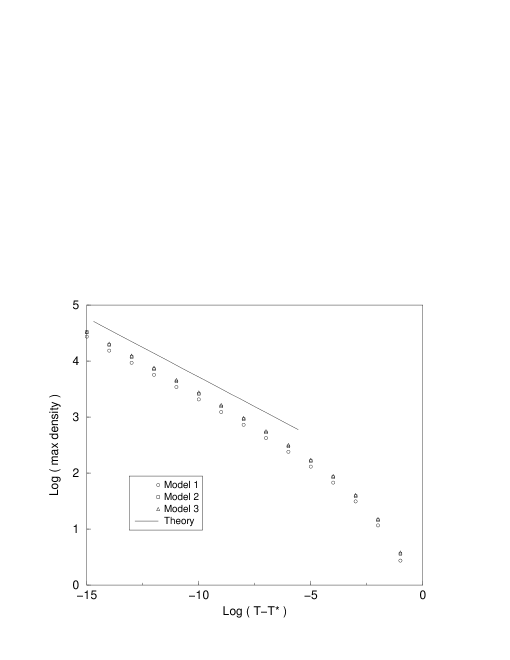
For the subcritical collapse, the central density reaches a maximum and then bounces away. Figure 7 shows the relation between the maximum density and the temperature excess . It shows that the maximum density also follows a scaling law, as is expected from the renormalization group analysis. The measured value of the critical exponent agrees with the theoretical value . Again, it should be noted that the power-law relation holds approximately for .
Although we have concentrated on model 2, the above features have been checked for models 1 and 3. They are identical in all three models except for the specific value of the critical temperature. Model 4, the top-hat model, is special because the cloud is initially homogeneous. In this case, the central region of the cloud remains homogeneous and freely falls to a singularity if the condition is satisfied ti1999 . If the condition is not satisfied, the collapse converges to Larson-Penston (attractor) solution.
IV astrophysical implication
In this section, we study the mass spectrum of collapsed cores resulting from temperature fluctuations around the critical case, according to the treatment of Yokoyama yokoyama1998 . We build a toy model which shows how the critical gravitational collapse may affect the properties of the interstellar medium, and in particular the processes of fragmentation in molecular clouds and star formation. It should be emphasized that the purpose of this section is not to derive the whole shape of the observed initial mass function (IMF) but to show how a link can be established between an initial fluctuation field, and the resulting mass spectrum for the collapsed objects. Numerous additional physical processes would have to be introduced to derive an IMF.
We will use
| (30) |
for the masses of cores formed by collapsing isothermal gas clouds with mass and a temperature which is slightly less than . is a constant and is independent of initial density profile. This relation is theoretically valid for . We can check on Fig. 6 that it is actually valid for or .
We assume a Gaussian probability distribution for the temperature fluctuations for simplicity,
| (31) |
where is the temperature with the maximum probability and is the dispersion, which has the dimension of a temperature. For simplicity, we consider a collection of clouds of the same mass and size with a distribution of temperature obeying the above probability function. Equation (31) allows us to compute the fraction of clouds collapsing to cores
| (32) |
The lower integration limit reflects the fact that a core with a mass heavier than the initial gas cloud cannot be formed.
We can now determine the mass sprectrum of cores formed from a collection of gas clouds with masses . We define the mass spectrum as the number of cores per logarithmic mass bin, normalized by
| (33) |
This mass function is given by
| (34) | |||||
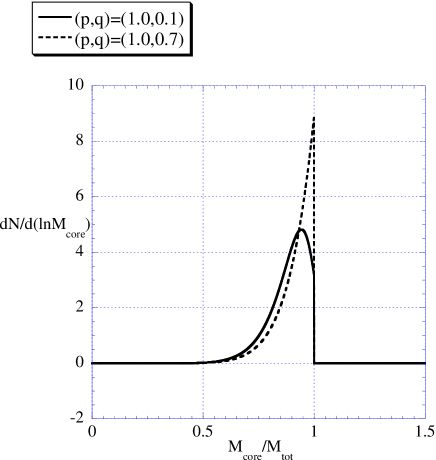
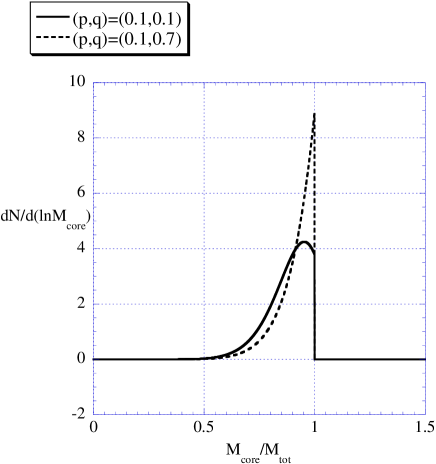
From numerical simulations, we have obtained and . There are two parameters and in the mass spectrum. The mass spectra are depicted for and in Fig. 8(a), while for and in Fig. 8(b). Core masses heavier than the total mass are cut off. The mass associated with the peak in the spectra is smaller than for and , while equal to for and [these regions are however not fully relevant because of the restrictions to be applied to Eq. (30]. and the average mass of the formed core defined as
| (35) |
are summarized in Table 2. Although can be just equal to , the average mass is always smaller.
The main feature of the mass spectrum is a steep slope in the low-mass tail, due to the small value of the critical exponent . This fact has several implications. First, the cores are created with nearly the mass of the initial gas cloud. In the formalism originally introduced by Press and Schechter ps1974 , it is assumed that overdense regions with a single mass scale, if they collapse, result in bound objects with the same mass. However, our result implies that the mass of the collapsed object is not the same as the mass of the initial overdense region, but may be rather smaller if the collapse is near-critical. Second, the critical collapse alone cannot account for the shape of the observed IMF, which shows a negative exponent on most of the mass spectum while we find a large positive exponent. Other phenomenon are responsible for the negative exponent.
V summary
We have analyzed the critical behavior in the collapse of a Newtonian isothermal gas by the renormalization group approach and in numerical simulations. The renormalization group analysis in the Newtonian case is similar to the general relativity case. We have observed the critical phenomenon in the numerical simulation, which can be compared to those observed during black hole formation in the collapse of radiation fluid in general relativity. The scaling law for the formed black hole mass with critical exponent in general relativity is replaced by a scaling law for the collapsed core mass with critical exponent . The critical solution is a continuous self-similar solution, specifically the first member of Hunter’s family of solutions.
For the supercritical collapse, the collapse near the center converges (early for low temperature, late for almost critical temperature) to another continuous self-similar solution, the Larson-Penston solution. Generic collapse converges to this attractor solution, which suggests the universality of self-similarity in gravitational collapse. This phenomenon is an example for the validity of the self-similarity hypothesis in gravitational collapse.
Some implications of Newtonian critical phenomena to astrophysics have been discussed. The critical behavior alone does not determine the IMF, clumps mass spectrum in molecular clouds and so on. However it suggest some limitations to Press-Schechter’s model. The isothermal gas is a good approximation for a gas system with a short cooling time, while it will not be valid for optically thick clouds, where adiabatic gas model are more relevant. Consequently, critical phenomena should be investigated for more general equations of state. Research along this line is now under investigation maeda2002 .
Newtonian gravity is a simple model for more complicated gravitational theories, such as general relativity. Newtonian critical behaviors in gravitational collapse provide a good laboratory for investigating various effects on the critical phenomena in general relativity, such as deviation from spherical symmetry, rotation, external environment, a variety of matter fields, and so on.
Acknowledgements.
We are grateful to T. Koike, B.J. Carr and R. Tavakol for helpful comments. TH and BS were supported by the Grant-in-Aid for Scientific Research (Nos. 05540 and 00273) from the Japanese Ministry of Education, Culture, Sports, Science and Technology.References
- (1) S. Chandrasekhar, An Introduction to the Study of Stellar Structure (Dover, New York, 1939).
- (2) T. Padmanabhan, Phys. Rep. 188, 285 (1999).
- (3) H.J. de Vega, N. Sánchez and F. Combes, Nature (London) 383, 53 (1996).
- (4) B. Semelin, H.J. de Vega, N. Sánchez and F. Combes, Phys. Rev. D 59, 125021 (1999).
- (5) M.W. Choptuik, Phys. Rev. Lett. 70, 9 (1993).
- (6) C.R. Evans and J.S. Coleman, Phys. Rev. Lett. 72, 1782 (1994).
- (7) T. Koike, T. Hara and S. Adachi, Phys. Rev. Lett. 74, 5170 (1995).
- (8) D. Maison, Phys. Lett. B 366, 82 (1996).
- (9) T. Koike, T. Hara and S. Adachi, Phys. Rev. D 59, 104008 (1999).
- (10) D.W. Neilsen and M.W. Choptuik, Class. Quantum Grav. 17, 733 (2000); 17, 761 (2000).
- (11) J. Yokoyama, Phys. Rev. D 58, 107502 (1998).
- (12) J.C. Niemeyer and K. Jedamzik, Phys. Rev. Lett. 80, 5481 (1998).
- (13) C. Gundlach, Living Rev. Relativ. 2, 4 (1999).
- (14) B.J. Carr and A.A. Coley, Class. Quantum Grav. 16, R31 (1999).
- (15) B.J. Carr, (unpublished).
- (16) M.V. Penston, Mon. Not. R. Astron. Soc. 144, 425 (1969).
- (17) R.B. Larson, Mon. Not. R. Astron. Soc. 145, 271 (1969).
- (18) T. Hanawa and K. Nakayama, Astrophys. J. 484, 238 (1997).
- (19) T. Hanawa and T. Matsumoto, Publ. Astron. Soc. Jpn. 52, 241 (2000); Astrophys. J. 521, 703 (2000).
- (20) T. Tsuribe and S. Inutsuka, Astrophys. J. 526, 307 (1999).
- (21) T. Harada and H. Maeda, Phys. Rev. D 63, 084022 (2001).
- (22) A. Ori and T. Piran, Phys. Rev. Lett. 59, 2137 (1987); Gen. Relativ. Grav. 20, 7 (1988).
- (23) A. Ori and T. Piran, Phys. Rev. D 42, 1068 (1990).
- (24) T. Harada, Phys. Rev. D 58, 104015 (1998).
- (25) T. Harada, H. Iguchi, and K. Nakao, Prog. Theor. Phys. 107, 449 (2002).
- (26) T. Harada, Class. Quantum Grav. 18, 4549 (2001).
- (27) A. Ori and T. Piran, Mon. Not. R. Astron. Soc. 234, 821 (1988).
- (28) H. Maeda and T. Harada, Phys. Rev. D 64, 124024 (2001).
- (29) C. Hunter, Astrophys. J. 218, 834 (1977).
- (30) W.H. Press and P. Schechter, Astrophys. J. 187, 425 (1974).
- (31) H. Maeda, (in preparation).
| Model | Density Profile† | Critical Temperature |
|---|---|---|
| 1 | 0.4882608 | |
| 2 | 0.5351886 | |
| 3 | 0.5470739 | |
| 4 | 0.2752568 |
† The total mass and initial size of the cloud are normalized to be unity.
| 0.87 | 0.94 | |
| 0.90 | 1.0 | |
| 0.86 | 0.95 | |
| 0.90 | 1.0 |
 |
 |
| (a) | (b) |
 |
 |
| (a) | (b) |

 |
 |
| (a) | (b) |