A topology visualisation tool for large-scale communications networks
A visualisation tool is presented to facilitate the study on large-scale communications networks. This tool provides a simple and effective way to summarise the topology of a complex network at a coarse level.
Introduction
It is relevant to study the topology of information and communications networks, such as the Internet, the World Wide Web and peer-to-peer (P2P) overlay networks, because structure fundamentally affects functions. These networks contain thousands or even millions of connections and their topologies are usually characterised by statistics [1, 2]. Here we introduce a simple tool to visualise a network’s connectivity.
Methodology
In graph theory degree is defined as the number of links a node has. We sort network nodes in a list of decreasing degrees, i.e. at the top position is the best-connected node and next is the second best-connected node. For each group of nodes that have the same degree, we rearrange the nodes in the decreasing order of their neighbours largest degree; for those having the same neighbours largest degree as well, we sort their neighbours second-largest degree; and this process continues until all neighbours degrees have been considered. We then assign each node an index according to its position in the sorted list.
If a network contains nodes, the network’s connectivity information can be represented as an adjacency matrix, in which entry is the number of links connecting between nodes with the sorted indexes of and , where . For a simple undirected graph (i.e. no self-loop and no multiple links between a pair of nodes), the adjacency matrix is a symmetric -matrix with zeros on its diagonal. Then the network’s topology information can be visualised as a bitmap of sorted adjacency matrix (BOSAM). One may consider the neighbours largest degree as a measure of the ‘cohesion’ force a node receives from the network core of high-degree nodes. Then an alternative BOSAM can be obtained by sorting the neighbours smallest degree, i.e. a measure of the ‘radiation’ force the node receives from the peripheral low-degree nodes.
Results
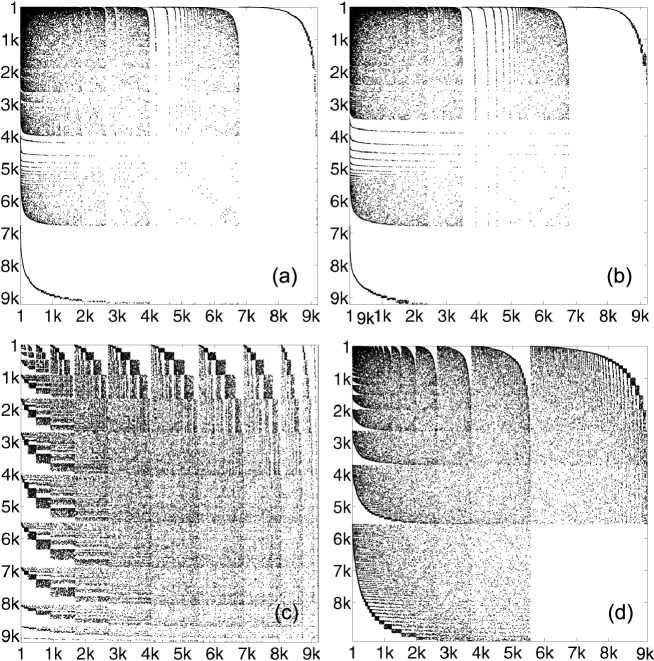
Figure 1(a) shows BOSAM of the Internet topology at the autonomous systems (AS) level collected by CAIDA [3], on which black pixels are densely concentrated along the top and the left borders where or . This indicates that the Internet AS graph exhibits the following properties: (1) power-law degree distribution [4], which means a small number of nodes have very large numbers of links whereas the majority of nodes have only a few links; (2) negative degree-degree correlation [5], which means low-degree nodes tend to connect to high-degree nodes and vice versa; and (3) rich-club phenomenon [6], which describes the fact that high-degree nodes, or rich nodes, are tightly interconnected with themselves. These properties explain why the Internet is so ‘small’ that the average shortest path between a pair of nodes is only 3.12 hops: while the rich nodes know each other very well and collectively function as a super traffic hub for the network, the majority of the nodes, peripheral low-degree nodes, are always near the rich-club core. Figure 1(b), (c) and (d) show that by comparison, the positive-feedback preference (PFP) Internet model [7] better resembles the Internet AS graph than the Erdös-Rényi (ER) random model [8] and the Barabási-Albert (BA) scale-free model [9].
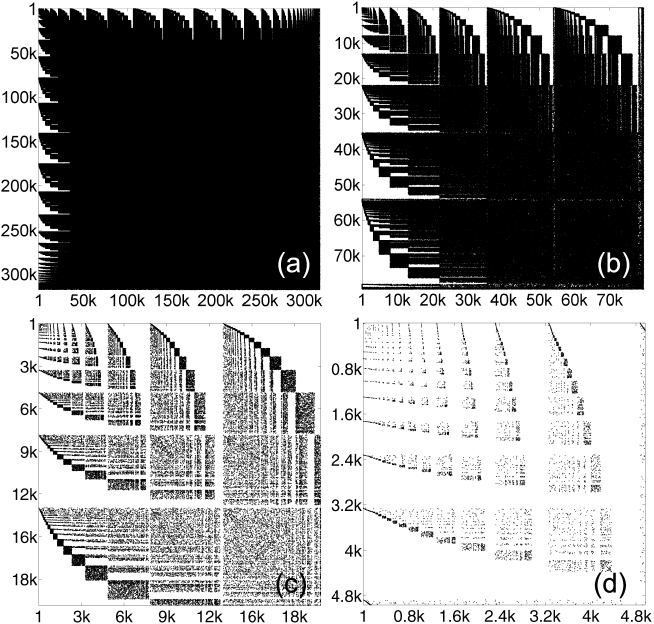
The Gnutella peer-to-peer (P2P) file-sharing network [10] contains 317,592 nodes and 7,396,948 links. Figure 2 shows Gnutella is profoundly different from the Internet AS graph. Instead it shows similarity to the ER random model. Figure 2 also reveals that Gnutella exhibits a fractal-like structure which has not been captured by the usual statistic studies.
Conclusion
Although BOSAM is a coarse representation of a network’s structural properties, we show that this simple tool is effective in distinguishing network topologies.
Acknowledgment
YG and CC are supported by Chinese NSFC grant no. 60672069 and SRFDP grant no. 20050004033. SZ is supported by the UK Nuffield Foundation grant no. NAL/01125/G.
Y. Guo, C. Chen (Beijing JiaoTong University, China) and S. Zhou (University College London, UK)
E-mail: ychguo@bjtu.edu.cn
References
- [1] R. Pastor-Satorras and A. Vespignani, Evolution and Structure of the Internet - A Statistical Physics Approach. Cambridge University Press, 2004.
- [2] M. Newman, A.-L. Barabási, and D. Watts, Eds., The Structure and Dynamics of Networks. Princeton University Press, 2006.
- [3] P. Mahadevan, D. Krioukov, M. Fomenkov, B. Huffaker, X. Dimitropoulos, K. Claffy, and A. Vahdat, “The Internet AS-level topology: Three data sources and one definitive metric,” Comput. Commun. Rev., vol. 36, pp. 17–26, 2006.
- [4] M. Faloutsos, P. Faloutsos, and C. Faloutsos, “On power-law relationships of the Internet topology,” Comput. Commun. Rev., vol. 29, pp. 251–262, 1999.
- [5] A. Vazquez, R. P.-S. M. Boguna, Y. Moreno, and A. Vespignani, “Topology and correlations in structured scale-free networks,” Phys. Rev. E, vol. 67, no. 046111, 2003.
- [6] S. Zhou and R. J. Mondragón, “The rich-club phenomenon in the Internet topology,” IEEE Comm. Lett., vol. 8, no. 3, pp. 180–182, 2004.
- [7] S. Zhou and R. J. Mondragón, “Accurately modelling the Internet topology,” Phys. Rev. E, vol. 70, no. 066108, 2004.
- [8] P. Erdős and A. Rényi, “On random graphs,” Publ. Math., vol. 6, pp. 290–297, 1959.
- [9] A. L. Barabási and R. Albert, “Emergence of scaling in random networks,” Science, vol. 286, pp. 509–512, 1999.
- [10] D. Stutzbach, R. Rejaie, and S. Sen, “Characterizing unstructured overlay topologies in modern p2p file-sharing systems,” in Proc. of the ACM Internet Measurement Conference (IMC), 2005.
Figure 1
BOSAM of (a) the Internet AS graph collected by CAIDA; (b) the PFP Internet model; (c) the ER random model; and (d) the BA scale-free model. All networks have 9,204 nodes and 27,612 links.
Figure 2
BOSAM of (a) Gnutella P2P network and enlargements of the top-left corner of (a) at scales of (b) 1:4, (c) 1:16, and (d) 1:64.