Chinese Internet AS-Level Topology
Abstract
We present the first complete measurement of the Chinese Internet topology at the autonomous systems (AS) level based on traceroute data probed from servers of major ISPs in mainland China. We show that both the Chinese Internet AS graph and the global Internet AS graph can be accurately reproduced by the Positive-Feedback Preference (PFP) model with the same parameters. This result suggests that the Chinese Internet preserves well the topological characteristics of the global Internet. This is the first demonstration of the Internet’s topological fractality, or self-similarity, performed at the level of topology evolution modeling.
1 Introduction
During the last three decades, the Internet has experienced fascinating evolution, both exponential growth in traffic and endless expansion in topology. It is crucial to obtain a good description of the topology, because effective engineering of the Internet is predicated on a detailed understanding of issues such as the large-scale structure of its underlying physical topology, the manner in which it evolves over time, and the way in which its constituent components contribute to its overall function [1].
The Internet contains millions of routers, which are grouped into thousands of subnetworks, called autonomous systems (AS). Network structure inside an AS only affect local properties, whereas the delivery of data traffic through the global Internet depends on the complex interactions between ASes that exchange routing information using the Border Gateway Protocol (BGP) [2]. This paper focuses on the Internet AS-level topology, on which a node is an AS and a link represents a BGP peering relation between two ASes. Measurements of the Internet AS-level topology [3, 4, 5] became available in late 1990’s. These measurements have greatly improved our understanding of the evolution and structure of the Internet [6].
During the last decade, the Internet has developed rapidly in China. However measurement of the Chinese Internet topology has only been carried out from outside of the country. In this paper, we present the first and so far the most complete measurement of the Chinese Internet AS graph based on traceroute data probed from servers of major ISPs inside mainland China. The obtained Chinese Internet AS graph is a small regional subgraph of the massive global Internet AS graph because it contains only ASes located in mainland China. We show that both the global graph and the small local graph can be accurately reproduced by the Positive-Feedback Preference (PFP) model [7, 8] with the same parameters. This result suggests that the Chinese Internet preserves well the topological characteristics of the global Internet. Our work demonstrates the existence of a statistical fractality in the description of the Internet AS-level topology.
2 Measurements of Internet Topology
There are two primary methods for inferring Internet AS-level topology: one is the passive measurements inferring AS connectivity information from BGP routing tables, e.g. [3, 4]; and the other is the active measurement which extracts AS graph from traceroute probing data, e.g. [5]. AS graphs produced by the two methods exhibit a number of different topology properties [9]. The BGP measurements reflect the control plane of the AS topology, whereas the traceroute measurements reflect the data plane of the AS topology. BGP tables have the advantage that they are relatively easy to parse, process and comprehend, however BGP measurements suffer certain limitations in that they do not reflect how traffic actually travels toward a destination network and they rarely include Internet exchange points (IXP) ASes. Traceroute measurements also have inherent limitations associated with converting IP addresses (on the router level) to AS numbers, however traceroute measurements reflects the actual paths that IP packets follow. In this paper we focus on the active measurements based on traceroute data.
2.1 The Global Internet AS Graph – ITDK0304
In 1998, CAIDA [5] launched the Macroscopic Topology Project to collect and analyze Internet-wide topology at a representatively large scale. CAIDA’s topology measurement tool, skitter, implements the Internet Control Message Protocol (ICMP). It collects the forward path from the monitor to a given destination and captures the addresses of intermediate routers in the path. The skitter runs on more than 20 monitors around the globe and actively collects forward IP path to over half a million destinations across the current IPv4 address space. CAIDA extracts interconnect information of ASes from the massive traceroute data collected by skitter and produces AS adjacency graphs. CAIDA argues [10] that while inherent limitations of the traceroute-based probing methodology do not allow for 100%-accurate extraction of the real Internet topology from skitter data, CAIDA seeks data sources that are collectively most likely to capture a precise and coherent snapshot of macroscopic Internet structure. We extract the global Internet AS graph in this paper from the Internet topology data kit ITDK0304 collected by CAIDA in April 2003 [11]. The ITDK0304 Internet AS graph contains 9024 nodes and 28959 links.
2.2 The Chinese Internet AS Graph – CN05
The Internet in China has developed rapidly in the last decade. Today the country has more than 100 million Internet users [12]. However measurement of the Chinese Internet topology has only been carried out from outside of the country. For example, currently there is no skitter monitor located in China.
Recently we measured the Chinese AS graph using the active measurement method. We collected traceroute data from six servers belonging to the following major ISPs in mainland China: CSTNET (China Science and Technology Net), CERNET (China Education and Research Net), CAPINFO Company Limited, ChinaTelecom, ChinaNetCom and CGWNET (China Great Wall Net). The measurement process took place during the first week in May 2005.
From each server, a traceroute tool probes 7436 destination IP addresses in mainland China, including (i) 3010 Web server addresses, which are obtained from the Chinese Web yellow pages database [13], and (ii) 4426 random IP addresses, which are obtained by using the stub network sampling method [14] which samples one IP address from every IP prefix assigned to mainland China by APNIC [15]. The traceroute tool probes each IP address for three times. Although all the Web server addresses are reachable by HTTP, they are not 100% reachable by the traceroute tool because many Web servers and ASes do not allow ICMP probing from external servers. Of the 3010 Web server addresses, the traceroute tool reached 1859 addresses and ASes to which 2753 addresses belong. Of the 4426 random IP addresses, the traceroute tool reached 336 addresses and ASes of 3485 addresses. The success rate of probing random IP addresses is even lower because many randomly sampled IP addresses do not exist. We observed that the size of obtained Chinese AS graph will not increase significantly when probing more destination addresses.
We accumulated all the traceroute data and used the same techniques of CAIDA [10] to convert IP addresses to corresponding AS numbers announced by APNIC. The resulted Chinese AS graph is called CN05, which contains 84 nodes and 211 links. The dataset is available at http://www.adastral.ucl.ac.uk/~szhou/resource.htm in the format of a list of peering AS numbers. Our measurement is more complete than the Chinese AS graph extracted from CAIDA’s ITDK0304 which contains only 71 Chinese ASes and 160 peering links among them.
3 Comparison Between The Two AS Graphs
The Chinese Internet AS graph CN05 is a small subgraph of the global Internet AS graph ITDK0304. In this paper we compare the two AS graphs in an indirect way, i.e., we contrast the two AS graphs against networks generated by the Positive-Feedback Preference (PFP) model [7, 8], which has been regarded by CAIDA as the most precise and complete Internet topology generator to date [16, 17, 18].
3.1 The Positive-Feedback Preference Model
The PFP model is an extensive modification of the Barabási-Albert model [19]. The PFP model grows Internet-like networks by using the following two generative mechanisms, namely the interactive growth and the positive-feedback preference, which are coincident with a number of observations on the Internet history data [20, 21, 22].
Interactive Growth.
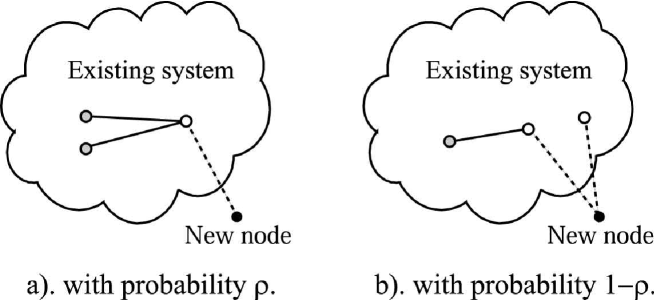
Starting from a small random graph, at each time step, 1) with probability (see Fig. 1a), a new node is attached to an old node in the existing system, and then two new links are added connecting the old node to two other old nodes; and 2) with probability (see Fig. 1b), a new node is attached to two old nodes, and then one new link is added connecting one of the two old nodes to another old node.
Positive-Feedback Preference.
Degree is defined as the number of links a node has. The preference probability that a new link is attached to node is given as
| (1) |
in which a node’s ability of acquiring new links increases as a feed-back loop of the node degree. Such a preference scheme results in “the rich not only get richer, but get disproportionately richer”.
Numerical simulation shows that the PFP model produces the best result when the parameters and [7, 8]. As stated in the status report of IRTF Routing Research Group’s (RRG) Future Domain Routing (FDR) Scalability Research Subgroup (RR-FS) in 2005 [18], the PFP model “is the best non-equilibrium network growth model, with respect to its proximity to observed Internet topology.”
3.2 Simulation Result
We use the PFP model to grow networks to the same number of nodes as CN05 and ITDK0304 (see Table 1) using the same model parameters as suggested in previous numerical simulations [7, 8], i.e., and . For each AS graph, ten networks are generated using random seeds and their properties are averaged.
| CN05 | PFP1 | ITDK0304 | PFP2 | |
| Number of nodes | 84 | 84 | 9204 | 9204 |
| Number of links | 211 | 217 | 28959 | 27612 |
| Maximum degree | 38 | 39 | 2070 | 1950 |
| Degree exponent | -2.21 | -2.21 | -2.254 | -2.255 |
| Assortative coefficient | -0.328 | -0.298 | -0.236 | -0.234 |
| Top clique size | 3 | 3 | 16 | 16 |
| Rich-club exponent | -1.42 | -1.42 | -1.48 | -1.49 |
| Average triangle coefficient | 5.6 | 6.8 | 21.4 | 19.1 |
| Characteristic path length | 2.54 | 2.54 | 3.12 | 3.07 |
| Maximum coreness | 5 | 6 | 28 | 27 |
The Internet topology is extremely complex. Researchers have proposed a number of metrics to quantify and explain the structure of Internet [6]. In this paper we compare the AS graphs and the PFP networks by examining the following topological properties:
-
1.
Degree distribution
-
2.
Degree correlation
-
3.
Rich-club connectivity
-
4.
Triangle coefficient
-
5.
Shortest path length
-
6.
-core structure
Note that CN05 is a very small graph, and therefore all its statistics are of very low statistical significance.
3.2.1 Degree Distribution
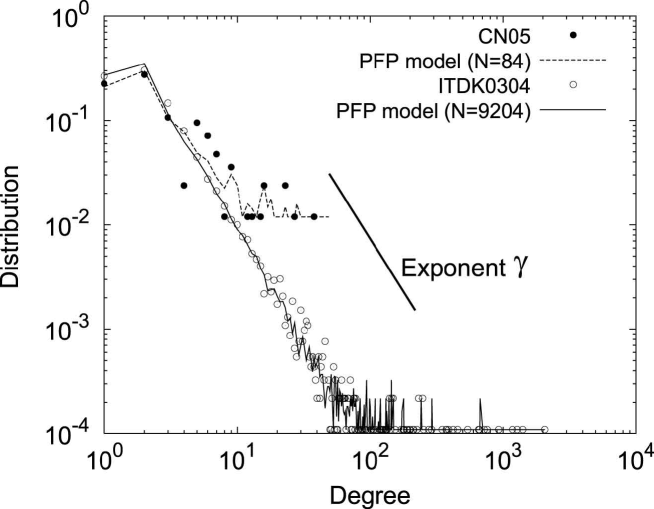
Degree is a local property but the probability distribution of degree provides a view on the global structure of a network. Faloutsos et al [23] showed that the Internet AS-level topology exhibits a power-law degree distribution,
This means a few nodes have very large numbers of links, however the vast majority of nodes have only a few links. This discovery is significant because it invalidated previous Internet models that were based on the classical random graphs having Poisson degree distributions.
Fig. 2 shows that ITDK0304 and CN05 are characterized by a power-law degree distribution (Degree distribution of CN05 is not statistically significant due to its small number of nodes.) with the power-law exponent of CN05, , is slightly larger than that of the ITDK0304, (see Table 1). It is clear that the PFP networks closely match the degree properties of the two AS graphs.
As [24] pointed out, the degree distribution alone does not uniquely characterize a network topology. To describe the full picture of network structure, we need to examine other important topological properties as well.
3.2.2 Degree Correlation
Recently a number of studies have shown that the degree correlation, or the joint degree distribution , defined as the probability that a link connects - and -degree nodes, plays a significant role in defining a network’s structure [9, 25, 26, 27]. Networks exhibit different mixing patterns according to their degree correlation. Social networks are assortative mixing where nodes tend to attach to alike nodes, i.e. high-degree nodes to high-degree nodes and low-degree nodes to low-degree nodes. On contrast technological and biological networks, including the Internet, are dissasortative mixing where high-degree nodes tend to connect with low-degree nodes, and visa versa.
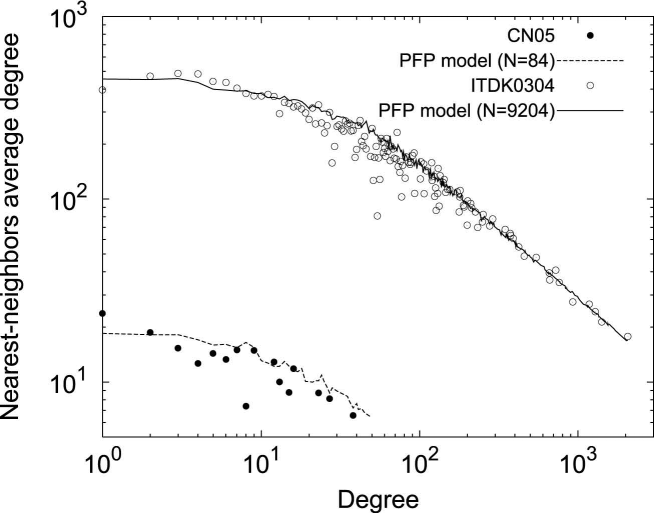
A network’s mixing pattern can be indicated by the correlation between a node’s degree and its nearest-neighbors average degree [22]. A mixing pattern can also be identified by measuring the assortative coefficient [25], , which is defined as
where is the number of links a network has, and , are the degrees of the nodes at the ends of the th link, with . If , a network is assortative mixing; and if , a network is dissasortative mixing.
Fig. 3 shows that ITDK0304 and CN05 clearly exhibit a negative correlation between degree and the nearest-neighbors average degree. Also as shown in Table 1, both the AS graphs are characterized by a negative assortative coefficient. The PFP networks precisely reproduce the disassortative mixing properties of the Internet AS graphs.
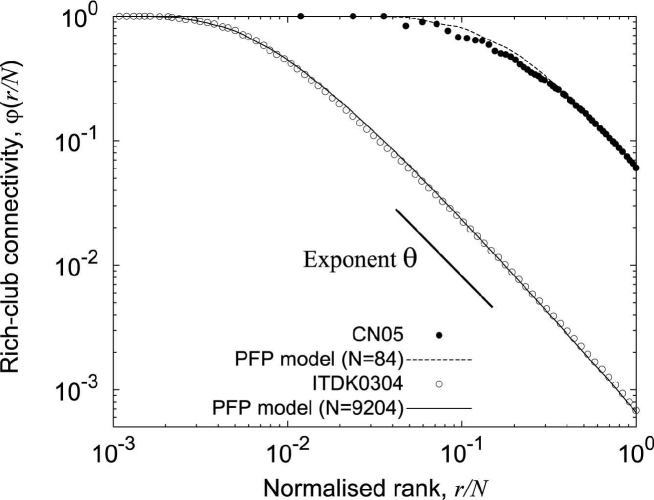
3.2.3 Rich-Club Connectivity
A hierarchy property of the Internet’s structure is the rich-club phenomenon [28], which describes the fact that well connected nodes, rich nodes, are tightly interconnected with other rich nodes, forming a core group or rich-club. The rich-club phenomenon does not imply that the majority links of the rich nodes are directed to other club members. Indeed, rich nodes have very large numbers of links and only a few of them are enough to provide the interconnectivity to other club members, whose number is anyway small.
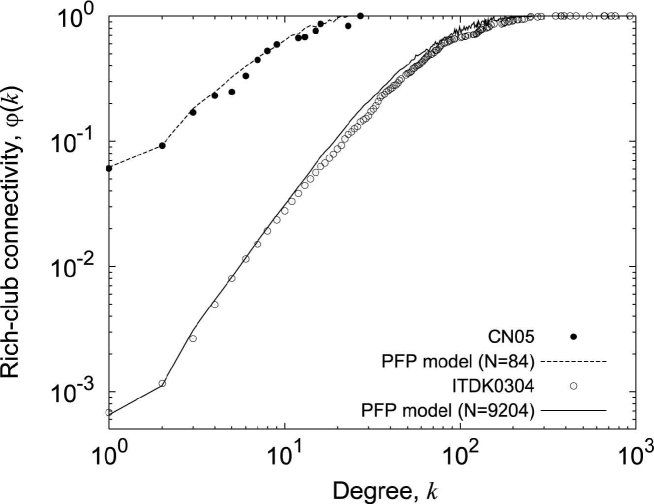
The rich-club membership can be defined as “ nodes with degree no smaller than ” or “ the best connected nodes ”, where rank denotes a node’s position on the non-increasing degree list of a graph of size . The rich-club phenomenon is quantitatively assessed by the metric of rich-club connectivity, , which is defined as the ratio of the actual number of links to the maximum possible number of links among members of a rich-club. Rich-club connectivity measures how well club members “ know” each other, e.g. means that all the members have a direct link to any other member, i.e. they form a fully connected mesh, a clique. The top clique size is defined as the maximum number of highest rank nodes still forming a clique.
Fig. 4 illustrates the rich-club connectivity as a function of node degree. It shows that a node in ITDK0304 should have a degree larger than 200 to be a member of the top clique, whereas a node in CN05 can be a member of the top clique with a degree of merely 20. Fig. 5 illustrates the rich-club connectivity as a function of node rank normalized by the network size . We can see that both CN05 and ITDK0304 obey a power law of with the exponent of and respectively (see Table 1). The PFP networks accurately resemble all these rich-club properties of the two AS graphs.
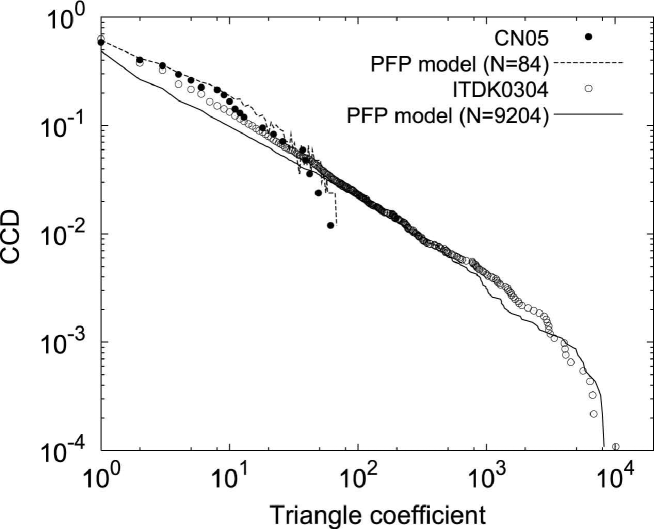
3.2.4 Triangle Coefficient
Short cycles (e.g. triangles and quadrangles) encode the redundancy information in a network structure because the multiplicity of paths between any two nodes increases with the density of short cycles. The triangle coefficient, , is defined as the number of triangles that a node shares [7]. Different from the widely-studied clustering coefficient [29], which can be given as , the triangle coefficient is able to infer neighbor clustering information of nodes with different degrees.
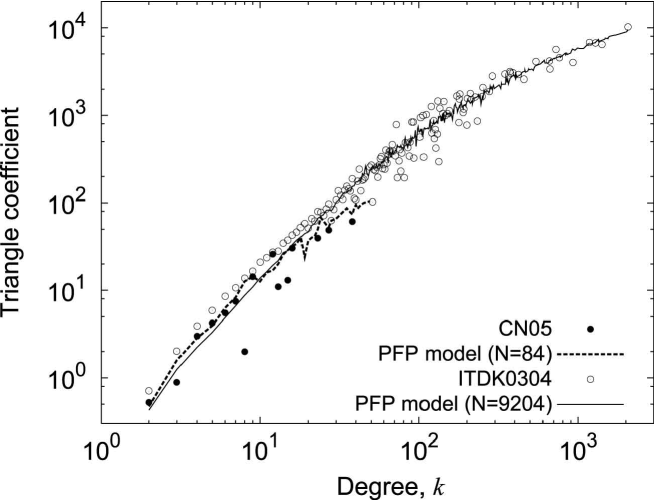
Fig. 6 shows the complementary cumulative distribution (CCD) of triangle coefficient. The two AS graphs exhibit similar power-law distributions. Fig. 7 shows that the correlation between degree and triangle coefficient of the two AS graphs are nearly overlapped with each other – the larger degree a node has, the more triangles it shares. The PFP networks closely match these triangular properties of the two AS graphs.
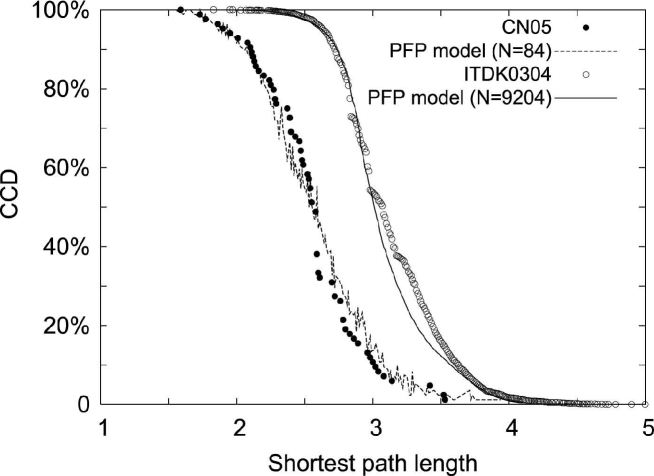
3.2.5 Shortest Path Length
The Internet is a small-world network [29] because it is possible to get to any node via only a few links among adjoining nodes. The shortest path length is the minimum hop distance between a pair of nodes. The characteristic path length, , of a network is the average of shortest path lengths over all pairs of nodes. Performance of modern routing algorithms depend strongly on the distribution of shortest path [30].
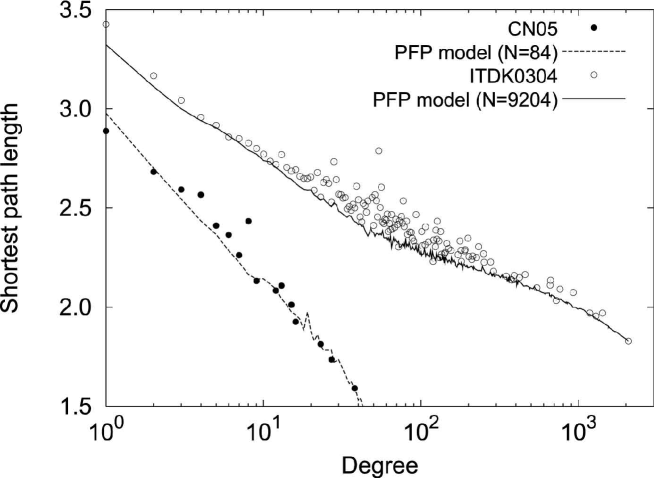
Fig. 8 shows the CCD of shortest path length. It is clear that CN05 is smaller than ITDK0304 (also see in Table 1). Fig. 9 shows that the two AS graphs show a negative correlation between the shortest path length and node degree, i.e. in general, the higher degree a node has, the shorter average distance between the node to all other nodes. Again the PFP networks precisely resemble the shortest path properties of the two AS graphs.
3.2.6 -core Structure
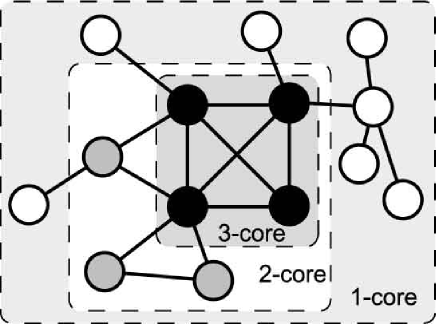
Recently researchers are interested in a topological property called the -core [31]. As shown in Fig. 10, a -core of a network can be obtained by recursively removing all the nodes of degree less than , until all nodes in the remaining graph have at least degree . A node has the coreness value of , if it belongs to the -core but not to -core. Nodes having the same coreness value of are called the -shell of a network. The -core decomposition, by recursively pruning the least connected nodes, disentangles the hierarchical structure of a network by progressively focusing on its central cores.
Fig. 11 shows visualizations of the networks -core structure. Pictures are produced by the tool LaNet-VI [32, 33]. On each picture a network node is illustrated as a dot, whose size is exponentially proportional to the node’s degree, and whose color represents the node’s coreness value. Dots are distributed on a series of concentric circular -shells corresponding to their coreness value . The diameter of each shell depends on the shell index , and is proportional to . The pictures clearly show that the PFP networks closely resemble the -core structure of the two AS graphs.
3.3 Discussion
The above analysis demonstrates that the Chinese Internet AS graph preserves well the structural characteristics of the global Internet AS graph. The Internet in China has developed in a social-economic environment that is characterized by more centralized planning and less commercial competition than the global Internet dominated by the West. However this does not make the evolution of the Internet AS-level topology in China different from the West, because the local social-economic factors mainly affect the development of the last-mile access networks, e.g. China has a small number of IPSs, but all ISPs are very large. Whereas the evolution of the Internet AS-level topology is primarily influenced by technological factors, which are fairly universal. That is to say, when making a decision on a BGP peering relationship [34], all ISPs around the world tend to consider the same technical issues, such as performance objectives and technical constrains. In our future work, we will investigate the Internet AS-level subgraphs in other countries and regions.
4 Conclusion
In this paper we present the first traceroute measurement of the Chinese Internet AS-level topology collected from probing servers inside the country. We compare the global Internet AS graph with the Chinese Internet AS graph using the PFP model as a yardstick. We examine a diversified set of topological characteristics of the two AS graphs including degree distribution, degree correlation, rich-club connectivity, triangle coefficient, shortest path length and -core structure. Remarkably the same parameters in the PFP model to describe the global Internet AS graph also describe the Chinese Internet AS graph. This is the first demonstration of the Internet’s topological fractality, or self-similarity, performed at the level of topology evolution modeling.
5 Acknowledgments
This work is partly supported by the UK Nuffield Foundation under Grant No. NAL/01125/G and the National Natural Science Foundation of China under Grant No. 60673168. The Internet data kit ITDK0304 is provided by CAIDA.
References
- [1] Floyd, S. and Kohler, E.: ‘Internet research needs better models’. Comput. Commun. Rev., 2003, 33, (1), pp. 29–34.
- [2] Quoitin, B., Pelsser, C., and Swinnen, L.: ‘Interdomain traffic engineering with BGP’. IEEE Communications Magazine, 2003, 41, (5), pp. 122–128. .
- [3] National Laboratory for Applied Network Research. http://moat.nlanr.net/, accessed November 2006.
- [4] Route Views Project, University of Oregon, Eugene. http://www.routeviews.org/, accessed November 2006.
- [5] The Cooperative Association For Internet Data Analysis (CAIDA), San Diego Supercomputer Center, University of California, San Diego, USA. http://www.caida.org/, accessed November 2006.
- [6] Pastor-Satorras, R. and Vespignani, A.: ‘Evolution and Structure of the Internet - A Statistical Physics Approach’. (Cambridge University Press, 2004).
- [7] Zhou, S. and Mondragón, R. J.: ‘Accurately modelling the Internet topology’. Phys. Rev. E, 2004, 70, (066108).
- [8] Zhou, S.: ‘Understanding the evolution dynamics of Internet topology’. Phys. Rev. E, 2006, 74, (016124).
- [9] Mahadevan, P., Krioukov, D., Fomenkov, M., Huffaker, B., Dimitropoulos, X., claffy, kc, and Vahdat, A.: ‘The Internet AS-level topology: Three data sources and one definitive metric’. Comput. Commun. Rev., 2006, 36, (1), pp. 17–26.
- [10] Hyun, Y., Broido, A., and claffy, kc: ‘Traceroute and BGP AS path incongruities’. http://www.caida.org/outreach/papers/2003/ASP/, accessed November 2006.
- [11] CAIDA Internet topology data kit ITDK#0304. http://www.caida.org/tools/measurement/skitter/idkdata.xml, accessed November 2006.
- [12] China Internet Network Information Center: ‘The 18th Statistical Report on the Internet Development in China’. 2006. http://www.cnnic.net.cn/en/index/0O/index.htm, accessed November 2006.
- [13] Chinese Web Yellow Pages. http://www.chinayp.com.cn/, accessed November 2006.
- [14] Jinag, Y. and He S.: ‘Study on the destination selection method in router-level Internet topology measurement’. Journal on Communications, 2006, 27, (2). http:/pact518.hit.edu.cn/~jy/pdfs/jc2702-p29.pdf, accessed November 2006.
- [15] Asia Pacific Network Information Center (APNIC). http://www.apnic.net/, accessed November 2006.
- [16] IRTF Routing Research Group’s (RRG) Future Domain Routing (FDR)Scalability Research Subgroup (RR-FS). http://rr-fs.caida.org/, accessed November 2006.
- [17] CAIDA’s NeTS-NR Project: ‘Toward Mathematically Rigourous Next-Generation Routing Protocols for Realistic Network Topologies’. 2004, http://www.caida.org/funding/nets-nr/, accessed November 2006.
- [18] Krioukov, D. and Krapivsky, P.: ‘Power Laws as a Pre-asymptotic Regime of the PFP Model’. http://www.caida.org/publications/presentations/2006/isma0605_dima/isma0605_dima.pdf, accessed November 2006.
- [19] Barabási, A. L. and Albert, R.: ‘Emergence of scaling in random networks’. Science, 1999, 286, pp. 509–512.
- [20] Chen, Q., Chang, H., Govindan, R., Jamin, S., Shenker, S. J., and Willinger, W.: ‘The origin of power laws in Internet topologies (revisited)’. Proc. of INFOCOM, 2002, pp. 608–617.
- [21] Park, S. T., Khrabrov, A., Pennock, D. M., Lawrence, S., Giles, C. L., and Ungar, L. H.: ‘Static and dynamic analysis of the Internet’s susceptibility to faults and attacks’. Proc. of INFOCOM, 2003, 3, pp. 2144–2154.
- [22] Vázquez, A., Pastor-Satorras, R., and Vespignani, A.: ‘Large-scale topological and dynamical properties of Internet’. Phys. Rev. E, 2002, 65, (066130).
- [23] Faloutsos, M., Faloutsos, P., and Faloutsos, C.: ‘On power–law relationships of the Internet topology’. Comput. Commun. Rev., 1999, 29, pp. 251–262.
- [24] Tangmunarunkit, H., Govindan, R., Jamin, S., Shenker, S., and Willinger, W.: ‘Network topology generators: Degree-based vs. structural’. Proc. of SIGCOMM, 2002, pp. 147–159.
- [25] Newman, M. E. J.: ‘Mixing patterns in networks’. Phys. Rev. E, 2003, 67 (026126).
- [26] Vazquez, A., M. Boguna, Y. Moreno, R. P.-S., and Vespignani, A.: ‘Topology and correlations in structured scale-free networks’. Phys. Rev. E, 2003, 67, (046111).
- [27] Maslov, S., Sneppen, K., and Zaliznyak, A.: ‘Detection of topological patterns in complex networks: correlation profile of the Internet’. Physica A, 2004, 333, pp. 529.
- [28] Zhou, S. and Mondragón, R. J.: ‘The rich-club phenomenon in the Internet topology’. IEEE Comm. Lett., 2004, 8, (3), pp. 180–182.
- [29] Watts, D. J. and Strogatz, S. H.: ‘Collective dynamics of ‘small-world’ networks’. Nature, 1998, 393, pp. 440.
- [30] Labovitz, C., Ahuja, A., Wattenhofer, R., and Venkatachary, S.: ‘The impact of Internet policy and topology on delayed routing convergence’. Proc. of INFOCOM, 2001, pp. 537–546.
- [31] Dorogovtsev, S. N., Goltsev, A. V., and Mendes, J. F. F.: ‘-core organization of complex networks’. Phys. Rev. Lett., 2006, 96, (040601).
- [32] Alvarez-Hamelin, J.-I., Dall’Asta, L., Barrat, A., and Vespignani, A.: ‘-core decomposition: a tool for the visualization of large scale networks’. http://arxiv.org/abs/cs/0511007, accessed November 2006.
- [33] Topology visualisation tool LaNet-VI. http://xavier.informatics.indiana.edu/lanet-vi/, accessed November 2006.
- [34] Chang, H., Jamin, S., and Willinger, W.: ‘To Peer or not to Peer: Modeling the Evolution of the Internet’s AS-level Topology’. Proc. of INFOCOM , 2006.
Figure captions
-
1.
Interactive growth of the PFP model.
-
2.
Degree distribution.
-
3.
Nearest-neighbors average degree of -degree nodes.
-
4.
Rich-club connectivity vs degree.
-
5.
Rich-club connectivity vs normalized rank.
-
6.
Complementary cumulative distribution (CCD) of triangle coefficient.
-
7.
Average triangle coefficient of -degree nodes.
-
8.
Complementary cumulative distribution (CCD) of shortest path length.
-
9.
Correlation between shortest path length and degree.
-
10.
Example of -core decomposition.
-
11.
Visualization of -core structure.
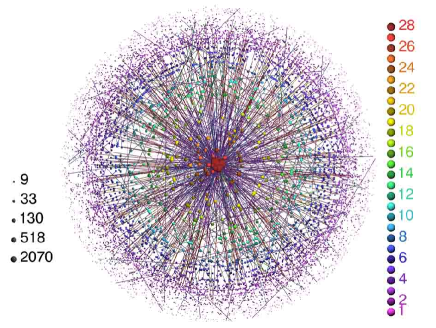
(a). Internet AS graph (ITDK0304)
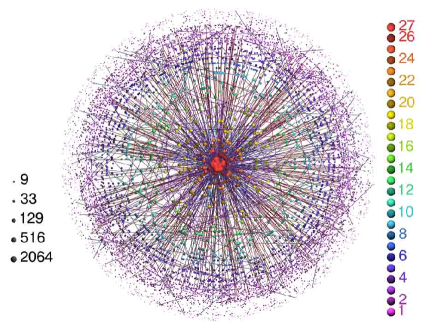
(b). PFP model (N=9024)
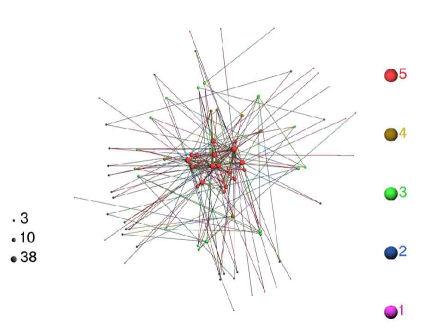
(c). Chinese Internet AS graph (CN05)
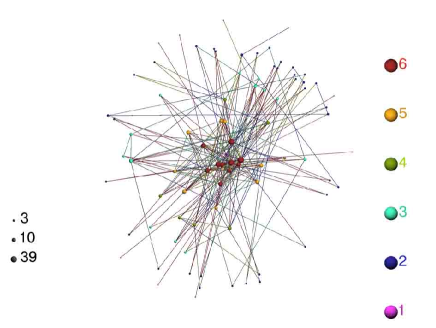
(d). PFP model (N=84)