Georgia Institute of Technology
Atlanta, Georgia 30332–0250
11email: fontas@ece.gatech.edu
11email: riley@ece.gatech.edu 22institutetext: Cooperative Association for Internet Data Analysis (CAIDA)
La Jolla, California 92093–0505
22email: dima@caida.org
Revisiting Internet AS-level Topology Discovery
Abstract
The development of veracious models of the Internet topology has received a lot of attention in the last few years. Many proposed models are based on topologies derived from RouteViews [1] BGP table dumps (BTDs). However, BTDs do not capture all AS–links of the Internet topology and most importantly the number of the hidden AS–links is unknown, resulting in AS–graphs of questionable quality. As a first step to address this problem, we introduce a new AS–topology discovery methodology that results in more complete and accurate graphs. Moreover, we use data available from existing measurement facilities, circumventing the burden of additional measurement infrastructure. We deploy our methodology and construct an AS–topology that has at least 61.5% more AS–links than BTD–derived AS–topologies we examined. Finally, we analyze the temporal and topological properties of the augmented graph and pinpoint the differences from BTD–derived AS–topologies.
1 Introduction
Knowledge of the Internet topology is not merely of technological interest, but also of economical, governmental, and even social concern. As a result, discovery techniques have attracted substantial attention in the last few years. Discovery of the Internet topology involves passive or active measurements to convey information regarding the network infrastructure. We can use topology abstraction to classify topology discovery techniques into the following three categories: AS–, IP– and LAN–level topology measurements. In the last category, SNMP–based as well as active probing techniques construct moderate size networks of bridges and end-hosts. At the IP–level (or router–level), which has received most of the research interest, discovery techniques rely on path probing to assemble WAN router–level maps [2, 3, 4]. Here, the two main challenges are the resolution of IP aliases and the sparse coverage of the Internet topology due to the small number of vantage points. While the latter can be ameliorated by increasing the number of measurement points using overlay networks and distributed agents [5, 6, 7], the former remains a daunting endeavor addressed only partially thus far [8, 9]. AS–level topology discovery has been the most straightforward, since BGP routing tables, which are publicly available in RouteViews (RV) [1], RIPE [10] and several other Route Servers [11], expose parts of the Internet AS–map. However, the discovery of the AS–level topology is not as simple as it appears.
The use of BTDs to derive the Internet AS–level topology is a common method. Characteristically, the seminal work by Faloutsos et al. [12] discovered a set of simple power–law relationships that govern AS–level topologies derived from BTDs. Several followup works on topology modeling, evolution modeling and synthetic topology generators have been based on these simple power–law properties [13, 14, 15]. However, it is well–known among the research community that the accuracy of BTD–derived topologies is arguable. First, a BGP table contains a list of AS–paths to destination prefixes, which do not necessarily unveil all the links between the ASs. For example, assume that the Internet topology is a hypothetical full mesh of size , then from a single vantage point, the shortest paths to every destination would only reveal of the total links. In addition, BGP policies limit the export and import of routes. In particular, prefixes learned over peering links111“Peering links” refers to the AS–relationship, in which two ASs mutually exchange their customers’ prefixes free of charge. do not propagate upwards in the customer-provider hierarchy. Consequently, higher tier ASs do not see peering links between ASs of lower tiers. This is one reason BTD–based AS–relationships inference heuristics [16] find only a few thousands of peering links, while the Internet Routing Registries reveal tens of thousands [17]. Lastly, as analyzed comprehensively in [18], RV servers only receive partial views from its neighboring routers, since the eBGP sessions filter out backup routes.
The accuracy of AS–level topologies has been considered previously. In [19] Chang et al. explore several diverse data sources, i.e. multiple BTDs, Looking Glass servers and Internet Routing Registry (IRR) databases, to create a more thorough AS–level topology. They report 40% more connections than a BTD-derived AS–map and find that the lack of connectivity information increases for smaller degree ASs. Mao et al. [20] develop a methodology to map router–graphs to AS–graphs. However they are more concerned with the methodology rather then the properties of the resulting AS–graph. Finally, in [21] Andersen et al. explore temporal properties of BGP updates to create a correlation graph of IP prefixes and identify clusters. The clusters imply some topological proximity, however their study is not concerned with the AS–level topology, but rather with the correlation graph.
Our methodology is based on exploiting BGP dynamics to discover additional topological information. In particular we accumulate the AS–path information from BGP updates seen from RV to create a comprehensive AS–level topology. The strength of our approach relies on a beneficial side–effect of the problematic nature of BGP convergence process. In the event of a routing change, the so-called “path exploration” problem, [22], results in superfluous BGP updates, which advertise distinct backup AS–paths of increasing length. Labovitz et al. [22] showed that there can be up to superfluous updates during BGP convergence. We analyze these updates and find that they uncover a substantial number of new AS–links not seen previously. To illustrate this process, consider the simple update sequence in Table 1, which was found in our dataset. The updates are received from a RV neighbor in AS10876 and pertain to the same prefix. The neighbor initially sends a withdrawal for the prefix 205.162.1/24, shortly after an update for the same prefix that exposes the unknown to that point AS–link 2828–14815, and finally an update for a shorter AS–path, in which it converges. The long AS–prepending in the first update shows that the advertised AS–path is a backup path not used at converged state. We explore the backup paths revealed during the path exploration phenomenon and discover 61.5% more AS–links not present in BTDs.
| Time | AS–path | Prefix |
|---|---|---|
| 2003-09-20 12:13:25 | (withdrawal) | 205.162.1/24 |
| 2003-09-20 12:13:55 | 10876-1239-2828-14815-14815-14815-14815-14815 | 205.162.1/24 |
| 2003-09-20 12:21:50 | 10876-1239-14815 | 205.162.1/24 |
2 Methodology
Our dataset is comprised of BGP updates collected between September 2003 and August 2004 from the RV router route-views2.oregon-ix.net. The RV router has multihop BGP sessions with 44 BGP routers and saves all received updates in the MRT format [1]. After converting the updates to ASCII format, we parse the set of AS–paths and mark the time each AS–link was first observed, ignoring AS–sets and private AS numbers. There are more than 875 million announcements and withdrawals, which yield an AS–graph, denoted as , of 61,134 AS–links and 19,836 nodes. Subscript 12 in the notation refers to the number of months in the accumulation period. To quantify the extent of additional information gathered from updates, we collect BTDs from the same RV router on the 1st and 15th of each month between September 2003 and August 2004. For each BTD we count the number of unique AS–links, ignoring AS–sets and private AS–numbers for consistency. Figure 1 illustrates the comparison. The solid line plots the cumulative number of unique AS–links over time, seen in BGP updates. Interestingly, after an initial super–linear increase, the number of additional links grows linearly, much faster than the corresponding increase observed from the BTDs. At the end of the observation window, BGP updates have accumulated an AS–graph that has 61.5% more links and 10.2% more nodes than the largest BTD–derived graph , which was collected on 08/15/2004. The notable disparity suggests that the real Internet AS topology may be different from what we currently observe from BTD–derived graphs, and merits further investigation. To gain more insight in the new information we analyze the temporal and topological properties of the AS–connectivity.

3 Temporal Analysis of Data
Identifying temporal properties of the AS–connectivity observed from BGP updates is necessary to understand the interplay between the observation of AS–links and BGP dynamics. In particular, we want to compare the temporal properties of AS–links present in BTDs with AS–links observed in BGP updates. To do so, we first introduce the concept of visibility of a link from RV. We say that at any given point in time a link is visible if RV has received at least one update announcing the link, and the link has not been withdrawn or replaced in a later update for the same prefix. A link stops been visible if all the prefix announcements carrying the link have been withdrawn or reannounced with new paths that do not use the link. We then define the following two metrics to measure the temporal properties of AS–links:
-
1.
Normalized Persistence (NP) of a link is the cumulative time for which a link was visible in RV, over the time period from the first time the link was seen to the end of the measurements.
-
2.
Normalized Lifetime (NL) of a link is the time period from the first time to the last time a link was seen, over the time period from the first time the link was seen to the end of the measurements.


The NP statistic represents the cumulative time for which a link was visible in RV, while the NL represents the span from the beginning to the end of the lifetime of the link. Both are normalized over the time period from the first time a link was seen to the end of the measurements to eliminate bias against links that were not seen from the beginning of the observation.
To calculate the NP and NL statistics, we replicate the dynamics of the RV routing table using the BGP updates dataset. We implement a simple BGP routing daemon that parses BGP updates and reconstructs the BGP routing table keeping per–peer and per–prefix state as needed. Then for each link we create an array of time intervals for which the link was visible and calculate the NP and NL statistics. Unfortunately, the BGP updates cannot explicitly pinpoint the event of a session reset between RV and its immediate neighbors. Detection of session resets is necessary to flush invalid routing table entries learned from the neighbor and to adjust the NP and NL statistics. We implement a detection algorithm, described in the Appendix, to address the problem.
We measure the NP and NL statistics over a 5–month period, from September 2003 to January 2004, and plot their distributions in Figure 2. Figure 2(a) demonstrates that NP identifies two strong modes in the visibility of AS–links. At the lower end of the axis, more than 5,000 thousand links have , portraying that there is a significant number of links that only appear during BGP convergence turbulence. At the upper end of the axis, almost 35,000 links have an NP close to 1. The distribution 2(b) of the NL statistic is even more modal, conveying that most of the links have a high lifetime span. At the end of the 5–month period, BGP updates have accumulated a graph that we decompose into two parts. One subgraph, , is the topology seen in a BTD collected from RV at the end of the 5–month period and the second subgraph is the remaining . Table 2 shows the number of links with , and in and in . Indeed, only 0.2% of the links in have , demonstrating that BTDs capture only the AS–connectivity seen at steady–state. In contrast, most links in have , exhibiting that most additional links found with our methodology appear during BGP turbulence.
| 65 (0.2%) | 6891 (57.5%) | |
| 1096 (3.2%) | 1975 (16.5%) | |
| 33141 (96.6%) | 3119 (26.0%) |
4 Topological Analysis of Data
Ultimately, we want to know how the new graph is different from the BTD graphs, e.g. where the new links are located, and how the properties of the graph change. A handful of graph theoretic metrics have been used to evaluate the topological properties of the Internet. We choose to evaluate three representative metrics of important properties of the Internet topology:
-
1.
Degree Distribution of AS–nodes. The Internet graph has been shown to belong in the class of power–law networks [12]. This property conveys the organization principle that few nodes are highly connected.
-
2.
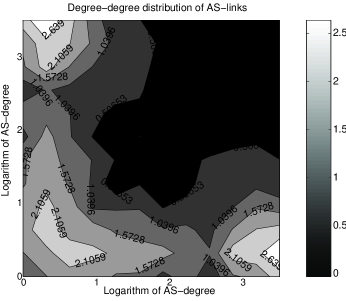
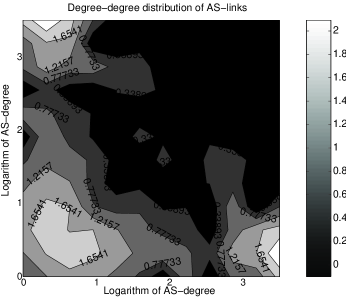
Degree–degree distribution of AS–links. The degree–degree distribution of the AS–links is another structural metric that describes the placement of the links in the graph with respect to the degree of the nodes. More specifically, it is the joint distribution of the degrees of the adjacent ASs of the AS–links.
-
3.
Betweenness distribution of AS–links. The betweenness of the AS–links describes the communication importance of the AS–links in the graph. More specifically, it is proportional to the number of shortest paths going through a link.
One of the controversial properties of the Internet topology is that the degree distribution of the AS–graph follows a simple power–law expression. This observation was first made in [12] using a BTD–derived AS–graph, later disputed in [23] using a more complete topology, and finally reasserted in [24] using an augmented topology as well. Since our work discovers substantial additional connectivity over the previous approaches, we re–examine the power–law form of the AS–degree distribution. For a power–low distribution the complementary cumulative distribution function (CCDF) of the AS–degree is linear. Thus, after plotting the CCDF, we can use linear regression to fit a line, and calculate the correlation coefficient to evaluate the quality of the fit. Figure 3 plots the CCDF of the AS–degree for the updates-derived graph, , and for the corresponding BTD-derived graph, . Due to the additional connectivity in , the updates–derived curve is slightly shifted to the right of the curve, without substantial change in the shape. Figures 4 and 5 show the CCDF of the AS–degree and the corresponding fitted line for and , accordingly. The correlation coefficient for is 0.9836, and in the more complete AS–graph it slightly decreases to 0.9722, which demonstrates that the AS–degree distribution in our updates–derived graph follows a power–law expression fairly accurately.


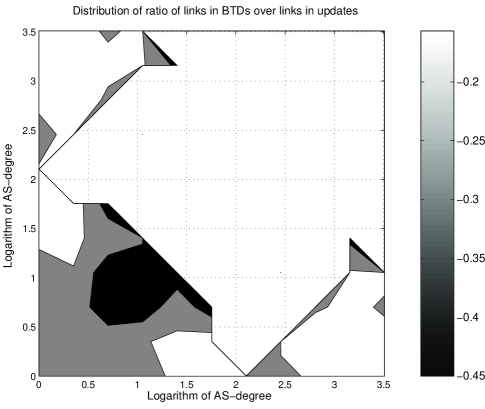
We then examine the degree–degree distribution of the links. The degree–degree distribution is the number of links connecting ASs of degrees and . Figure 6, compares the degree–degree distributions of the links in the full graph and of the links present only in updates, . The overall structure of the two contourplots is similar, except for the differences in the areas of links connecting low-degree nodes to low-degree nodes and links connecting medium-degree nodes to medium-degree nodes (the bottom-left corner and the center of the contourplots). The absolute number of such links in is smaller than in , since is a subgraph of . However, the contours illustrate that the ratio of such links in to the total number of links in is higher than the corresponding ratio of links in . Figure 7 depicts the contourplot of the ratio of the number of links in over the number of links in connecting ASs of corresponding degrees. The dark region between 0.5 and 1.5 exponents on the and axes, signifies the fact that BGP updates contain additional links, compared to BTDs, between low and medium-degree ASs close to the periphery of the graph.
Finally, we examine the link betweenness of the AS–links. In graph , the betweenness of link is defined as
where is the number of shortest paths between nodes and going through link and is the total number of shortest paths between and . With this definition, link betweenness is proportional to the traffic load on a given link under the assumptions of uniform traffic distribution and shortest–path routing. Figure 8 illustrates the betweenness distribution of and of and reveals that our updates–constructed graph yields more links with small betweenness. Links with small betweenness have lower communication importance in a graph theoretic context, demonstrating that our methodology unveils backup links and links used for local communication in the periphery of the graph.

Overall, our topological analysis shows that our augmented graph remains a power-law network and has more links between low and medium–degree nodes and more links of lower communication importance compared to BTD–derived graphs.
5 Conclusions
In this work we exploit the previously unharnessed topological information that can be extracted from the most well–known and easily accessible source of Internet interdomain routing data. We evidence that the Internet topology is vastly larger than the common BTD–derived topologies and we show how an undesired aspect of the interdomain architecture can be used constructively. We find that our substantially larger AS–graph retains the power–law property of the degree distribution. Finally, we show that our method discovers links of small communication importance connecting low and medium–degree ASs, suggesting AS–links used for backup purposes and local communication in the periphery of the Internet.
Closing, we highlight that our work is a step forward showing a large gap in our knowledge of the Internet topology. For this reason, we pronounce the need to focus more on the perpetual problem of measuring Internet topology before accepting far–reaching conclusions based on currently available AS–level topology data, which are undeniable rich but substantially incomplete.
Acknowledgments
We thank Priya Mahadevan for sharing her betweenness scripts, Andre Broido, Bradley Huffaker and Young Hyun for valuable suggestions, and Spyros Denazis for providing computer resources.
Support for this work was provided by the DARPA N66002-00-1-8934, NSF award number CNS-0427700 and CNS-0434996.
References
- [1] Meyer, D.: University of Oregon Route Views Project (2004)
- [2] Govindan, R., Tangmunarunkit, H.: Heuristics for Internet map discovery. In: IEEE INFOCOM 2000, Tel Aviv, Israel, IEEE (2000) 1371–1380
- [3] k claffy, Monk, T.E., McRobb, D.: Internet tomography. Nature (1999) http://www.caida.org/tools/measurement/skitter/.
- [4] Spring, N., Mahajan, R., Wetherall, D.: Measuring ISP topologies with Rocketfuel. In: ACM SIGCOMM. (2002)
- [5] Spring, N., Wetherall, D., Anderson, T.: Scriptroute: A facility for distributed Internet measurement. In: USENIX Symposium on Internet Technologies and Systems (USITS). (2003)
- [6] Shavitt, Y.: Distributed Internet MEasurements and Simulations (DIMES). http://www.netdimes.org (2004)
- [7] Friedman, T.: Work in progress on traceroute@home. In: ISMA - Internet Statistics and Metrics Analysis Workshops. (2004)
- [8] Spring, N., Dontcheva, M., Rodrig, M., Wetherall, D.: How to Resolve IP Aliases (2004) UW CSE Technical Report 04-05-04.
- [9] Keys, K.: iffinder. http://www.caida.org/tools/measurement/iffinder/ (2002)
- [10] : RIPE. http://www.ripe.net (2004)
- [11] : A traceroute server list. http://www.traceroute.org (2004)
- [12] Faloutsos, M., Faloutsos, P., Faloutsos, C.: On power-law relationships of the Internet topology. In: Proceedings of the ACM SIGCOMM. (1999)
- [13] Aiello, W., Chung, F., Lu, L.: A random graph model for massive graphs. In: Proceedings of the 32nd Annual ACM Symposium on Theory of Computing (STOC), ACM Press (2000) 171–180
- [14] Chen, Q., Chang, H., Govindan, R., Jamin, S., Shenker, S.J., Willinger, W.: The origin of power laws in Internet topologies revisited. In: IEEE INFOCOM. (2002)
- [15] Tangmunarunkit, H., Govindan, R., Jamin, S., Shenker, S., Willinger, W.: Network topology generators: Degree-based vs structural (2002)
- [16] Gao, L.: On inferring autonomous system relationships in the Internet. In: Proc. IEEE Global Internet Symposium. (2000)
- [17] Siganos, G., Faloutsos, M.: Analyzing BGP policies: Methodology and tool. In: IEEE INFOCOM. (2004)
- [18] Teixeira, R., Rexford, J.: A measurement framework for pin-pointing routing changes. In: ACM SIGCOMM Network Troubleshooting Workshop. (2004)
- [19] Chang, H., Govindan, R., Jamin, S., Shenker, S.J., Willinger, W.: Towards capturing representative AS-level Internet topologies. Computer Networks Journal 44 (2004) 737–755
- [20] Mao, Z.M., Rexford, J., Wang, J., Katz, R.H.: Towards an accurate AS-level traceroute tool. In: ACM SIGCOMM. (2003)
- [21] Andersen, D., Feamster, N., Bauer, S., Balakrishnan, H.: Topology Inference from BGP Routing Dynamics. In: Internet Measurement Workshop. (2002)
- [22] Labovitz, C., Malan, G.R., Jahanian, F.: Internet routing instability. IEEE/ACM Transactions on Networking 6 (1998) 515–528
- [23] Chen, Q., Chang, H., Govindan, R., Jamin, S., Shenker, S., Willinger, W.: The origin of power laws in Internet topologies revisited. In: IEEE INFOCOM. (2002)
- [24] Siganos, G., Faloutsos, M., Faloutsos, P., Faloutsos, C.: Power-laws and the AS-level Internet topology. IEEE Transactions on Networking (2003)
- [25] Maennel, O., Feldmann, A.: Realistic BGP Traffic for Test Labs. In: ACM SIGCOMM. (2002)
APPENDIX
Detection of session resets
The problem of detection of BGP session resets has also been addressed by others. In [25] Maennel et al. propose a heuristic to detect session resets on AS–links in arbitrary Internet locations by monitoring BGP updates in RV. We are concerned with a seemingly less demanding task: detection of session resets with immediate neighbors of RV. Our algorithm is composed of two components. The first detects surges in the BGP updates received from the same peer over a short time window of seconds. If the number of unique prefixes updated in are more than a significant percent of the previously known unique prefixes from the same peer, then a session reset is inferred. The second component detects periods of significant inactivity when a threshold is passed from otherwise active peers. We combine both approaches and set low thresholds (, , ) to yield an aggressive session reset detection algorithm. Then, we calculate NP and NL over a period of a month with and without aggressive session reset detection enabled. We find that the calculated statistics are virtually the same with less then 0.1% variation. Implying that the short time scale of the lifetime of session resets does not affect the span of the NP and NL statistics. Hence, we leave out the detection of session resets in the remaining NP and NL measurements.