Shuffling a Stacked Deck: The Case for Partially Randomized Ranking of Search Engine Results
Abstract
In-degree, PageRank, number of visits and other measures of Web page
popularity significantly influence the ranking of search results by
modern search engines.
The assumption is that popularity is closely correlated
with quality, a more elusive concept that is difficult to measure directly.
Unfortunately, the correlation between popularity and quality is very weak
for newly-created pages that have yet to receive many visits and/or
in-links. Worse, since discovery of new content is largely done by
querying search engines, and because users usually focus their attention on the
top few results, newly-created but high-quality pages are effectively
“shut out,” and it can take a very long time before they become
popular.
We propose a simple and elegant solution to this problem: the
introduction of a controlled amount of randomness into search result
ranking methods. Doing so offers new pages a
chance to prove their worth, although clearly using too much
randomness will degrade result quality and annul any benefits
achieved. Hence there is a tradeoff between exploration to estimate the
quality of new pages and exploitation of pages already known to be of
high quality. We study this tradeoff both analytically and via simulation,
in the context of an economic objective function based on aggregate result
quality amortized over time.
We show that a modest amount of randomness leads to improved search results.
1 Introduction
Search engines are becoming the predominant means of discovering and accessing content on the Web. Users access Web content via a combination of following hyperlinks (browsing) and typing keyword queries into search engines (searching). Yet as the Web overwhelms us with its size, users naturally turn to increased searching and reduced depth of browsing, in relative terms. In absolute terms, an estimated million search queries are received by major search engines each day [18].
Ideally, search engines should present query result pages in order of some intrinsic measure of quality. Quality cannot be measured directly. However, various notions of popularity, such as number of in-links, PageRank [17], number of visits, etc., can be measured. Most Web search engines assume that popularity is closely correlated with quality, and rank results according to popularity.
1.1 The Entrenchment Problem
Unfortunately, the correlation between popularity and quality is very weak for newly-created pages that have few visits and/or in-links. Worse, the process by which new, high-quality pages accumulate popularity is actually inhibited by search engines. Since search engines dole out a limited number of clicks per unit time among a large number of pages, always listing highly popular pages at the top, and because users usually focus their attention on the top few results [11, 14], newly-created but high-quality pages are “shut out.” This increasing “entrenchment effect” has witnessed broad commentary across political scientists, the popular press, and Web researchers [19, 21, 15, 7, 8, 9] and even led to the term Googlearchy. In a recent study, Cho and Roy [5] show that heavy reliance on a search engine that ranks results according to popularity can delay widespread awareness of a high-quality page by a factor of over , compared with a simulated world without a search engine in which pages are accessed through browsing alone.
Even if we ignore the (contentious) issue of fairness, there are well-motivated economic objectives that are penalized by the entrenchment effect. Assuming a notion of intrinsic page quality as perceived by users, a hypothetical ideal search engine would bias users toward visiting those pages of the highest quality at a given time, regardless of popularity. Relying on popularity as a surrogate for quality sets up a vicious cycle of neglect for new pages, even as entrenched pages collect an increasing fraction of user clicks. Given that some of these new pages will generally have higher quality than some entrenched pages, pure popularity-based ranking clearly fails to maximize an objective based on average quality of search results seen by users.
1.2 Entrenchment Problem in Other Contexts
The entrenchment problem may not be unique to the Web search engine context. For example, consider recommendation systems [13], which are widely used in e-commerce [20]. Many users decide which items to view based on recommendations, but these systems make recommendations based on user evaluations of items they view. This circularity leads to the well-known cold-start problem, and is also likely to lead to entrenchment.
Indeed, Web search engines can be thought of as recommendation systems that recommend Web pages. The entrenchment problem is particularly acute in the case of Web search, because the sheer size of the Web forces large numbers of users to locate new content using search engines alone. Therefore, in this paper, we specifically focus on diminishing the entrenchment bias in the Web search context.
1.3 Our Key Idea: Rank Promotion
We propose a very simple modification to the method of ranking search results according to popularity: promote a small fraction of unexplored pages up in the result list. A new page now has some chance of attracting clicks and attention even if the initial popularity of the page is very small. If a page has high quality, the rank boost gives the page a chance to prove itself. (Detailed definitions and algorithms are given later in the paper.)
As an initial test for effectiveness, we conducted a real-world study, which we now describe briefly (a complete description is provided in Appendix A). We created our own small Web community consisting of several thousand Web pages, each containing a joke/quotation gathered from online databases. We decided to use “funniness” as a surrogate for quality, since users are generally willing to provide their opinion about how funny something is. Users had the option to rate the funniness of the jokes/quotations they visit. The main page of the Web site we set up consisted of an ordered list of links to individual joke/quotation pages, in groups of ten at a time, as is typical in search engine responses. Text at the top stated that the jokes and quotations were presented in descending order of funniness, as rated by users of the site.
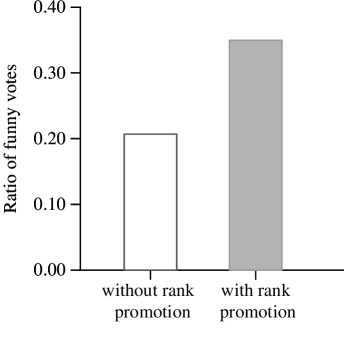
A total of volunteers participated in our study over a period of days. Users were split at random into two user groups: one group for which a simple form of rank promotion was used, and one for which rank promotion was not used. The method of rank promotion we used in this experiment is to place new pages immediately below rank position 20. For each user group we measured the ratio of funny votes to total votes during this period. Figure 1 shows the result. The ratio achieved using rank promotion was approximately larger than that obtained using strict ranking by popularity.
1.4 Design of Effective Rank Promotion Schemes
In the search engine context it is probably not appropriate to insert promoted pages at a consistent rank position (lest users learn over time to avoid them). Hence, we propose a simple randomized rank promotion scheme in which promoted pages are assigned randomly-chosen rank positions.
Still, the question remains as to how aggressively one should promote new pages. Many new pages on the Web are not of high quality. Therefore, the extent of rank promotion has to be limited very carefully, lest we negate the benefits of popularity-based ranking by displacing pages known to be of high quality too often. With rank promotion there is an inherent tradeoff between exploration of new pages and exploitation of pages already known to be of high quality. We study how to balance these two aspects, in the context of an overarching objective of maximizing the average quality of search results viewed by users, amortized over time. In particular we seek to answer the following questions:
-
•
Which pages should be treated as candidates for exploration, i.e., included in the rank promotion process so as to receive transient rank boosts?
-
•
Which pages, if any, should be exploited unconditionally, i.e., protected from any rank demotion caused by promotion of other pages?
-
•
What should be the overall ratio of exploration to exploitation?
Before we can begin to address these questions, we must model the relationship between user queries and search engine results. We categorize the pages on the Web into disjoint groups by topic, such that each page pertains to exactly one topic. Let be the set of pages devoted to a particular topic (e.g., “swimming” or “Linux”), and let denote the set of users interested in topic . We say that the users and pages corresponding to topic , taken together make up a Web community. (Users may participate in multiple communities.) For now we assume all users access the Web uniquely through a (single) search engine. (We relax this assumption later in Section 8.) We further assume a one-to-one correspondence between queries and topics, so that each query returns exactly the set of pages for the corresponding community. Although far from perfect, we believe this model preserves the essence of the dynamic process we seek to understand.
Communities are likely to differ a great deal in terms of factors like the number of users, the number of pages, the rate at which users visit pages, page lifetimes, etc. These factors play a significant role in determining how a given rank promotion scheme influences page popularity evolution. For example, communities with very active users are likely to be less susceptible to the entrenchment effect than those whose users do not visit very many pages. Consequently, a given rank promotion scheme is bound to create quite different outcomes in the two types of communities. In this paper we provide an analytical method for predicting the effect of deploying a particular randomized rank promotion scheme in a given community, as a function of the most important high-level community characteristics.
1.5 Experimental Study
We seek to model a very complex dynamical system involving search engines, evolving pages, and user actions, and trace its trajectory in time. It is worth emphasizing that even if we owned the most popular search engine in the world, “clean-room” experiments would be impossible. We could not even study the effect of different choices of a parameter, because an earlier choice would leave large-scale and indelible artifacts on the Web graph, visit rates, and popularity of certain pages. Therefore, analysis and simulations are inescapable, and practical experiments (as in Section 1.3) must be conducted in a sandbox.
Through a combination of analysis and simulation, we arrive at a particular recipe for randomized rank promotion that balances exploration and exploitation effectively, and yields good results across a broad range of community types. Robustness is desirable because, in practice, communities are not disjoint and therefore their characteristics cannot be measured reliably.
1.6 Outline
In Section 3 we present our model of Web page popularity, describe the exploration/exploitation tradeoff as it exists in our context, and introduce two metrics for evaluating rank promotion schemes. We then propose a randomized method of rank promotion in Section 4, and supply an analytical model of page popularity evolution under randomized rank promotion in Section 5. In Sections 6–8 we present extensive analytical and simulation results, and recommend and evaluate a robust recipe for randomized rank promotion.
2 Related Work
The entrenchment effect has been attracting attention for several years [19, 21, 15, 7, 8, 9], but formal models for and analysis of the impact of search engines on the evolution of the Web graph [4] or on the time taken by new pages to become popular [5] are recent.
A few solutions to the entrenchment problem have been proposed [6, 3, 22]. They rely on variations of PageRank: the solutions of [3, 22] assign an additional weighting factor based on page age; that of [6] uses the derivative of PageRank to forecast future PageRank values for young pages.
Our approach, randomized rank promotion, is quite different in spirit. The main strength of our approach is its simplicity—it does not rely on measurements of the age or PageRank evolution of individual Web pages, which are difficult to obtain and error-prone at low sample rates. (Ultimately, it may make sense to use our approach in conjunction with other techniques, in a complementary fashion.)
The exploration/exploitation tradeoff that arises in our context is akin to problems studied in the field of reinforcement learning [12]. However, direct application of reinforcement learning algorithms appears prohibitively expensive at Web scales.
3 Model and Metrics
In this section we introduce the model of Web page popularity, adopted from [5], that we use in the rest of this paper. (For convenience, a summary of the notation we use is provided in Table 1.) Recall from Section 1.4 that in our model the Web is categorized into disjoint groups by topic, such that each page pertains to exactly one topic. Let be the set of pages devoted to a particular topic , and let denote the set of users interested in topic . Let and denote the number of pages and users, respectively, in the community.
3.1 Page Popularity
In our model, time is divided into discrete intervals, and at the end of each interval the search engine measures the popularity of each Web page according to in-link count, PageRank, user traffic, or some other indicator of popularity among users. Usually it is only possible to measure popularity among a minority of users. Indeed, for in-link count or PageRank, only those users who have the ability to create links are counted. For metrics based on user traffic, typically only users who agree to install a special toolbar that monitors Web usage, as in [1], are counted. Let denote the set of monitored users, over which page popularity is measured, and let . We assume constitutes a representative sample of the overall user population .
| Symbol | Meaning |
|---|---|
| Set of Web pages in community | |
| Set of users in community | |
| Set of monitored users in community | |
| Popularity among monitored users of page at time | |
| Number of user visits to page | |
| during unit time interval at | |
| Number of visits to by monitored users at | |
| Total number of user visits per unit time | |
| Number of visits by monitored users per unit time | |
| Awareness among monitored users of page at time | |
| Intrinsic quality of page | |
| Expected page lifetime |
Let the total number of user visits to pages per unit time be fixed at . Further, let denote the number of visits per unit time by monitored users, with . The way these visits are distributed among pages in is determined largely by the search engine ranking method in use; we will come back to this aspect later. For now we simply provide a definition of the visit rate of a page .
Definition 3.1
(Visit Rate) The visit rate of page at time , , is defined as the number of times is visited by any monitored user within a unit time interval at time .
Similarly, let denote the number of visits by any user in (monitored and unmonitored users alike) within a unit time interval at time . We require that and . Once a user visits a page for the first time, she becomes “aware” of that page.
Definition 3.2
(Awareness) The awareness level of page at time , , is defined as the fraction of monitored users who have visited at least once by time .
We define the popularity of page at time , , as follows:
| (1) |
where (page quality) denotes the extent to which an average user would “like” page if she was aware of .
In our model page popularity is a monotonically nondecreasing function of time. Therefore if we assume nonzero page viewing probabilities, for a page of infinite lifetime .
3.2 Rank Promotion
If pages are ranked strictly according to current popularity, it can take a long time for the popularity of a new page to approach its quality. Artificially promoting the rank of new pages can potentially accelerate this process. One important objective for rank promotion is to minimize the time it takes for a new high-quality page to attain its eventual popularity, denoted TBP for “time to become popular.” In this paper we measure TBP as the time it takes for a high-quality page to attain popularity that exceeds of its quality level.
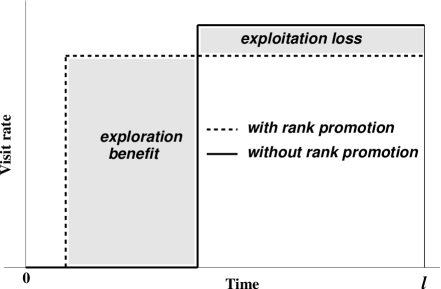
Figure 2 shows popularity evolution curves for a particular page having very high quality created at time with lifetime , both with and without rank promotion. (It has been shown [5] that popularity evolution curves are close to step-functions.) Time is plotted on the x-axis. The y-axis plots the number of user visits per time unit. Note that while the page becomes popular earlier when rank promotion is applied, the number of visits it receives once popular is somewhat lower than in the case without rank promotion. That is because systematic application of rank promotion inevitably comes at the cost of fewer visits to already-popular pages.
3.3 Exploration/Exploitation Tradeoff and Quality-Per-Click Metric
The two shaded regions of Figure 2 indicate the positive and negative aspects of rank promotion. The exploration benefit area corresponds to the increase in the number of additional visits to this particular high-quality page during its lifetime made possible by promoting it early on. The exploitation loss area corresponds to the decrease in visits due to promotion of other pages, which may mostly be of low quality compared to this one. Clearly there is a need to balance these two factors. The TBP metric is one-sided in this respect, so we introduce a second metric that takes into account both exploitation and exploitation: quality-per-click, or QPC for short. QPC measures the average quality of pages viewed by users, amortized over a long period of time. We believe that maximizing QPC is a suitable objective for designing a rank promotion strategy.
We now derive a mathematical expression for QPC in our model. First, recall that the number of visits by any user to page during time interval is denoted . We can express the cumulative quality of all pages in viewed at time as . Taking the average across time in the limit as the time duration tends to infinity, we obtain:
By normalizing, we arrive at our expression for QPC:
4 Randomized Rank Promotion
We now describe our simple randomized rank promotion scheme (this description is purely conceptual; more efficient implementation techniques exist).
Let denote the set of responses to a user query. A subset of those pages, is set aside as the promotion pool, which contains the set of pages selected for rank promotion according to a predetermined rule. (The particular rule for selecting , as well as two additional parameters, and , are configuration options that we discuss shortly.) Pages in are sorted randomly and the result is stored in the ordered list . The remaining pages () are ranked in the usual deterministic way, in descending order of popularity; the result is an ordered list . The two lists are merged to create the final result list according to the following procedure:
-
1.
The top elements of are removed from and inserted into the beginning of while preserving their order.
-
2.
The element to insert into at each remaining position is determined one at a time, in that order, by flipping a biased coin: with probability the next element is taken from the top of list ; otherwise it is taken from the top of . If one of or becomes empty, all remaining entries are taken from the nonempty list. At the end both of and will be empty, and will contain one entry for each of the pages in .
The configuration parameters are:
-
•
Promotion pool (): In this paper we consider two rules for determining which pages are promoted: (a) the uniform promotion rule, in which every page is included in with equal probability , and (b) the selective promotion rule, in which all pages whose current awareness level among monitored users is zero (i.e., ) are included in , and no others. (Other rules are of course possible; we chose to focus on these two in particular because they roughly correspond to the extrema of the spectrum of interesting rules.)
-
•
Starting point (): All pages whose natural rank is better than are protected from the effects of promoting other pages. A particularly interesting value is , which safeguards the top result of any search query, thereby preserving the “feeling lucky” property that is of significant value in some situations.
-
•
Degree of randomization (): When is small, this parameter governs the tradeoff between emphasizing exploration (large ) and emphasizing exploitation (small ).
Our goal is to determine settings of the above parameters that lead to good TBP and QPC values. The remainder of this paper is dedicated to this task. Next we present our analytical model of Web page popularity evolution, which we use to estimate TBP and QPC under various ranking methods.
5 Analytical Model
Our analytical model has these features:
-
•
Pages have finite lifetime following an exponential distribution (Section 5.1). The number of pages and the number of users are fixed in steady state. The quality distribution of pages is stationary.
- •
Given that (a) modern search engines appear to be strongly influenced by popularity-based measures while ranking results, and (b) users tend to focus their attention primarily on the top-ranked results [11, 14], it is reasonable to assume that the expected visit rate of a page is a function of its current popularity (as done in [5]):
| (2) |
where the form of function depends on the ranking method in use and the bias in user attention. For example, if ranking is completely random, then is independent of and the same for all pages, so . (Recall that is the total number of monitored user visits per unit time.) If ranking is done in such a way that user traffic to a page is proportional to the popularity of that page, , where is a normalization factor; at steady-state, . If ranking is performed the aforementioned way of the time, and performed randomly of the time, then . For the randomized rank promotion we introduced in Section 4 the situation is more complex. We defer discussion of how to obtain to Section 5.3.
5.1 Page Birth and Death
The set of pages on the Web is not fixed. Likewise, we assume that for a given community based around topic , the set of pages in the community evolves over time due to pages being created and retired. To keep our analysis manageable we assume that the rate of retirement matches the rate of creation, so that the total number of pages remains fixed at . We model retirement of pages as a Poisson process with rate parameter , so the expected lifetime of a page is (all pages have the same expected lifetime111In reality, lifetime might be a positively correlated with popularity. If so, popular pages would remain entrenched for a longer time than under our model, leading to even worse TBP than our model predicts.). When a page is retired, a new page of equal quality is created immediately, so the distribution of page quality values is stationary. When a new page is created it has initial awareness and popularity values of zero.
5.2 Awareness Distribution
We derive an expression for the distribution of page awareness values, which we then use to obtain an expression for quality-per-click (QPC). We analyze the steady-state scenario, in which the awareness and popularity distributions have stabilized and remain steady over time. Our model may not seem to indicate steady-state behavior, because the set of pages is constantly in flux and the awareness and popularity of an individual page changes over time. To understand the basis for assuming steady-state behavior, consider the set of pages created at time , and the set of pages created at time . Since page creation is governed by a Poisson process the expected sizes of the two sets are equal. Recall that we assume the distribution of page quality values remains the same at all times. Therefore, the popularity of all pages in both and will increase from the starting value of according to the same popularity evolution law. At time , when the pages in have evolved in popularity according to the law for the first time unit, the new pages in introduced at time will replace the old popularity values of the pages. A symmetric effect occurs with pages that are retired, resulting in steady-state behavior overall. In the steady-state, both popularity and awareness distributions are stationary.
The steady-state awareness distribution is given as follows.
Theorem 1
Among all pages in whose quality is , the fraction that have awareness (for ) is:
| (3) |
where is the function in Equation 2.
Proof: See Appendix B.
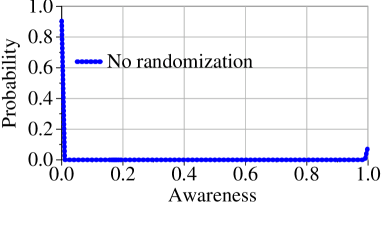
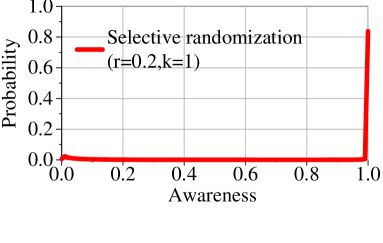
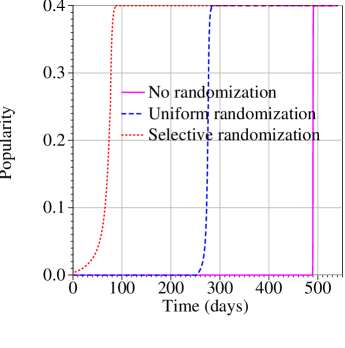
Figure 3 plots the steady-state awareness distribution for pages of highest quality, under both nonrandomized ranking and selective randomized rank promotion with and , for our default Web community characteristics (see Section 6.1). For this graph we used the procedure described in Section 5.3 to obtain the function .
Observe that if randomized rank promotion is used, in steady-state most high-quality pages have large awareness, whereas if standard nonrandomized ranking is used most pages have very small awareness. Hence, under randomized rank promotion most pages having high quality spend most of their lifetimes with near- awareness, yet with nonrandomized ranking they spend most of their lifetimes with near-zero awareness. Under either ranking scheme pages spend very little time in the middle of the awareness scale, since the rise to high awareness is nearly a step function.
Given an awareness distribution , it is straightforward to determine expected time-to-become-popular (TBP) corresponding to a given quality value (formula omitted for brevity). Expected quality-per-click (QPC) is expressed as follows:
where . (Recall our assumption that monitored users are a representative sample of all users.)
5.3 Popularity to Visit Rate Relationship
In this section we derive the function used in Equation 2, which governs the relationship between and the expectation of . As done in [5] we split the relationship between the popularity of a page and the expected number of visits into two components: (1) the relationship between popularity and rank position, and (2) the relationship between rank position and the number of visits. We denote these two relationships as the functions and respectively, and write:
where the output of is the rank position of a page of popularity , and is a function from that rank to a visit rate. Our rationale for splitting in this way is that, according to empirical findings reported in [11], the likelihood of a user visiting a page presented in a search result list depends primarily on the rank position at which the page appears.
We begin with , the dependence of the expected number of user visits on the rank of a page in a result list. Analysis of AltaVista usage logs [5, 14] reveal that the following relationship holds quite closely222User views were measured at the granularity of groups of ten results in [14], and later extrapolated to individual pages in [5].:
| (4) |
where is a normalization constant, which we set as:
where is the total number of monitored user visits per unit time.
Next we turn to , the dependence of rank on the popularity of a page. Note that since the awareness level of a particular page cannot be pinpointed precisely (it is expressed as a probability distribution), we express as the expected rank position of a page of popularity . In doing so we compromise accuracy to some extent, since we will determine the expected number of visits by applying to the expected rank, as opposed to summing over the full distribution of rank values. (We examine the accuracy of our analysis in Sections 6.2 and 6.3.)
Under nonrandomized ranking, the expected rank of a page of popularity is one plus the expected number of pages whose popularities surpass . By Equation 1, page has if it has . From Theorem 1 the probability that a randomly-chosen page satisfies this condition is:
By linearity of expectation, summing over all we arrive at:
| (5) |
(This is an approximate expression because we ignore the effect of ties in popularity values, and because we neglect to discount one page of popularity from the outer summation.)
The formula for under uniform randomized ranking is rather complex, so we omit it. We focus instead on selective randomized ranking, which is a more effective strategy, as we will demonstrate shortly. Under selective randomized ranking the expected rank of a page of popularity , when , is given by:
where is as in Equation 5, and denotes the expected number of pages with zero awareness, an estimate for which can be computed without difficulty under our steady-state assumption. (The case of must be handled separately; we omit the details due to lack of space.)
The above expressions for or each contain a circularity, because our formula for (Equation 3) contains . It appears that a closed-form solution for is difficult to obtain. In the absence of a closed-form expression one option is to determine via simulation. The method we use is to solve for using an iterative procedure, as follows.
We start with a simple function for , say , as an initial guess at the solution. We then substitute this function into the right-hand side of the appropriate equation above to produce a new function in numerical form. We then convert the numerical function into symbolic form by fitting a curve, and repeat until convergence occurs. (Upon each iteration we adjust the curve slightly so as to fit the extreme points corresponding to and especially carefully; details omitted for brevity.) Interestingly, we found that using a quadratic curve in log-log space led to good convergence for all parameter settings we tested, so that:
where , , and are determined using a curve fitting procedure. We later verified via simulation that across a variety of scenarios can be fit quite accurately to a quadratic curve in log-log space.
6 Effect of Randomized Rank Promotion and Recommended Parameter Settings
In this section we report our measurements of the impact of randomized rank promotion on search engine quality. We begin by describing the default Web community scenario we use in Section 6.1. Then we report the effect of randomized rank promotion on TBP and QPC in Sections 6.2 and 6.3, respectively. Lastly, in Section 6.4 we investigate how to balance exploration and exploitation, and give our recommended recipe for randomized rank promotion.
6.1 Default Scenario
For the results we report in this paper, the default333We supply results for other community types in Section 7. Web community we use is one having pages. The remaining characteristics of our default Web community are set so as to be in proportion to observed characteristics of the entire Web, as follows. First, we set the expected page lifetime to years (based on data from [16]). Our default Web community has users making a total of visits per day (based on data reported in [2], the number of Web users is roughly one-tenth the number of pages, and an average user queries a search engine about once per day). We assume that a search engine is able to monitor of its users, so and .
As for page quality values, we had little basis for measuring the intrinsic quality distribution of pages on the Web. As the best available approximation, we used the power-law distribution reported for PageRank in [5], with the quality value of the highest-quality page set to . (We chose based on the fraction of Internet users who frequent the most popular Web portal site, according to [18].)
6.2 Effect of Randomized Rank Promotion on TBP
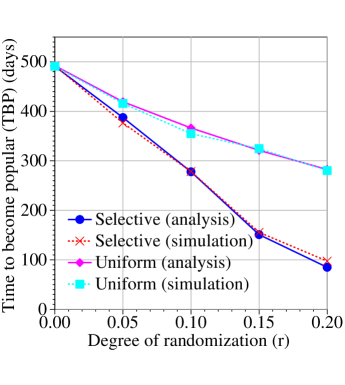
Figure 4(a) shows popularity evolution curves derived from the awareness distribution determined analytically for a page of quality under three different ranking methods: (1) nonrandomized ranking, (2) randomized ranking using uniform promotion with the starting point and the degree of randomization , and (3) randomized ranking using selective promotion with and . This graph shows that, not surprisingly, randomized rank promotion can improve TBP by a large margin. More interestingly it also indicates that selective rank promotion achieves substantially better TBP than uniform promotion. Because, for small , there is limited opportunity to promote pages, focusing on pages with zero awareness turns out to be the most effective method.
Figure 4(b) shows TBP measurements for a page of quality in our default Web community, for different values of (fixing ). As expected, increased randomization leads to lower TBP, especially if selective promotion is employed.
To validate our analytical model, we created a simulator that maintains an evolving ranked list of pages (the ranking method used is configurable), and distributes user visits to pages according to Equation 4. Our simulator keeps track of awareness and popularity values of individual pages as they evolve over time, and creates and retires pages as dictated by our model. After a sufficient period of time has passed to reach steady-state behavior, we take measurements.
These results are plotted in Figure 4(b), side-by-side with our analytical results. We observe a close correspondence between our analytical model and our simulation.444Our analysis is only intended to be accurate for small values of , which is why we only plot results for . From a practical standpoint only small values of are of interest.
6.3 Effect of Randomized Rank Promotion on QPC
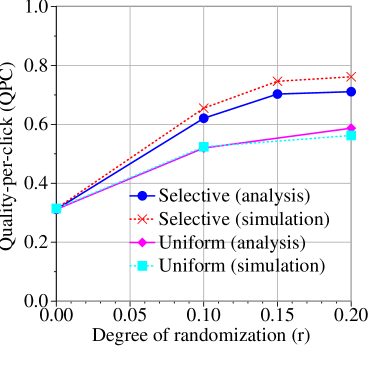
We now turn to quality-per-click (QPC). Throughout this paper (except in Section 8) we normalize all QPC measurements such that corresponds to the theoretical upper bound achieved by ranking pages in descending order of quality. The graph in Figure 5 plots normalized QPC as we vary the promotion rule and the degree of randomization (holding fixed at ), under our default Web community characteristics of Section 6.1. For a community with these characteristics, a moderate dose of randomized rank promotion increases QPC substantially, especially under selective promotion.
6.4 Balancing Exploration, Exploitation, and Reality
We have established a strong case that selective rank promotion is superior to uniform promotion. In this section we investigate how to set the other two randomized rank promotion parameters, and , so as to balance exploration and exploitation and achieve high QPC. For this purpose we prefer to rely on simulation, as opposed to analysis, for maximum accuracy.
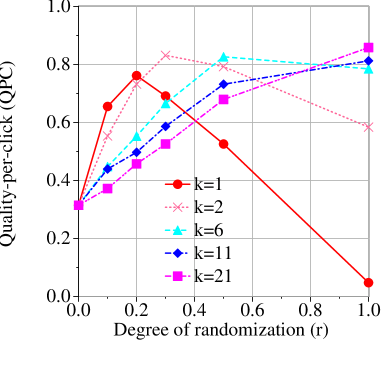
The graph in Figure 6 plots normalized QPC as we vary both and , under our default scenario (Section 6.1). As grows larger, a higher value is needed to achieve high QPC. Intuitively, as the starting point for rank promotion becomes lower in the ranked list (larger ), a denser concentration of promoted pages (larger ) is required to ensure that new high-quality pages are discovered by users.
For search engines, we take the view that it is undesirable to include a noticeable amount of randomization in ranking, regardless of the starting point . Based on Figure 6, using only randomization () appears sufficient to achieve most of the benefit of rank promotion, as long as is kept small (e.g., or ). Under randomization, roughly one page in every group of ten query results is a new, untested page, as opposed to an established page. We do not believe most users are likely to notice this effect, given the amount of noise normally present in search engine results.
A possible exception is for the topmost query result, which users often expect to be consistent if they issue the same query multiple times. Plus, for certain queries users expect to see a single, “correct,” answer in the top rank position (e.g., most users would expect the query “Carnegie Mellon” to return a link to the Carnegie Mellon University home page at position ), and quite a bit of effort goes into ensuring that search engines return that result at the topmost rank position. That is why we include the parameter setting, which ensures that the top-ranked search result is never perturbed.
Recommendation: Introduce randomization starting at rank position or , and exclusively target zero-awareness pages for random rank promotion.
7 Robustness Across Different Community Types
In this section we investigate the robustness of our recommended ranking method (selective promotion rule, , ) as we vary the characteristics of our testbed Web community. Our objectives are to demonstrate: (1) that if we consider a wide range of community types, amortized search result quality is never harmed by our randomized rank promotion scheme, and (2) that our method improves result quality substantially in most cases, compared with traditional deterministic ranking. In this section we rely on simulation rather than analysis to ensure maximum accuracy.
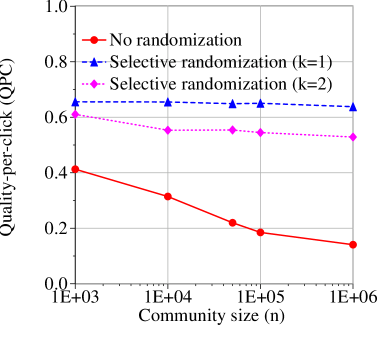
7.1 Influence of Community Size
Here we vary the number of pages in the community, , while holding the ratio of users to pages fixed at , fixing the fraction of monitored users as , and fixing the number of daily page visits per user at . Figure 7(a) shows the result, with community size plotted on the x-axis on a logarithmic scale. The y-axis plots normalized QPC for three different ranking methods: nonrandomized, selective randomized with and , and selective randomized with and . With nonrandomized ranking, QPC declines as community size increases, because it becomes more difficult for new high-quality pages to overcome the entrenchment effect. Under randomized rank promotion, on the other hand, due to rank promotion QPC remains high and fairly steady across a range of community sizes.
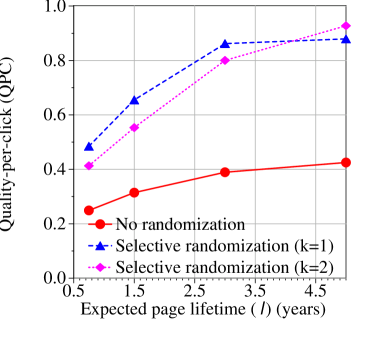
7.2 Influence of Page Lifetime
Figure 7(b) shows QPC as we vary the expected page lifetime while keeping all other community characteristics fixed. (Recall that in our model the number of pages in the community remains constant across time, and when a page is retired a new one of equal quality but zero awareness takes its place.) The QPC curve for nonrandomized ranking confirms our intuition: when there is less churn in the set of pages in the community (large ), QPC is penalized less by the entrenchment effect. More interestingly, the margin of improvement in QPC over nonrandomized ranking due to introducing randomness is greater when pages tend to live longer. The reason is that with a low page creation rate the promotion pool can be kept small. Consequently new pages benefit from larger and more frequent rank boosts, on the whole, helping the high-quality ones get discovered quickly.
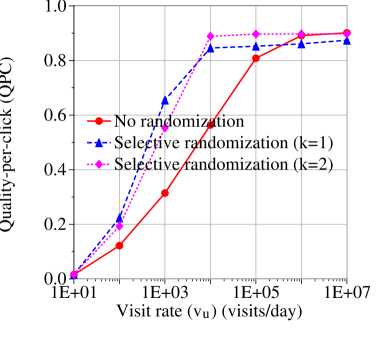
7.3 Influence of Visit Rate
The influence of the aggregate user visit rate on QPC is plotted in Figure 7(c). Visit rate is plotted on the x-axis on a logarithmic scale, and QPC is plotted on the y-axis. Here, we hold the number of pages fixed at our default value of and use our default expected lifetime value of years. We vary the total number of user visits per day while holding the ratio of daily page visits to users fixed at and, as always, fixing the fraction of monitored users as . From Figure 7(c) we see first of all that, not surprisingly, popularity-based ranking fundamentally fails if very few pages are visited by users. Second, if the number of visits is very large ( visits per day to an average page), then there is no need for randomization in ranking (although it does not hurt much). For visit rates within an order of magnitude on either side of , which matches the average visit rate of search engines in general when is scaled to the size of the entire Web, 555According to our rough estimate based on data from [2]. there is significant benefit to using randomized rank promotion.
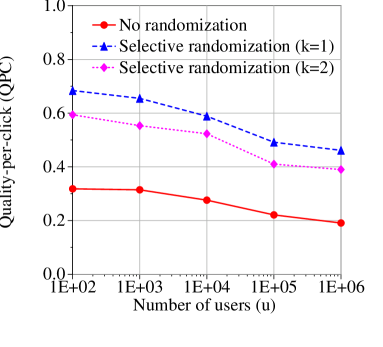
7.4 Influence of Size of User Population
Lastly we study the affect of varying the number of users in the community , while holding all other parameters fixed: , years, visits per day, and . Note that we keep the total number of visits per day fixed, but vary the number of users making those visits. The idea is to compare communities in which most page visits come from a core group of fairly active users to ones receiving a large number of occasional visitors. Figure 7(d) shows the result, with the number of users plotted on the x-axis on a logarithmic scale, and QPC plotted on the y-axis. All three ranking methods perform somewhat worse when the pool of users is large, although the performance ratios remain about the same. The reason for this trend is that with a larger user pool, a stray visit to a new high-quality page provides less traction in terms of overall awareness.
8 Mixed Surfing and Searching
The model we have explored thus far assumes that users make visit to pages only by querying a search engine. While a very large number of surf trails start from search engines and are very short, nonnegligible surfing may still be occurring without support from search engines. We use the following model for mixed surfing and searching:
- •
-
•
While browsing the Web, users perform random surfing with probability . With probability users query a search engine and browse among results presented in the form of a ranked list.
We still assume that there is only one search engine that every user uses for querying. However, this assumption does not significantly restrict the applicability of our model. For our purposes the effect of multiple search engines that present the same ranked list for a query is equivalent to a single search engine that presents the same ranked list and gets a user traffic equal to the sum of the user traffic of the multiple search engines.
Assuming that page popularity is measured using PageRank, under our mixed browsing model the expected visit rate of a page at time is given by:
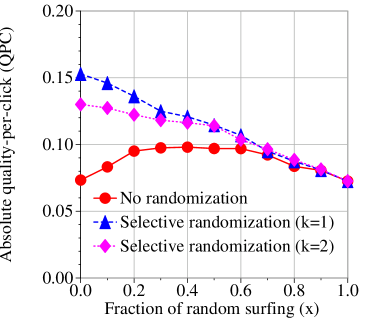
Figure 8 shows absolute QPC values for different values of (based on simulation). Unlike with other graphs in this paper, in this graph we plot the absolute value of QPC, because the ideal QPC value varies with the extent of random surfing (). Recall that denotes pure search engine based surfing, while denotes pure random surfing. Observe that for all values of , randomized rank promotion performs better than (or as well as) nonrandomized ranking. It is interesting to observe that when is small, random surfing helps nonrandomized ranking, since random surfing increases the chances of exploring unpopular pages (due to the teleportation probability). However, beyond a certain extent, it does not help as much as it hurts (due to the exploration/exploitation tradeoff as was the case for randomized rank promotion).
9 Summary
The standard method of ranking search results deterministically according to popularity has a significant flaw: high-quality Web pages that happen to be new are drastically undervalued. In this paper we first presented results of a real-world study which demonstrated that diminishing the bias against new pages by selectively and transiently promoting them in rank can improve overall result quality substantially. We then showed through extensive simulation of a wide variety of Web community types that promoting new pages by partially randomizing rank positions (using just randomization) consistently leads to much higher-quality search results compared with strict deterministic ranking. From our empirical results we conclude that randomized rank promotion is a promising approach that merits further study and evaluation. To pave the way for further work, we have developed new analytical models of Web page popularity evolution under deterministic and randomized search result ranking, and introduced formal metrics by which to evaluate ranking methods.
References
- [1] Alexa Search Engine. http://www.alexa.com/.
- [2] How Much Information? http://www.sims.berkeley.edu/research/projects/how-much-info-2003/, 2003.
- [3] R. Baeza-Yates, F. Saint-Jean, and C. Castillo. Web structure, dynamics and page quality. In Proc. String Processing and Information Retrieval, 2002.
- [4] S. Chakrabarti, A. Frieze, and J. Vera. The effect of search engines on preferential attachment. In Proc. SODA, 2005.
- [5] J. Cho and S. Roy. Impact of Search Engines on Page Popularity. In Proc. WWW, 2004.
- [6] J. Cho, S. Roy, and R. Adams. Page quality: In search of an unbiased web ranking. In Proc. SIGMOD, 2005.
- [7] S. L. Gerhart. Do Web search engines suppress controversy? http://firstmonday.dk/issues/issue9_1/gerhart/index.html#note5.
- [8] M. Hindman, K. Tsioutsiouliklis, and J. A. Johnson. Googlearchy.: How a Few Heavily-Linked Sites Dominate Politics on the Web. http://www.princeton.edu/~mhindman/googlearchy-hindman.pdf.
- [9] L. Introna and H. Nissenbaum. Defining the Web: The Politics of search Engines. IEEE Computer Magazine, 33(1):54–62, 2000.
- [10] G. Jeh and J. Widom. Scaling Personalized Web Search. In Proc. WWW, 2003.
- [11] T. Joachims. Optimizing Search Engines Using Clickthrough Data. In Proc. KDD, 2002.
- [12] L. P. Kaelbling, M. L. Littman, and A. P. Moore. Reinforcement learning: A survey. Journal of Artificial Intelligence Research, 4:237–285, 1996.
- [13] S. R. Kumar, P. Raghavan, S. Rajagopalan, and A. Tomkins. Recommendation systems: A probabilistic analysis. In Proc. FOCS, 1998.
- [14] R. Lempel and S. Moran. Predictive Caching and Prefetching of Query Results in Search Engines. In Proc. WWW, 2003.
- [15] A. Mowshowitz and A. Kawaguchi. Bias on the Web. Communcations of the ACM, 45(9):56–60, 2002.
- [16] A. Ntoulas, J. Cho, and C. Olston. What’s New on the Web? The Evolution of the Web from a Search Engine Perspective. In Proc. WWW, 2004.
- [17] L. Page, S. Brin, R. Motwani, and T. Winograd. The PageRank Citation Ranking: Bringing Order to the Web. Stanford Digital Library Tech. Project, 1998.
- [18] Search engine watch. http://searchenginewatch.com/.
- [19] C. Sherman. Are Search Engines Biased? http://searchenginewatch.com/searchday/article.php/2159431.
- [20] H. R. Varian. Resources on collaborative filtering. http://www.sims.berkeley.edu/resources/collab/.
- [21] J. Walker. Links and power: The political economy of linking on the web. In Proc. Hypertext, 2002.
- [22] P. S. Yu, X. Li, and B. Liu. On the Temporal Dimension of Search. In Proc. WWW, Poster Track, 2004.
Appendix A Real-World Effectiveness of Rank Promotion
In this section we describe a live experiment we conducted to study the effect of rank promotion on the evolution of popularity of Web pages.
A.1 Experimental Procedure
For this experiment we created our own small Web community consisting of several thousand Web pages containing entertainment-oriented content, and nearly one thousand volunteer users who had no prior knowledge of this project.
Pages: We focused on entertainment because we felt it would be relatively easy to attract a large number of users. The material we started with consisted of a large number of jokes gathered from online databases. We decided to use “funniness” as a surrogate for quality, since users are generally willing to provide their opinion about how funny something is. We wanted the funniness distribution of our jokes to mimic the quality distribution of pages on the Web. As far as we know PageRank is the best available estimate of the quality distribution of Web pages, so we downsampled our initial collection of jokes and quotations to match the PageRank distribution reported in [5]. To determine the funniness of our jokes for this purpose we used numerical user ratings provided by the source databases. Since most Web pages have very low PageRank, we needed a large number of nonfunny items to match the distribution, so we chose to supplement jokes with quotations. We obtained our quotations from sites offering insightful quotations not intended to be humorous. Each joke and quotation was converted into a single Web page on our site.
Overall site: The main page of the Web site we set up consisted of an ordered list of links to individual joke/quotation pages, in groups of ten at a time, as is typical in search engine responses. Text at the top stated that the jokes and quotations were presented in descending order of funniness, as rated by users of the site. Users had the option to rate the items: we equipped each joke/quotation page with three buttons, labeled “funny,” “neutral,” and “not funny.” To minimize the possibility of voter fraud, once a user had rated an item the buttons were removed from that item, and remained absent upon all subsequent visits by the same user to the same page.
Users: We advertised our site daily over a period of days, and encouraged visitors to rate whichever jokes and quotations they decided to view. Overall we had participants. Each person who visited the site for the first time was assigned at random into one of two user groups (we used cookies to ensure consistent group membership across multiple visits, assuming few people would visit our site from multiple computers): one group for which rank promotion was used, and one for which rank promotion was not used. For the latter group, items were presented in descending order of current popularity, measured as the number of funny votes submitted by members of the group.666Due to the relatively small scale of our experiment there were frequent ties in popularity values. We chose to break ties based on age, with older pages receiving better rank positions, to simulate a less discretized situation. For the other group of users, items were also presented in descending order of popularity among members of the group, except that all items that had not yet been viewed by any user were inserted in a random order starting at rank position (This variant corresponds to selective promotion with and .). A new random order for these zero-awareness items was chosen for each unique user. Users were not informed that rank promotion was being employed.
Content rotation: For each user group we kept the number of accessible joke/quotation items fixed at throughout the duration of our -day experiment. However, each item had a finite lifetime of less than days. Lifetimes for the initial items were assigned uniformly at random from , to simulation a steady-state situation in which each item had a real lifetime of days. When a particular item expired we replaced it with another item of the same quality, and set its lifetime to days and its initial popularity to zero. At all times we used the same joke/quotation items for both user groups.
A.2 Results
First, to verify that the subjects of our experiment behaved similarly to users of a search engine, we measured the relationship between the rank of an item and the number of user visits it received. We discovered a power-law with an exponent remarkably close to , which is precisely the relationship between rank and number of visits that has been measured from usage logs of the AltaVista search engine (see Section 5.3 for details).
We then proceeded to assess the impact of rank promotion. For this purpose we wanted to analyze a steady-state scenario, so we only measured the outcome of the final days of our experiment (by then all the original items had expired and been replaced). For each user group we measured the ratio of funny votes to total votes during this period. Figure 1 shows the result. The ratio achieved using rank promotion was approximately larger than that obtained using strict ranking by popularity.
Appendix B Proof of Theorem 1
Because we consider only the pages of quality and we focus on steady-state behavior, we will drop and from our notation unless it causes confusion. For example, we use and instead of and in our proof.
We consider a very short time interval during which every page is visited by at most one monitored user. That is, for every page . Under this assumption we can interpret as the probability that the page is visited by one monitored user during the time interval .
Now consider the pages of awareness . Since these pages are visited by at most one monitored user during , their awareness will either stay at or increase to . We use and to denote the probability that that their awareness remains at or increases from to , respectively. The awareness of a page increases if a monitored user who was previously unaware of the page visits it. The probability that a monitored user visits is . The probability that a random monitored user is aware of is . Therefore,
| (6) |
Similarly,
| (7) |
We now compute the fraction of pages whose awareness is after . We assume that before , and fraction of pages have awareness and , respectively. A page will have awareness after if (1) its awareness is before and the awareness stays the same or (2) its awareness is before , but it increases to . Therefore, the fraction of pages at awareness after is potentially
However, under our Poisson model, a page disappears with probability during the time interval . Therefore, only fraction will survive and have awareness after :
Given our steady-state assumption, the fraction of pages at after is the same as the fraction of pages at before . Therefore,
| (8) |
From Equations B, 7 and 8, we get
Since we assume is very small, we can ignore the second order terms of in the above equation and simplify it to
| (9) |
From the multiplication of , we get
| (10) |
We now compute . Among the pages with awareness , fraction will stay at after . Also, fraction new pages will appear, and their awareness is (recall our assumption that new pages start with zero awareness). Therefore,
| (11) |
After rearrangement and ignoring the second order terms of , we get
| (12) |
By combining Equations 10 and 12, we get