Co-Authorship Networks in the Digital Library Research Community
Abstract
The field of digital libraries (DLs) coalesced in 1994: the first digital library conferences were held that year, awareness of the World Wide Web was accelerating, and the National Science Foundation awarded $24 Million (U.S.) for the Digital Library Initiative (DLI). In this paper we examine the state of the DL domain after a decade of activity by applying social network analysis to the co-authorship network of the past ACM, IEEE, and joint ACM/IEEE digital library conferences. We base our analysis on a common binary undirectional network model to represent the co-authorship network, and from it we extract several established network measures. We also introduce a weighted directional network model to represent the co-authorship network, for which we define as an indicator of the impact of an individual author in the network. The results are validated against conference program committee members in the same period. The results show clear advantages of PageRank and AuthorRank over degree, closeness and betweenness centrality metrics. We also investigate the amount and nature of international participation in Joint Conference on Digital Libraries (JCDL).
keywords:
Digital library , AuthorRank , Social network analysis , Co-authorship, , and
1 Introduction and Motivation
In 1994, the National Science Foundation awarded $24 Million (U.S.) to six institutions, thereby officially kicking off the federally-sponsored DL research program. Also in 1994, the first of what was later to become the IEEE Advances in Digital Libraries (ADL) conference and the ACM Digital Libraries (DL) conference were held in New Jersey and Texas, respectively. In 2001, the two conference series were merged and the first ACM/IEEE Joint Conference on Digital Libraries (JCDL) was held in Virginia. These conferences have induced a pattern of collaborations which has shaped the domain of DLs over the past decade. To study the structure of these collaborations, and thereby learn more about the DL research community itself, we used social network analysis to investigate authorship trends in the composite corpus of the DL, ADL and JCDL conferences.
Many co-authorship networks have been studied [Newman, 2001a, Smeaton et al., 2002, Farkas et al., 2002, Cunningham and Dillon, 1997, Egghe et al., 2000] to investigate the structure of scientific collaborations, and several have studied DL discipline in general [Mutschke, 2001, Cunningham, 2001]. The DL community offers an interesting case study for a number of reasons. Firstly, it is a quickly growing, dynamic field which has only existed since approximately 1994. Investigations of its present status and structure will yield valuable data for future longitudinal studies. Secondly, the domain of DLs is a highly multidisciplinary community which has attracted researchers from a wide area of expertise, e.g. databases, networking, information and library science, human computer interaction, high performance computing, archiving, and education. This enriches DL research with the expertise of a variety of scholars, but may lead to fractionating of the community. Lastly, in such a dynamic, and new domain, few journals exist that are peer-reviewed and included in the ISI Journal Citation Reports. This makes it difficult to assess the status, impact and influence of researchers and their institutions if traditional methods cannot be applied.
We are interested in the structure of collaborations within the DL research community and quantitative metrics for the concepts of status and influence. In this paper, we study author status by determining author centrality in a co-authorship network derived from the ADL, DL and JCDL conferences from 1994-2004. Other DL conferences exist: the European Conference on Digital Libraries (ECDL) began in 1997, the International Conference on Asian Digital Libraries (ICADL) began in 1998, and the Russian Conference on Digital Libraries (RCDL) began in 1999. In addition to these conferences, the DL research community is covered by online serials such as D-Lib Magazine and the Journal of Digital Information. Although there is a Journal of Digital Libraries, much of the DL research results are covered in traditional journals by the respective communities outlined above. We chose the ADL, DL and JCDL conference series because of our familiarity with the conferences, the ease of automated data collection of them, their longevity, their sponsorship by the ACM and IEEE, and the fact that they were the first such conferences to be held. Although ADL, DL and JCDL are international conferences, the fact that they are always held in the U.S. will surely influence the results, because attendance of an author is required for paper acceptance.
To perform this analysis, we built a weighted directional network model to represent collaboration relationships. We applied a variety of centrality measures to investigate this network and then defined AuthorRank, an alternative centrality metric which exploits the features of such networks. The result is validated against the set of past DL, ADL and JCDL program committee members on the assumption that program committee members can be regarded as prestigious actors in a field. Our results show clear advantages of the use of AuthorRank and PageRank.
2 Background and Related Work
Social network analysis has attracted considerable interest in recent years and plays an important role in many disciplines [Otte and Rousseau, 2002, Wasserman and Faust, 1994, Scott, 2000, Barabási, 2002, Watts, 2001]. A popular culture example is the Oracle Of Bacon project [Tjaden, 2003], which determines the distance between any actor and Kevin Bacon by examining movie co-starring relationships. This fun example demonstrates the usefulness that can arise by adapting the concept of a relationship in social network analysis to the domain of interest. By defining a relationship to be the co-authoring of an ADL, DL or JCDL conference paper, we can bring social network analysis methods to bear on our analysis of the DL research community.
2.1 Social Network Analysis
Social network analysis is based on the premise that the relationships between social actors can be described by a graph. The graph’s nodes represent social actors and the graph’s edges connect pairs of nodes and thus represent social interactions. This representation allows researchers to apply graph theory [Wasserman and Faust, 1994] to the analysis of what would otherwise be considered an inherently elusive and poorly understood problem: the tangled web of our social interactions. In this article, we will assume such graph representation and use the terms node, actor, and author interchangeably. The terms edge, relationship, and co-authorship are also used interchangeably.
Given that we have established a social network graph, we can describe its properties on two levels, namely by global graph metrics and individual actor properties. Global graph metrics seek to describe the characteristic of a social network as a whole, for example the graph’s diameter, mean node distance, the number of components (fully connected subgraphs), cliques, clusters, small-worldness, etc. Actor properties relate to the analysis of the individual properties of network actors, e.g. actor status, distance, and position in a cluster.
The status of an actor is usually expressed in terms of its centrality, i.e. a measure of how central the actor is to the network graph. Central actors are well connected to other actors and metrics of centrality will therefore attempt to measure an actor’s degree (number of in- and out- links), average distance to all other actors, or the degree to which geodesic paths between any pair of actors passes through the actor.
A class of impact metrics focuses on the recursive nature of status. Clearly, when one is endorsed by a high status actor, this increases one’s status more than being endorsed by a low status actor. Hence, one’s status can be derived from the status of the actors one is linked to. This leads to a recursive definition of status which is mathematically addressed by eigenvector analysis. Since the web’s hyperlink structure mimics the properties of a social network graph (WWW pages are nodes, hyperlink are edges), eigenvector analysis can also used to measure the prestige of web pages; well-known algorithms include PageRank [Page et al., 1998], SALSA [Lempel and Moran, 2000] and HITS [Kleinberg, 1999]. However, in these algorithms all edges by definition have binary weights: a hyperlink either exists or does not exist, and a social relationship exists or does not exist. Bharat and Henzinger [Bharat and Henzinger, 1998] developed a weighted edge scheme to improve the HITS algorithm. Given its formulation, it is also possible to modify the assumption of equiprobability underlying PageRank’s formulation to take edge weight into account [Chakrabarti, 2003].
2.2 Co-Authorship Networks
Co-authorship networks are an important class of social networks and have been used extensively to determine the structure of scientific collaborations and the status of individual researchers. Although somewhat similar to the much studied citation networks in the scientific literature [Garfield, 1979], co-authorship implies a much stronger social bond than citation. Citations can occur without the authors knowing each other and can span across time. Co-authorship implies a temporal and collegial relationship that places it more squarely in the realm of social network analysis.
An early example of a co-authorship network is the Erdös Number Project, in which the smallest number of co-authorship links between any individual mathematician and the Hungarian mathematician Erdös are calculated [Castro and Grossman, 1999]. (A mathematician’s “Erdös Number” is analogous to an actor’s “Bacon Number”.) Newman studied and compared the co-authorship graph of arXiv, Medline, SPIRES, and NCSTRL [Newman, 2001a, Newman, 2001b] and found a number of network differences between experimental and theoretical disciplines. Co-authorship analysis has also been applied to various ACM conferences: Information Retrieval (SIGIR) [Smeaton et al., 2002], Management of Data (SIGMOD) [Nascimento et al., 2003] and Hypertext [Chen and Carr, 1999], as well as mathematics and neuroscience [Farkas et al., 2002], information systems [Cunningham and Dillon, 1997], and the field of social network analysis [Otte and Rousseau, 2002]. International co-authorship networks have been studied in Journal of American Society for Information Science & Technology (JASIST) [He and Spink, 2002] and Science Citation Index [Wagner and Leydesdorff, 2003].
3 Constructing Co-Authorship Networks
We present the representational foundations of our work by discussing three approaches to model co-authorship networks. The first model is a traditional undirected, binary graph, the second model is a directed, binary network which allows calculation of actor prestige, and in the third model we consider weighted co-authorship relations in the network. A set of centrality and prestige metrics is adapted to operate on the resulting graphs. In particular, we propose AuthorRank, a weighted version of PageRank.
3.1 Binary, Undirected Co-Authorship Networks
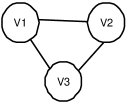
A simple and widely used co-authorship network model is based on an undirected, binary graph in with each edge represents a co-authorship relationship.
Consider two articles:
| article | authors | |
|---|---|---|
| article 1 | ||
| article 2 |
If any two authors co-authored an article, an edge with unit weight is created (Figure 1(a)). For example, in the table above, authors and would be connected by an edge since they co-authored article 1.
The resulting graph is denoted as an undirected unit-weighted graph , where the set of authors is denoted and represents the edges between authors. As will be shown in following sections, various graph metrics can be extracted from this kind of network.
3.2 Binary, Directed Co-Authorship Networks
In order to measure prestige of an author, we must distinguish “endorsement” accorded from endorsement received by authors. In social network analysis, the concept of prestige is defined for directional relationships. In order to convert a co-authorship graph to a directed graph, we make the following assumptions:
-
1.
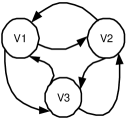
any undirected network can be represented as a directed network with symmetric linkage, i.e. every edge in the undirected network is replaced by two, symmetrical directed edges;
-
2.
the resulting directional, symmetrical edges represent the mutual endorsement of authors. In fact, in a random walk model, the directional edges can be understood as the bi-directional movement of a surfer;
-
3.
The edge weight is a binary value, indicating the presence or absence of two symmetrical edges.
The resulting graph is denoted as a directed unit-weighted graph (Figure 1(b)). As will be shown in the following sections, PageRank and other prestige measures can be applied to this network.
3.3 Weighted, Directed Co-Authorship Networks
The binary graph representation of co-authorship network omits a number of factors which shape collaboration patterns among authors. There are many cases in which the binary network does not correspond with a common sense notion of magnitude. For example, if two authors co-publish many papers, should the link between them be considered more important than the link between occasional co-authors? Also, if one article has two authors and another article has a hundred authors, should the authors in the first article be considered more connected than those of the second article?
To allow an expression of relationship magnitude we represent the co-authorship network as a directed weighted graph. The co-authorship graph is denoted , where is the set of nodes (authors), is the set of edges (co-author relationships between authors), and is the set of weights associated with each edge connecting a pair of authors .
We propose to determine the magnitude of the link between two authors on the basis of two factors:
-
1.
Frequency of co-authorship: authors that frequently co-author should have a higher co-authorship weight.
-
2.
Total number of co-authors on articles: if an article has many authors, each individual co-author relationship should be weighted less.
We can now determine the weight of co-authorship links. Let the set of authors be denoted as . Let the set of articles be denoted as , and be the number of authors of article . We define:
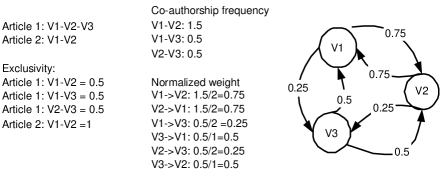
Exclusivity: If authors and are co-authors in article ,
| (1) |
represents the degree to which author and have an exclusive co-authorship relation for a particular article. This definition gives more weight to co-author relationships in articles with fewer total co-authors than articles with large numbers of co-authors, i.e. it weighs the co-authorship relation in terms of how exclusive it is.
Co-authorship frequency:
| (2) |
The co-authorship frequency consists of the sum of all values for all articles co-authored by and . This gives more weight to authors who co-publish more papers together, and do so exclusively.
Normalized weight:
| (3) |
This normalization ensures that the weights of an author’s relationships sum to one.
The notions of exclusivity and frequency used in determining co-authorship relations correspond to the principles underlying Term Frequency vs. Inverse Document Frequency (TFIDF) weighting used in IR [Baeza-Yates and Ribeiro-Neto, 1999]. A TFIDF term weight expresses how strongly a term is tied to a particular document on the basis of how frequently the term occurs in the document itself versus how frequently it occurs in all documents in the collection. In other words, a term which is exclusively tied to a particular document will be most frequent within the document itself, i.e. its term frequency is high, while being relatively rare across the collection, i.e. its document frequency is low. In the same manner, we normalize the raw co-authorship frequency by the number of co-authors, the latter an indication of how exclusive or non-exclusive the co-authorship relations is.
The proposed weighting scheme also has an intuitive basis in random walks on graphs (Figure 1(c)). The normalized weight corresponds to the probability distribution of a random walk on the co-authorship graph. A random walker may choose to start navigating the network from any author. In Figure 1(c), if the walk starts from author , the walker may travel to or with probability and respectively. If the walker starts from author , however, the walker has the same probability of visiting or . The weighted co-authorship also has an intuitive meaning as the endorsement of an author. For example, from Figure 1(c), we can understand that and have a higher mutual endorsement since they co-authored more papers.
3.4 Metrics for Co-Authorship Network
A number of social network metrics are available for measuring the characteristics of a binary undirected collaboration network, including components analysis, small world analysis, and centrality analysis. These metrics measure various network properties and some may only be applied under certain conditions. The metrics used in this paper and their applicability are listed in Table 1 and discussed below.
| Metric | Type | Property | Scope | Importance | ||||
|---|---|---|---|---|---|---|---|---|
| Binary | Weighted | Actor | Global | Whole | Largest | Centrality | Prestige | |
| Network | Component | |||||||
| Component | ||||||||
| Small World | ||||||||
| Cluster | ||||||||
| Closeness | ||||||||
| Betweenness | ||||||||
| Degree | ||||||||
| PageRank | ||||||||
| AuthorRank | ||||||||
3.4.1 Component size analysis
A component of a graph is a subset with the characteristic that there is a path between any node and any other node of this subset. A co-authorship network usually consists of many disconnected components (e.g. disconnected research groups or individuals), and component analysis can be used to learn about the structure of the network. Some network analysis methods are only widely used in connected networks. Therefore, in networks with disconnected components, those methods are typically only applied to the largest connected component, as shown in Table 1.
3.4.2 Degree, closeness, betweenness centrality
We have adapted three common centrality metrics, namely degree centrality, closeness centrality, and betweenness centrality [Wasserman and Faust, 1994], for their use on binary, undirected co-authorship networks.
Degree centrality of a node is defined as the total number of edges that are adjacent to this node. Degree centrality represents the simplest instantiation of the notion of centrality since it measures only how many connections tie authors to their immediate neighbors in the network.
However, authors may be well connected to their immediate neighbors but be part of a relatively isolated clique. Although locally well connected, overall centrality is low. Closeness centrality therefore expands the definition of degree centrality by focusing on how close an author is to all other authors. To calculate a node’s closeness centrality we determine its shortest-path distances to all authors in the network and invert these values to a metric of closeness. A central author is thus characterized by many, short connections to other authors in the networks.
Betweenness centrality represents a different operationalization of centrality. It is based on determining how often a particular node is found on the shortest path between any pair of nodes in the network. Nodes that are often on the shortest-path between other nodes are deemed highly central because they control the flow of information in the network. Betweenness centrality can be used in disconnected networks, however it may generate a large number of nodes with zero centrality, since many nodes may not act as a bridge in the network.
Though the discussed centrality metrics can be extended to directed and weighted networks, this has received less attention [Newman, 2004, Wasserman and Faust, 1994]. In this article we will focus on their usage in binary, undirected networks.
3.4.3 Eigenvector centrality or PageRank
PageRank is the ranking mechanism at the heart of Google [Page and Brin, 1998, Page et al., 1998]. In PageRank, a hyperlink is understood as an “endorsement” relationship. PageRank’s definition of prestige deviates from the degree, closeness and betweenness centrality by modeling inherited or transferred status.
A page has high rank if the sum of the ranks of its backlinks is high. This covers both the case when a page has many backlinks and when a page has a few highly ranked backlinks. PageRank can be calculated using a simple iterative algorithm, and corresponds to the principal eigenvector of the normalized link matrix of the web.
PageRank is originally designed to rank retrieval results based on the hyperlink structure of the web, which is a directed but binary graph in nature, therefore we apply PageRank to the binary directed network model. Our work is inspired by a variety of proposals to extend PageRank to weighted and bi-directional networks. Eigenvalue centrality was originally intended for an undirected graph [Bonacich, 1972]. Applying PageRank and related centrality measures in a weighted environment is discussed in [Newman, 2004, Newman, 2003]. Other variations and improvements to PageRank include a “topic sensitive” PageRank to improve search performance [Haveliwala, 2003], distributed computation techniques for calculating PageRank [Sankaralingam et al., 2003, Wang and DeWitt, 2004], and faster computation of PageRank [Kamvar et al., 2003].
3.4.4 AuthorRank: PageRank for weighted, directional networks
We submit that PageRank can be applied to an undirectional co-authorship graph by transforming each undirectional edge into a set of two directional, symmetrical edges. However, the reduction of edge weights to binary values entails a severe loss of information. The generated co-authorship weights express valuable information which should, and can, be taken into account when calculating PageRank values over a weighted co-authorship graph.
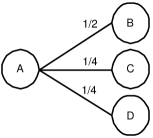
We therefore define AuthorRank, a modification of PageRank which considers link weight. It is based on a modification of the PageRank assumption that a node transfers its PageRank values evenly to all the nodes it connects to. Indeed, PageRank assumes that when a node A connects to other nodes, each receives a fraction of . In probabilistic terms, this models a random walker who is equally probable to walk from node A to each of its connecting nodes. However, in reality, the chances of link traversal can be expected to be distributed quite unevenly and according to the degree of relationship between and the nodes it connects to. Our co-authorship link weights express how strongly related two nodes, or authors, are in the co-authorship graph and these weights can therefore be used to determine the amount of PageRank that should be transferred from node A to the nodes it connects to (Figure 2).
The AuthorRank of an author is then given as follows:
where corresponds to the AuthorRank of the backlinking node, and corresponds to the edge weight between node and . The AuthorRank can be calculated with the same iterative algorithm used by PageRank. One may think of AuthorRank as a generalization of PageRank by substituting with in PageRank, in which is defined as the number of links going out of page j.
Looking at the example network underlying Figure 1 and Figure 2, AuthorRank better reveals status of actors than centrality measures and PageRank. When collaboration frequency and exclusivity are considered, and are more prestigious than in the network, AuthorRank captures this property, while centrality measures and PageRank cannot.

4 DL Research Community Co-Authorship Analysis
4.1 Generating the Co-authorship Network
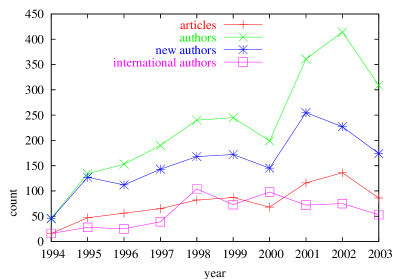
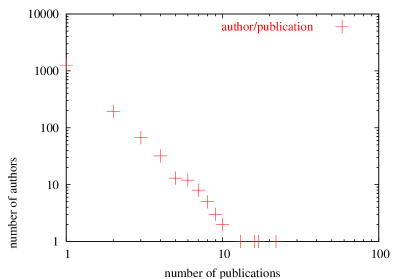
We extracted co-authorship data from DBLP (http://dblp.uni-trier.de/) for ACM DL (1995-2000), IEEE ADL (1994-2000), and JCDL (2001-2003). This includes all long papers, short papers, posters, demonstrations, and organizers of workshops. 111Unfortunately, due to an error in DBLP, the DL 94 dataset was omitted. We do not believe this omission will significantly alter our findings. The dataset contained 1567 authors, 759 publications, and 3401 co-authorship relationship pairs. Some statistics are readily available from this data set. For example, the number of articles, authors, international (non-US) authors, and new authors per year are shown in Figure 3. It can be seen that number of articles and the number of authors are highly correlated, and that a major boost occurred following the merger of the ACM/IEEE DL series into a single JCDL conference. Figure 4 shows the number of publications per author. The values range between 1 and 22, with 4 authors publishing more than 10 papers and 78% of the authors publishing only 1 paper and 95% authors having 3 papers or less. Authors with 8 or more publications are shown in Table 2. Each paper has a mean of 3.02 authors and a median of 3 authors. The distribution of number of authors per paper is shown in Table 3.
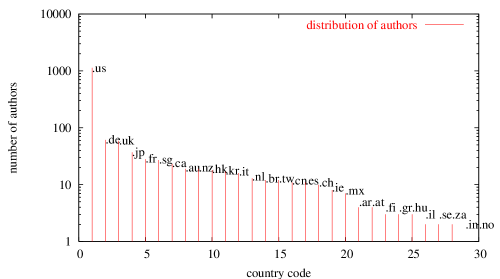
We also studied international collaboration. Approximately 72% (1133/1567) of the authors are affiliated with U.S. institutions. We discovered that among 3401 co-authorship relationships, only about 7% are collaborations between authors from different countries. A country collaboration network is created by accumulating cross-country collaborations from the author network. Figure 5 shows the result; countries are represented by domain names, and two countries are closer to each other if authors from those countries collaborated closely. The figure can only be considered approximate due to the limitations of the visualization technology used. Figure 5 shows that JCDL community is centered around .us, with .uk, .nz, and .sg closely surrounding .us; .nz and .de also play significant roles in connecting different countries. There are nine countries (.es, .ie, .at, .hu, .nl, .in, .kr, .il, and .za; with 61 authors) that are not connected with other countries. The distribution of authors from each country is shown in Figure 6.

| Name | Publications |
|---|---|
| Hsinchun Chen | 22 |
| Edward A. Fox | 17 |
| Ian H. Witten | 16 |
| Hector Garcia-Molina | 13 |
| Alexander G. Hauptmann | 10 |
| Gary Marchionini | 10 |
| Judith Klavans | 9 |
| Carl Lagoze | 9 |
| Michael L. Nelson | 9 |
| David Bainbridge | 8 |
| Richard Furuta | 8 |
| Ee-Peng Lim | 8 |
| Catherine C. Marshall | 8 |
| Terence R. Smith | 8 |
| Number of authors | Number of papers | Percentage |
| 1 | 149 | 19.6% |
| 2 | 216 | 28.5% |
| 3 | 179 | 23.6% |
| 4 | 94 | 12.4% |
| 5 | 45 | 5.9% |
| 6 | 33 | 4.3% |
| 7 | 20 | 2.6% |
| 8 | 7 | 0.9% |
| 9 | 4 | 0.5% |
| 10 | 5 | 0.7% |
| 11 | 1 | 0.1% |
| 12 | 2 | 0.3% |
| 13 | 1 | 0.1% |
| 14 | 1 | 0.1% |
| 15 | 2 | 0.3% |
| total | 100% |
4.2 Component Size Analysis
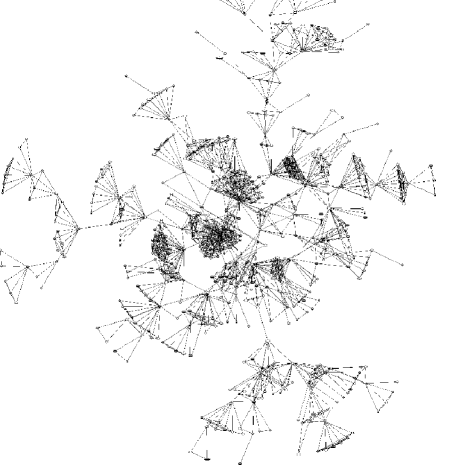
Similar to observations from previous research in co-authorship networks, the DL co-authorship network is not a single connected graph. The largest component of the network has 599 authors, the second largest component has 31 nodes and so on. The entire co-authorship network with all components is visualized in Figure 7, in which nodes represent authors and links represent co-authorship relationship. The largest component is on the left side of the Figure, while the right side shows many small components. Well-connected components are recognizable by their very dense (dark) shape.
Nascimento [Nascimento et al., 2003] reports that the largest component in SIGMOD’s co-authorship graph has about 60% of all authors. In the four co-authorship networks studied by Newman [Newman, 2001a], NCSTRL has the smallest largest component, containing 57.2% of all authors. However, in the JCDL co-authorship network the largest component only includes 38% of all authors. Several possible explanations could account for this low value, including the relative immaturity of the the DL field, the multi-disciplinary nature of the composite JCDL conference series, the fact that many DL projects grow from a “grass-roots”, institutionally oriented focus [Esler and Nelson, 1998], or limited international collaboration in the DL research community.
To better understand the nature of major components and the reason for them not being in the large component, we conducted a manual analysis of other large components. This showed that the most dense shapes include authors from the same institution or working on the same project. We counted 18 components with sizes ranging from 7 to 31. By checking the affiliation of authors, we discovered that 5 components consist mainly of non-US participants, and that the 31-node component represents the medical informatics community. By checking titles and content, we found that 13 components account for short papers or posters only, many of which are about a specific DL application in a particular scenario. Therefore, it is our guess that the short paper and poster programs encourage a wide participation from other disciplines.
4.3 Cluster Analysis
The weighted graph model also improves the clustering because close and frequent collaboration causes higher similarity scores between authors, resulting in them being grouped closer together. By representing each author as a vector of relationships to other authors using the weighted graph model, we conducted a bottom-up, hierarchical clustering algorithm on the largest component of the co-authorship network. The hierarchical clustering algorithm starts with all authors and successively combines them into groups with high inter-authorship similarity. Typically, the earlier mergers happen between groups with a large similarity, and similarity becomes lower and lower for later merges. The result reveals that initial clusters do not necessarily reflect institutional boundaries. This may be due to the fact that authors may change institutions, and in some cases strong collaborations exist between institutions. In the next stage, institutions are merged into larger clusters due to their joint publications or common research interests. A well-connected author is usually only clustered in this stage, which confirms that well-connected authors play an important role in connecting different clusters.
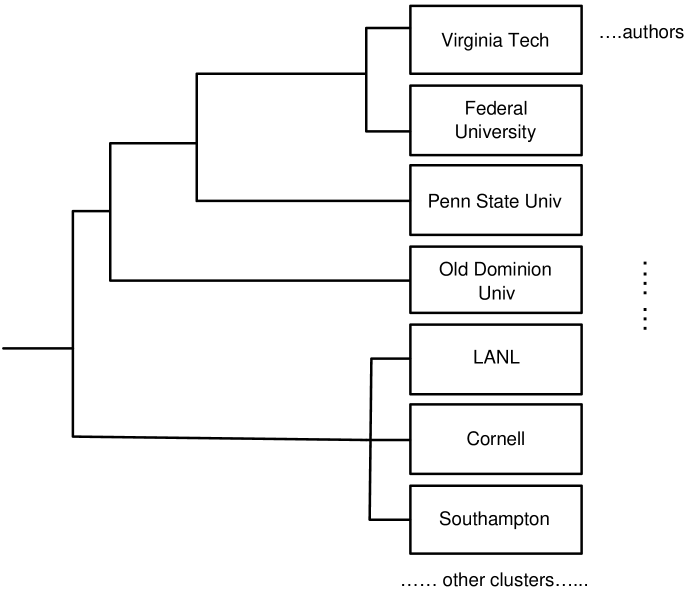
As a matter of illustration, the clusters to which the authors of this paper belong are shown in Figure 8. As can be seen, small clusters are initially formed in each authors’ institution (Los Alamos National Laboratory and Old Dominion University), and later institutions are merged to larger clusters. The frequency of joint publications may explain the different stage of merging. By checking publications in each cluster, we found that LANL, Cornell University and the University of Southampton form a larger cluster because Cornell cooperated with Southampton in the Open Citation project, and LANL worked with Cornell on the Open Archives Initiative. Similarly, Virginia Tech (VT) collaborated with the Federal University of Minas Gerais in Brazil in the Web-DL project [Calado et al., 2003], with Penn State (PSU) in the CITIDEL project, and with Old Dominion University (ODU) in the NCSTRL project. ODU and PSU have no joint publications, they are clustered together because both collaborated with VT. VT and Federal University of Minas Gerais probably merged earlier because they have more joint publications.
4.4 Small World Analysis
Since small world analysis can only be done in a connected graph, we used the largest component of the co-authorship network for our calculation. The largest component (599 authors and 1897 links) has a clustering coefficient of 0.89, and a characteristic path length of 6.58. With a similarly sized connected random graph, the clustering coefficient is 0.31 and the characteristic path length is 3.66. This means that the JCDL co-authorship network is a small world graph as can be expected. The giant component is shown in Figure 9.
Nascimento [Nascimento et al., 2003] reports that the SIGMOD co-authorship graph yields a clustering coefficient of 0.69, and a characteristic path length of 5.65. In all four networks studied by Newman, the largest clustering coefficient generated is 0.726. This shows a rather high clustering coefficient of the JCDL co-authorship network, meaning that co-authors of one author are more likely to publish together. The JCDL co-authorship network also has a rather long characteristic path length, indicating that authors from different groups are not as well connected as, for example, those in the SIGMOD co-authorship network.
4.5 Centrality
Using the R package (http://www.r-project.org/), we calculated the degree, closeness, and betweenness centrality for the binary undirected co-authorship network only, as these metrics are not well defined in a weighted network. The highest ranking 20 authors for each metric and their scores are listed in Table 4.
| rank | Degree | Betweenness | Closeness | |||
|---|---|---|---|---|---|---|
| 1 | Hsinchun Chen | 59 | Hsinchun Chen | 89250.92 | Hsinchun Chen | 0.259 |
| 2 | Edward A. Fox | 55 | Edward A. Fox | 83163.92 | Edward A. Fox | 0.251 |
| 3 | Terence R. Smith | 31 | Judith Klavans | 57422.69 | Judith Klavans | 0.235 |
| 4 | Carl Lagoze | 31 | William Y. Arms | 52242.27 | Gary Marchionini | 0.234 |
| 5 | Judith Klavans | 27 | Nina Wacholder | 39226.5 | Michael L. Nelson | 0.229 |
| 6 | Zan Huang | 26 | Craig Nevill-Manning | 38808.08 | Yiwen Zhang | 0.226 |
| 7 | Gary Marchionini | 25 | David M. Levy | 35769.0 | Ann M. Lally | 0.226 |
| 8 | William Y. Arms | 21 | Ann P. Bishop | 32280.0 | Lillian N. Cassel | 0.226 |
| 9 | Richard Furuta | 21 | Tobun D. Ng | 30197.13 | Byron Marshall | 0.225 |
| 10 | Luis Gravano | 20 | Gary Marchionini | 29593.86 | Rao Shen | 0.225 |
| 11 | Michael Freeston | 19 | Alexander Hauptmann | 29142.0 | William Y. Arms | 0.224 |
| 12 | Ian H. Witten | 18 | Catherine C. Marshall | 28587.0 | Anne Craig | 0.221 |
| 13 | Hector Garcia-Molina | 18 | Terence R. Smith | 23691.87 | Larry Brandt | 0.221 |
| 14 | Michael G. Christel | 18 | Carl Lagoze | 22192.66 | Terence R. Smith | 0.219 |
| 15 | David Millman | 18 | David Bainbridge | 21168.03 | Tobun D. Ng | 0.219 |
| 16 | Tamara Sumner | 18 | Michael L. Nelson | 20696.41 | James C. French | 0.219 |
| 17 | Diane Hillmann | 18 | Howard D. Wactlar | 17577.0 | Kurt Maly | 0.212 |
| 18 | Yilu Zhou | 18 | Ching-chih Chen | 17309.67 | Mohammad Zubair | 0.212 |
| 19 | Jialun Qin | 18 | John J. Leggett | 15845.5 | Hesham Anan | 0.212 |
| 20 | Mary Tiles | 18 | Elizabeth D. Liddy | 14964.0 | Xiaoming Liu | 0.212 |
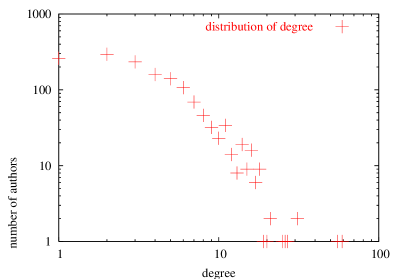
4.5.1 Degree centrality
The degree centrality distribution is shown in Figure 10. It follows a rough power-law distribution with a few authors having a high degree of connection, and most authors have low degree. This measurement has the disadvantage of giving many authors the same weight. It is also biased to authors with many co-authors on a single publication, which is common in experimental sciences [Newman, 2001a]. The time complexity is .
4.5.2 Closeness centrality
The closeness centrality is only applied to the largest component (599 authors) since closeness is not well defined in a disconnected network. It has a bias toward authors that are directly connected to a well-connected author. For example, we discovered in Table 4 that graduate assistants of a prestigious professor may have a fairly high weight. The time complexity is , where is the number of authors in the network.
4.5.3 Betweenness centrality
The betweenness centrality is applied to the whole network, however only 153 authors have positive values. The remaining 1414 authors do not lie on the shortest paths between other authors. Betweenness is, in some sense, a measure of the influence a node has over the spread of information through the network, and indeed some high-ranking authors play crucial rules in connecting different communities.
The computation of betweenness centrality is the most resource-intensive of all measures we explored, since it requires enumerating all of the shortest paths between each pair of nodes. The time complexity is , where is the number of authors in the network, thus limiting its feasibility in large networks.
4.6 PageRank and AuthorRank
We developed a Java program with a MySQL backend to calculate PageRank and AuthorRank. Both calculations can be completed in several seconds. The 20 highest scoring authors for the PageRank and AuthorRank metrics are listed in Table 5. The time complexity of both algorithms is , where is the number of authors in the network.
| Rank | PageRank | AuthorRank |
|---|---|---|
| 1 | Edward A. Fox | Hsinchun Chen |
| 2 | Hsinchun Chen | Edward A. Fox |
| 3 | Carl Lagoze | Ian H. Witten |
| 4 | Judith Klavans | Gary Marchionini |
| 5 | Richard Furuta | Hector Garcia-Molina |
| 6 | Gary Marchionini | Carl Lagoze |
| 7 | Michael G. Christel | Alexander G. Hauptmann |
| 8 | Terence R. Smith | Judith Klavans |
| 9 | Tamara Sumner | Richard Furuta |
| 10 | Ian H. Witten | Terence R. Smith |
| 11 | Alexander G. Hauptmann | Tamara Sumner |
| 12 | Hector Garcia-Molina | Ee-Peng Lim |
| 13 | Javed Mostafa | Michael G. Christel |
| 14 | Alexa T. McCray | Michael L. Nelson |
| 15 | Ee-Peng Lim | Wee Keong Ng |
| 16 | David Bainbridge | Javed Mostafa |
| 17 | Sally Jo Cunningham | David Bainbridge |
| 18 | Luis Gravano | J. Alfredo Sánchez |
| 19 | Catherine C. Marshall | Alexa T. McCray |
| 20 | W. Bruce Croft | Andreas Paepcke |
4.7 Correlation and validation
Several articles have compared the performance of centrality and prestige metrics, and a general conclusion can be that no single measure is suited for all applications; each method has its virtues and utility [Wasserman and Faust, 1994, Chakrabarti, 2003]. We verified and compared metrics in two ways: by the computation of the Spearman correlation coefficient across ranking methods, and by cross-validation against the dataset of JCDL program committee members.
4.7.1 Spearman Correlation
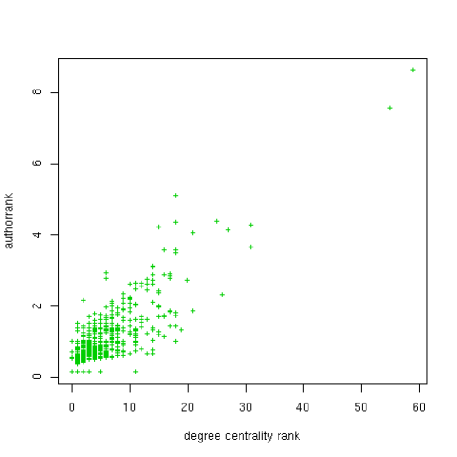
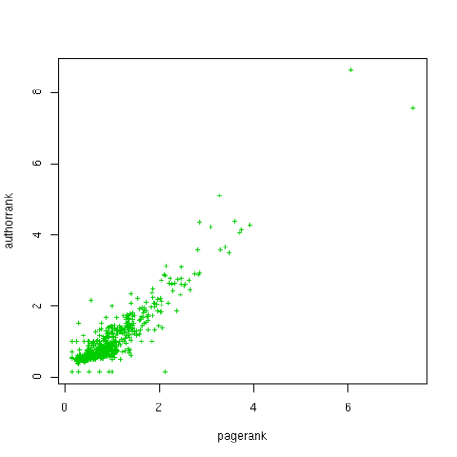
The Spearman correlation coefficient is used to measure the strength of association between two variables. In our case, since betweenness generated only 153 authors with positive ranking, and closeness centrality has only been calculated for the largest component, we only compare degree centrality, PageRank, and AuthorRank. The correlation coefficient between the degree centrality and PageRank is 0.52, and the correlation coefficient between the degree centrality and AuthorRank is 0.30 (Figure 11). As expected, PageRank and AuthorRank are more closely correlated with a correlation coefficient of 0.75 (Figure 11).
4.7.2 Program committee validation
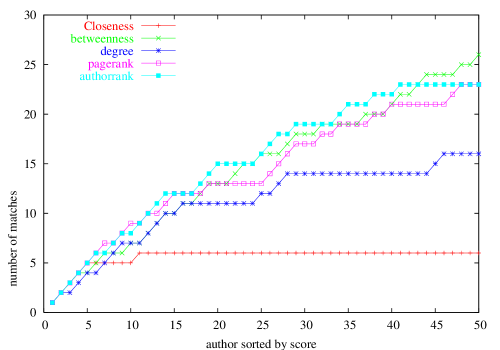
We also verified each ranking method against a dataset consisting of all members of the JCDL, ADL and DL program committees from 1994 to 2004. This is meaningful, as program committee members are assumed to be prestigious actors in the co-authorship network. To that end, the names of all JCDL, ADL and DL program committee members were collected from the conference web sites or printed proceedings. The highest scoring 50 authors for each ranking method (degree, closeness, betweenness, PageRank, AuthorRank) were then matched one by one against each JCDL committee member to identify matches.
Figure 12 shows the result of this comparison. The highest ranking 5 authors for each metric have an almost perfect match against the dataset of JCDL program committee members. Overall closeness ranking performs the worst, as only six authors of the 50 highest ranking authors are on the JCDL committees. This is not a surprise since closeness measures the distance to other authors, and since an author next to a prominent author is not necessarily also a prominent author. Degree centrality had mediocre performance. Betweenness centrality performs the best among the three centrality measures. Since betweenness evaluates one’s importance as a bridge between others, this suggests a committee member may be more likely to serve as a bridge between research groups than a non-committee member. Betweenness, PageRank, and AuthorRank all show good results, however PageRank and AuthorRank are feasible in large networks due to their low computational complexity. The results of PageRank and AuthorRank are highly correlated, but there is no conclusive evidence that one performs better than the other.
5 Conclusions and future applications
In this paper we investigated the co-authorship network of the DL research community as represented in the ADL, DL and JCDL conference series. We also presented AuthorRank, an alternative metric for ranking authors’ prestige in weighted co-authorship networks. So what does it all mean? What have we learned about the state of DL research 10 years after the first DL conference?
Our analysis paints the picture of a domain that is in many ways still evolving the rich networks of collaboration common in other areas of the scientific enterprise. Our co-authorship graphs indicate a rich tapestry of collaborations across institutional boundaries, but demonstrate a significantly higher degree of clustering and dispersion than one would find in other domains. In comparison with other co-authorship networks for related disciplines, we find the DL research community co-authorship graph has a smaller largest component, a larger clustering coefficient and a larger characteristic path length. DL authors thus collaborate closely within specific clusters but restrict their collaborations to specific groups of interest.
Do these results mean collaboration is less valued in DL research? Of particular interest is our result demonstrating how well our calculations of author status, i.e. PageRank and AuthorRank, in the co-authorship graph correspond to the JCDL program committees. Although the domain of DLs is less well-connected than other scientific domains, the value of collaboration still functions as an invisible hand guiding the selection of program committees in at least one seminal DL conference. It is thus of vital importance that a continued emphasis be placed on collaboration to ensure DL research will be even more of the open, diverse, but well connected marketplace of ideas it is today.
Potentially, the presented network models have several applications. PageRank or AuthorRank could be used as alternative metrics to evaluate research impacts, they can objectively guide how conference program committees are established, or to quantitatively evaluate the prestige of conferences based on their program committees. The weighted model has an advantage for the visualization of a co-authorship graph, which makes it possible to emphasize important links and truncate trivial links. Based on this idea, our colleagues built an interactive author navigation tool [Liu et al., 2004] based on the webdot tool of GraphViz (http://www.graphviz.org). Users can select a preferred author (center of the graph), set a distance from the selected author, and indicate the minimum weight necessary for links to be displayed. In this visualization, the weight of a link plays an important role as it allows users to identify important links.
6 Acknowledgments
We would like to thank Rick Luce, Linn Marks, Patrick Hochstenbach, and Jeremy Hussell from the LANL Research Library for their support of this work.
References
- [Baeza-Yates and Ribeiro-Neto, 1999] Baeza-Yates, R. and Ribeiro-Neto, B. (1999). Modern Information Retrieval. Pearson Education, Harlow, England.
- [Barabási, 2002] Barabási, A.-L. (2002). Linked-The new science of networks. Perseus Publishing, Cambridge, MA.
- [Bharat and Henzinger, 1998] Bharat, K. and Henzinger, M. R. (1998). Improved algorithms for topic distillation in a hyperlinked environment. In Proceedings of SIGIR-98, 21st ACM International Conference on Research and Development in Information Retrieval, pages 104–111, Melbourne, AU.
- [Bonacich, 1972] Bonacich, P. (1972). Factoring and weighting approaches to status scores and clique identification. Journal of Mathematical Sociology, 2:113–120.
- [Calado et al., 2003] Calado, P. P., Gonçalves, M. A., Fox, E. A., Ribeiro-Neto, B., Laender, A. H. F., da Silva, A. S., Reis, D. C., Roberto, P. A., Vieira, M. V., and Lage, J. P. (2003). The web-dl environment for building digital libraries from the web. In JCDL ’03: Proceedings of the 3rd ACM/IEEE-CS joint conference on Digital libraries, pages 346–357. IEEE Computer Society.
- [Castro and Grossman, 1999] Castro, R. D. and Grossman, J. (1999). Famous trails to Paul Erdös. MATHINT: The Mathematical Intelligencer, 21:51 – 63.
- [Chakrabarti, 2003] Chakrabarti, S. (2003). Mining the web. Morgan Kaufmann Publishers.
- [Chen and Carr, 1999] Chen, C. and Carr, L. (1999). Trailblazing the literature of hypertext: author co-citation analysis (1989 - 1998). In Proceedings of the tenth ACM Conference on Hypertext and hypermedia : returning to our diverse roots, pages 51–60. ACM Press.
- [Cunningham, 2001] Cunningham, S. J. (2001). The birth of a discipline: an analysis of the 1994-2000 ACM digital libraries conferences. In Proceedings of 8th International Conference on Scientometrics and Informetrics, Sydney, Australia.
- [Cunningham and Dillon, 1997] Cunningham, S. J. and Dillon, S. (1997). Authorship patterns in information systems research. Scientometrics, 39(1):19 – 27.
- [Egghe et al., 2000] Egghe, L., Rousseau, R., and Van Hooydonk, G. (2000). Methods for accrediting publications to authors or countries: Consequences for evaluation studies. Journal of the American Society for Information Science and Technology, 51(2):145 – 157.
- [Esler and Nelson, 1998] Esler, S. L. and Nelson, M. L. (1998). Evolution of scientific and technical information distribution. Journal of the American Society of Information Science, 49:82–91.
- [Farkas et al., 2002] Farkas, I., Derenyi, I., Jeong, H., Neda, Z., Oltvai, Z. N., Ravasz, E., Schubert, A., Barabasi, A.-L., and T.Vicsek (2002). Networks in life: scaling properties and eigenvalue spectra. Physica A, 314:25 – 34.
- [Garfield, 1979] Garfield, E. (1979). Citation Indexing-Its Theory and Application in Science, Technology, and Humanities. John Wiley & Sons, New York, NY.
- [Haveliwala, 2003] Haveliwala, T. H. (2003). Topic-sensitive PageRank: A context-sensitive ranking algorithm for web search. IEEE Transactions on Knowledge and Data Engineering, 15(4):784–796.
- [He and Spink, 2002] He, S. and Spink, A. (2002). A comparison of foreign authorship distribution in jasist and the journal of documentation. Journal of the American Society for Information Science and Technology, 53(11):953–959.
- [Kamvar et al., 2003] Kamvar, S. D., Haveliwala, T. H., Manning, C. D., and Golub, G. H. (2003). Extrapolation methods for accelerating PageRank computations. In Proceedings of WWW 2003.
- [Kleinberg, 1999] Kleinberg, J. M. (1999). Authoritative sources in a hyperlinked environment. Journal of the ACM, 46(5):604–632.
- [Lempel and Moran, 2000] Lempel, R. and Moran, S. (2000). The stochastic approach for link-structure analysis (SALSA) and the TKC effect. Computer Networks (Amsterdam, Netherlands: 1999), 33(1–6):387–401.
- [Liu et al., 2004] Liu, X., Bollen, J., Nelson, M. L., Van de Sompel, H., Hussell, J., Luce, R., and Marks, L. (2004). Toolkits for visualizing co-authorship graphs. In Proceedings of the 2004 joint ACM/IEEE conference on Digital libraries, page 404.
- [Mutschke, 2001] Mutschke, P. (2001). Enhancing information retrieval in federated bibliographic data sources using author network based stratagems. In Proceedings of Reserach and Advanced Technology for Digital Libraries: 5th European Conference, ECDL 2001, Darmstadt, Germany, September 4-9, 2001, Lecture Notes in Computer Science; 2163, pages 287–299. Springer.
- [Nascimento et al., 2003] Nascimento, M. A., Sander, J., and Pound, J. (2003). Analysis of SIGMOD’s coauthorship graph. SIGMOD Record, 32(3).
- [Newman, 2001a] Newman, M. E. J. (2001a). Scientific collaboration networks: I. network construction and fundamental results. Physical Review E., 64:016131.
- [Newman, 2001b] Newman, M. E. J. (2001b). Scientific collaboration networks: II. shortest paths, weighted networks, and centrality. Physical Review E., 64:016132.
- [Newman, 2003] Newman, M. E. J. (2003). A measure of betweenness centrality based on random walks. Technical Report cond-mat/0309045, arXiv.
- [Newman, 2004] Newman, M. E. J. (2004). Analysis of weighted networks. Physical Review E., 70:056131.
- [Otte and Rousseau, 2002] Otte, E. and Rousseau, R. (2002). Social network analysis: a powerful strategy, also for the information sciences. Journal of Information Science, 28(6):441–453.
- [Page and Brin, 1998] Page, L. and Brin, S. (1998). The anatomy of a large-scale hypertextual web search engine. In Proceedings of the Seventh International World-Wide Web Conference.
- [Page et al., 1998] Page, L., Brin, S., Motwani, R., and Winograd, T. (1998). The PageRank citation ranking: Bringing order to the web. Technical report, Stanford Digital Library Technologies Project.
- [Sankaralingam et al., 2003] Sankaralingam, K., Yalamanchi, M., Sethumadhavan, S., and Browne, J. C. (2003). PageRank computation and keyword search on distributed systems and P2P networks. Journal of Grid Computing, 1(3):291–307.
- [Scott, 2000] Scott, J. (2000). Social Network Analysis: A Handbook. Sage Publications, London.
- [Smeaton et al., 2002] Smeaton, A. F., Keogh, G., Gurrin, C., McDonald, K., and Sodring, T. (2002). Analysis of papers from twenty-five years of SIGIR conferences: What have we been doing for the last quarter of a century. SIGIR Forum, 36(2).
- [Tjaden, 2003] Tjaden, B. (2003). The Oracle of Bacon. Technical report.
- [Wagner and Leydesdorff, 2003] Wagner, C. S. and Leydesdorff, L. (2003). Mapping global science using international co-authorships: a comparison of 1990 and 2000. In Proceedings of Ninth International Conference on Scientometrics and Informetrics, Beijing.
- [Wang and DeWitt, 2004] Wang, Y. and DeWitt, D. J. (2004). Computing PageRank in a distributed internet search system. In Proceedings of the 30th International Conference on Very Large Data Bases, pages 420–431.
- [Wasserman and Faust, 1994] Wasserman, S. and Faust, K. (1994). Social Network Analysis: Methods and Applications. Cambridge University Press.
- [Watts, 2001] Watts, D. (2001). Small Worlds: The Dynamics of Networks Between Order and Randomness. Princeton University Press.