Correlated dynamics in human printing behavior
Abstract
Arrival times of requests to print in a student laboratory were analyzed. Inter-arrival times between subsequent requests follow a universal scaling law relating time intervals and the size of the request, indicating a scale invariant dynamics with respect to the size. The cumulative distribution of file sizes is well-described by a modified power law often seen in non-equilibrium critical systems. For each user, waiting times between their individual requests show long range dependence and are broadly distributed from seconds to weeks. All results are incompatible with Poisson models, and may provide evidence of critical dynamics associated with voluntary thought processes in the brain.
pacs:
89.75.-k, 89.75.Da, 02.50.E, 05.40.-aSince the early work of Berger and Mandelbrot Berger and Mandelbrot (1963) examining error clustering in telephone circuits, it has been recognized that standard Poisson models may be inadequate to describe electronic information networks. This was confirmed, for instance by Leland et al. E. Leland et al. (1994), who studied network traffic and found that packet traces show scaling behavior. Observations of scaling behavior raise a number of questions about how to model these systems, optimize performance, or improve design. Significant effects include an increase in response times, required buffer sizes, etc. In Ref. Field et al. (2004) the authors show how the file size distribution of a web server effects the resulting network traffic. Large fluctuations (which are inherent in critical systems) in packet traffic or demand for resources in computer networks can significantly degrade worst case performance Huberman and Lukose (1997). Scaling behavior has been found not only in the size distribution of files stored in computer systems Irlam , and the sizes of web server requests Crovella and Bestavros (1997), but also in the physical structure of the internet Faloutsos et al. (1999) and the hyper-link structure of the world-wide web Albert and Barabasi (2002); Bornholdt and Schuster (2002). So far, no definitive causes have been established for the complexity of the modern information network. Of course, humans interact when they build the internet, make hyper-link connections, and send and receive information. Like traffic jams Nagel and Paczuski (1995) on roads, internet jams are produced by humans who act and react, often in response to information originating within the network or outside it. Various parts of the information network/user system are themselves complex systems, and one of the problems in modeling modern information networks is how to disentangle these effects.
One recognizes that psychological experiments have demonstrated that correlated dynamics occurs in individual human behavior Kniffki et al. (1993); Canessa and Calmetta (1994); Dünki and Ambühl (1996); Gottschalk et al. (1995); Paulus and Braff (2003), even in situations where interactions with other humans are minimal Chen et al. (1997); Gilden et al. (1995); van Orden et al. (2003). For instance, Ref. Gilden et al. (1995) describes an experiment where subjects had to estimate the duration of time intervals from memory. The time series of errors in the estimates exhibits a power spectrum, showing that the errors are correlated in time. In contrast, the sequence of reaction times to an event showed no long range correlation. The authors proposed that long range dependence is associated with voluntary thought processes in the brain Gilden et al. (1995). Similar observations were made for the dynamics of moods Gottschalk et al. (1995) and psychotic states. For instance the distribution of time intervals between subsequent hospitalizations for schizophrenia is approximately power-law Dünki and Ambühl (1996). A physical basis for these behaviors may be related to scale-free functional networks in the brain, which have recently been observed in situ Sporns et al. (2004).
In order to better describe individual human behavior in a networked computing environment, we study a simple case where the use or demand is primarily associated with individual choice rather than with group dynamics. The particular quantity we focus on is the inter-arrival times between subsequent print requests made by users in a computing laboratory for university students. We find evidence of long range correlations in the inter-arrival times for individual users to send requests, as well as a broad distribution of inter-arrival times. The totality of print requests from all users reveals a scaling law relating inter-arrival times and the sizes of the print request. This law indicates that the same (re-scaled) dynamics is responsible for requests to print small and large documents. This law is similar to that recently observed for waiting times between successive earthquakes Bak et al. (2002); Corral (2003); Davidsen and Goltz (2004) or solar flares Baiesi et al. (2004). The scaling function for the re-scaled inter-arrival times is approximately log-normal. The cumulative distribution of the sizes of print requests is well-described by a modified power law, which is referred to as the distribution of superstatistics Beck and Cohen (2003); Beck (2001), or the q-exponential of non extensive statistical mechanics Tsallis (1998); Wilk and Wlodarczyk (2000). An elementary stochastic process is studied that reproduces some, but not all, of the observed features. Our results are supportive of the hypothesis that the brain operates at or near a self-organized critical state Chialvo and Bak (1999). It also suggests the possibility of using data collected via the modern information network to systematically investigate models of human behavior.
The Department of Computing at Imperial College London maintains a networked printing system for staff and students. The student labs offer about 300 computer work spaces, and are divided into different rooms, the largest one accommodating up to 150 students. The printers are networked and accessible from any machine in the department. A user selects a printer and submits her print job to a central server. The server records the time a request is submitted with a resolution of one second. It also records the size of the request, the user name and the intended printer. This investigation focuses on requests sent to the printer, chrome, that is located in the largest room. The labs are closed between 23:00 and 7:00, but users can print during closure times when logged in remotely. The data used here include the entire year of 2003 and closure times have been included in the analysis. Table 1 gives relevant parameters for the data set studied, which can be accessed at Harder and Paczuski (2003).
| number of users | 1122 |
| number of users issuing | |
| more than three requests | 1001 |
| number of requests per year | 73853 |
| mean document size | 1.2 Mbytes |
| mean time between requests | 7.1 min |
| minimum time resolution | 1.0 sec |
We first analyze the distribution of inter-arrival times between subsequent print requests for the entire year. Time differences from the logged event times are measured as
| (1) |
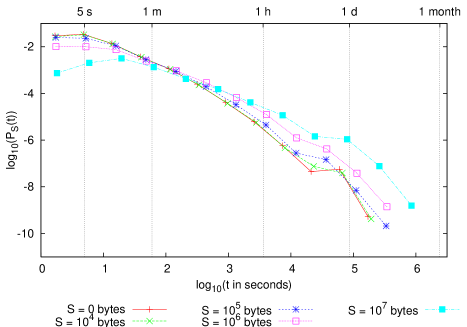
The superscript refers to the size of the print request in bytes and indicates that this set of times only includes requests that are larger than . The quantity is the number of print requests that are larger than . Time intervals of length zero are neglected from the analysis. For each chosen threshold we estimate , which is the probability of a certain time interval between subsequent requests of size or larger. To display this distribution we count the number of time differences in exponentially growing bins and normalize the count by the bin size. Fig. 1 shows that the shape of the waiting time distribution depends on the size threshold, , of the documents. This could indicate different dynamical processes responsible for the small and large documents. However, all distributions are broad and show an anomaly near one day. The anomaly is related to the overnight closure of the labs.
To determine if a different dynamics is responsible for requests of different sizes, we implement a scaling argument similar to one recently put forward by Bak et al Bak et al. (2002) to describe the waiting time statistics of earthquakes. The average time between requests may provide a rescaling factor for the inter-arrival times, so that the distributions measured with different size thresholds, , collapse onto a single scaling function. Of course, . Here is the time span of the record and is the rate of requests larger than . is the cumulative number of requests larger than size . As shown in the inset of Fig. 2, is well described by a modified power law Beck and Cohen (2003); Beck (2001); Tsallis (1998); Wilk and Wlodarczyk (2000):
| (2) |
where and .
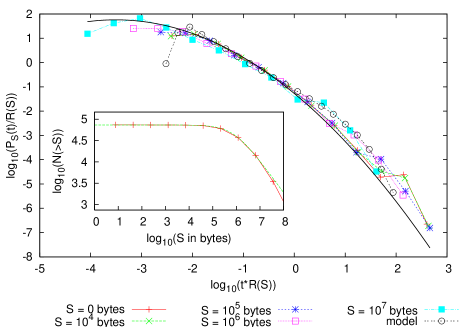
We test the ansatz
| (3) |
where is a scaling function and is a scaling variable. Fig. 2 shows the results of rescaling the different curves in Fig. 1 by their average rate. We see that the scaling ansatz of Eq. 3 appears to hold over a wide range, about seven orders of magnitude in the scaling variable. This indicates that the same scale invariant dynamics operates when users send requests of any size. The slight deviation from data collapse at short times is due to the finite temporal resolution of our data (one second). There is an additional deviation due to the diurnal period. The scaling function is close to a log-normal distribution:
| (4) |
with and , as also shown in Fig. 2. This feature is also found in numerical simulations of a stochastic process described later.
The inter-arrival times for all users do not necessarily give a good estimate for the times that pass between subsequent requests issued by a single user. To this end we study the inter-arrival times for each user printing more than three documents over the one year period. In the discussion below we set the threshold .
| (5) |
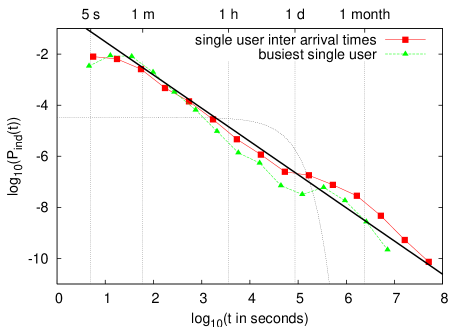
Each user’s list of inter-arrival times is concatenated to determine the probability of single user inter-arrival times, shown in Fig. 3. This distribution is approximately a power law over several decades ranging from one minute to about a day, with an exponent . We also analyze the inter-arrival times for the busiest single user, which is similar. For comparison we show in Fig. 3 an exponential distribution for a Poisson event process that has the same average rate, , as the process of the busiest single user. A critical system with a power-law distribution of intervals is a more accurate description of the data than a Poisson model of print requests.
To decide if inter-arrival times are correlated, we measured the auto correlation function of waiting times for single users. The autocorrelation at lag step is defined as
| (6) |
where . If the inter-arrival times are uncorrelated and independent, the arrival process of individual requests to print can be modeled as a fractal renewal process Paczuski et al. (1994); Lowen and Teich (1993). Analyzing data separately for the three most busy users, we find that the auto correlation function decays as with . When the order of the inter-arrival times for an individual user are shuffled randomly this power law disappears, and the waiting times become uncorrelated, with independent of for . The sequence of inter-arrival times for individual users are correlated over the entire time span of our data set.
Our data shows that models of criticality are relevant for describing individual human behavior in the modern information network. Lacking, at present, a microscopic dynamical model, we compare our observations with results from a simple stochastic process. Consider arrival streams of print requests. In each stream, time intervals between subsequent requests are independent random variables chosen from a truncated Pareto distribution. We neglect correlations between intervals. All intervals have the same probability distribution
| (7) |
where and are the points where the Pareto distribution is truncated and is a normalization constant. We choose the parameter motivated by the results in Fig. 3. The short time cut-off sec is set to reflect the fact that in some application users must wait before a subsequent print job can be sent off. Most students leave after at most 8 years, so years appears to be a reasonable choice. Generating approximately 73,000 requests in a year fixes the number of users close to .
At the start of the numerical simulation we schedule an arrival event for each stream according to Eq. 7. Upon each arrival, the next arrival time is scheduled using the same distribution. The system takes about 5 years with the above parameters to reach a statistically stationary state. As shown in Fig. 2, the inter arrival times measured in the simulation compare fairly well with the real data. However the real data has significantly larger variance.
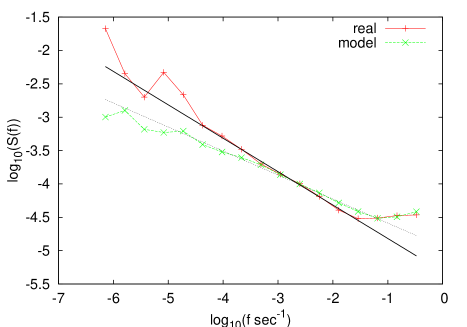
We also examined the time series defined by the number of print requests in each second. We calculated the power spectrum of this time series and find behavior, as shown in Fig. 4. The exponent observed in the numerical simulation is fixed by the value of in Eq. 7, and is Paczuski et al. (1996); Lowen and Teich (1993). The real data show instead a larger value , which indicates, just as the auto-correlation function , that the real arrival process is more complicated than a fractal renewal process. A more accurate model of individual user behavior in a computing network may be that of Davidsen and Schuster Davidsen and Schuster (2002).
The authors thank the Computer Support Group of the Department of Computing at Imperial College, especially T. Southerwood, for making the data available to us. M.P. thanks J. Davidsen, A.L. Stella, and P. Grassberger for conversations. U.H. would like to thank A. Argent-Katwala, T. Field and W. Knottenbelt for interesting discussions and suggestions. U.H. is funded by EPSRC (research grant PASTRAMI, GR/S24961/01)
References
- Berger and Mandelbrot (1963) J. Berger and B. Mandelbrot, IBM J. Res. Dev. 7, 224 (1963).
- E. Leland et al. (1994) W. E. Leland, M. Taqqu, W. Willinger, and D. Wilson, IEEE/ACM Transactions on Networking 2, 1 (1994).
- Field et al. (2004) A. Field, U. Harder, and P. Harrison, Performance Evaluation 58, 243 (2004).
- Huberman and Lukose (1997) B. A. Huberman and R. M. Lukose, Science 277, 535 (1997).
- (5) G. Irlam, http://www.base.com/gordoni/ufs93.html.
- Crovella and Bestavros (1997) M. E. Crovella and A. Bestavros, IEEE/ACM Transactions on Networking 5, 835 (1997).
- Faloutsos et al. (1999) M. Faloutsos, P. Faloutsos, and C. Faloutsos, Proc. ACM SIGCOMM, Comput. Commun. Rev. 29, 251 (1999).
- Albert and Barabasi (2002) R. Albert and A.-L. Barabasi, Rev. Mod. Phys. 74, 47 (2002).
- Bornholdt and Schuster (2002) S. Bornholdt and H. G. Schuster, eds., Handbook of Graphs and Networks (Wiley-VCH, 2002).
- Nagel and Paczuski (1995) K. Nagel and M. Paczuski, Phys. Rev. E 51, 2909 (1995).
- Kniffki et al. (1993) K.-D. Kniffki, W. Mandel, and P. Tran-Gia, Fractals 1:380-387 (1993).
- Canessa and Calmetta (1994) E. Canessa and A. Calmetta, Phys. Rev. E 50 (1994).
- Dünki and Ambühl (1996) R. M. Dünki and B. Ambühl, Physica A 230, 544 (1996).
- Gottschalk et al. (1995) A. Gottschalk, M. Bauer, and P. Whybrow, Arch. Gen. Psychiatry 52, 947 (1995).
- Paulus and Braff (2003) M. Paulus and D. Braff, Biol. Psychiatry 54, 3 (2003).
- Chen et al. (1997) Y. Chen, M. Ding, and J. A. S. Kelso, Phys. Rev. Lett. 79, 4501 (1997).
- Gilden et al. (1995) D. L. Gilden, T. Thornton, and M. W. Mallon, Science 267, 1837 (1995).
- van Orden et al. (2003) G. van Orden, J. Holden, and M. Turvey, Journal of Experimental Psychology - General 3, 331 (2003).
- Sporns et al. (2004) O. Sporns, D. Chialvo, M. Kaiser, and C. Hilgetag, Trends Cogn. Sci. 8, 418 (2004).
- Bak et al. (2002) P. Bak, K. Christensen, L. Danon, and T. Scanlon, Phys. Rev. Lett. 88, 178501 (2002).
- Corral (2003) A. Corral, Phys. Rev. E 68, 035102(R) (2003).
- Davidsen and Goltz (2004) J. Davidsen and C. Goltz, Geophys. Res. Lett. 31, L21612 (2004).
- Baiesi et al. (2004) M. Baiesi, M. Paczuski, and A. L. Stella (2004), e-print cond-mat/0411342.
- Beck and Cohen (2003) C. Beck and E. Cohen, Physica A 322, 267 (2003).
- Beck (2001) C. Beck, Phys. Rev. Lett. 87, 180601 (2001).
- Tsallis (1998) C. Tsallis, J. Stat. Phys. 52, 479 (1998).
- Wilk and Wlodarczyk (2000) G. Wilk and Z. Wlodarczyk, Phys. Rev. Lett. 84, 2770 (2000).
- Chialvo and Bak (1999) D. R. Chialvo and P. Bak, Neuroscience 90, 1137 (1999).
- Harder and Paczuski (2003) U. Harder and M. Paczuski, http://www.doc.ic.ac.uk/~uh/PASTRAMI/Printer/data (2003).
- Paczuski et al. (1994) M. Paczuski, S. Maslov, and P. Bak, Europhys. Lett. 28, 295 (1994).
- Lowen and Teich (1993) S. B. Lowen and M. C. Teich, IEEE Trans. Inform. Theory 39, 1669 (1993).
- Paczuski et al. (1996) M. Paczuski, S. Maslov, and P. Bak, Phys. Rev. E 53, 414 (1996).
- Davidsen and Schuster (2002) J. Davidsen and H. Schuster, Phys. Rev. E 65, 026120 (2002).