Interactive visualization of higher dimensional data in a multiview environment
Abstract
We develop multiple view visualization of higher dimensional data. Our work was chiefly motivated by the need to extract insight from four dimensional Quantum Chromodynamic (QCD) data. We develop visualization where multiple views, generally views of 3D projections or slices of a higher dimensional data, are tightly coupled not only by their specific order but also by a view synchronizing interaction style, and an internally defined interaction language. The tight coupling of the different views allows a fast and well-coordinated exploration of the data. In particular, the visualization allowed us to easily make consistency checks of the 4D QCD data and to infer the correctness of particle properties calculations. The software developed was also successfully applied in material studies, in particular studies of meteorite properties. Our implementation uses the VTK API. To handle a large number of views (slices/projections) and to still maintain good resolution, we use IBM T221 display ( X pixels).
keywords:
Multiple view, interactive visualization, Quantum Chromodynamic, exploratory visualization, VTK, IBM T221 display.1 Introduction
Our goal is to visually analyze and extract insight from higher dimensional data. Also, in order to capture important details in the data, we seek to examine the full data, or at least as much as possible. To this end we employ (1) interactive, (2) tightly coupled, (3) multiview visualization to a (4) high-resolution flat panel.
One of our applications is visualization of Quantum Chromodynamic (QCD) data. QCD is the theory that describes quarks, the smallest building blocks of matter according to the current theory, and gluons, the particles that quarks exchange. Quarks are permanently bound together by a force due to the exchange of gluons. To test the QCD theory, large supercomputers have been built to simulate what QCD will predict for physical parameters such as particle masses. The predictions can then be compared against experiments to check the reliability of the theory. The QCDSP computers at Columbia University and the RIKEN-BNL Research Center total 20,000 processors and are in full-time use for QCD simulations. The simulations are done on D hyper-cube grid (discretization of space and time into a lattice). The D data has to be analyzed for consistency and for correctness of the particle properties calculations.
Another application is in material studies. In particular, we study meteorites’ porosities, the presence and location of high attenuation cores, etc. To better understand the data we use interactive synchronized views of the 3D meteorite data. For example, these are views of the volume visualization of the meteorites’ porous space, high-attenuation cores, volume visualization of the entire data, cutting planes, and isosurfaces (see Section 3, Figures 2 and 3).
There are several approaches to visualize higher dimensional data. The most popular are parallel coordinates, slicing, and projections. Parallel Coordinates is a method of displaying multivariate data [7]. Given an N-dimensional data set, N vertical axes are created. Each data point is represented as a polyline spanning all N axes. This is very useful for data sets of large dimension as several variables can be tracked at once. The slicing approach used in [2, 13, 6] fixes one dimension or generates an animation to visit all values. The projection approach [9, 1, 5] projects all data points onto a lower dimensional plane where their structure can be viewed and manipulated. User interfaces for manipulating the projections are defined in [4].
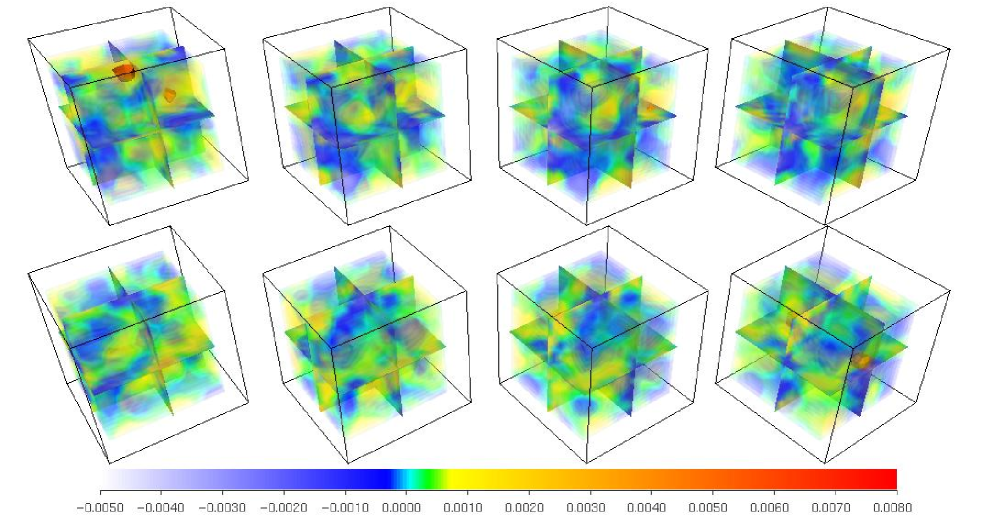
Our approach, as mentioned above, is to interactively visualize the full data, or at least as much as possible. For data in higher than 3 dimension, for example the QCD 4D data, we reduce the dimension by projecting or slicing the data to 3D and displaying multiple views of the tightly coupled projections (or slices). The interactions are synchronized and yield an easy and thorough view of the data. An internally defined language allows the user to dynamically change view parameters and content. For example, Figure 1 shows the tightly coupled visualization of 8 consecutive time slices of QCD data. We see a volume visualization of the slices and, in this case, user added cutting planes, bounding boxes, color bar, and isosurfaces. For 3D data, for example as in the meteorites’ study, an internally defined language allows the user to dynamically add views and change their view parameters and content. The implementation is in C++. We use the VTK [10, 11] API. Our graphical user interface (GUI) uses VTK’s interactors, interaction styles that we developed, internally defined query language, and Tcl/Tk. To handle many slices and still keep a high-resolution we use a IBM T221 display, which maintains X pixels.
The rest of this paper is organized as follows. In Section 2 we give our multiview model and give some implementation details. Section 3 summarizes the visualization results and the benefits from applying our multiview model. The results are explained within the QCD’s and meteorite’s applications. Section 4 discusses some of our current work on extensions relevant to multiview visualization and ideas for future work. Finally, in Section 5, we give the conclusions of the studies presented.
2 The multiview model and its implementation
We described briefly our multiview visualization model/approach in the introduction (Section 1). In this section we present in more detail its main features:
-
•
Different interaction styles (Section 2.1).
-
•
Internally defined interaction language (Section 2.2).
-
•
Multiple views (Section 2.3).
We also give some implementation details in Section 2.4.
2.1 Interaction styles
We use the VTK’s vtkInteractorStyle class and its subclasses. The subclasses provide diverse styles of mouse interaction: joystick/trackball and camera/object. In camera mode for example, mouse events affect the camera position and focal point, and hence all views in the current scene. In object mode, the user can pick an object and manipulate it separately from the others in the scene. The interaction styles are changed with key strokes. Another useful feature is key binding that allows the user to toggle the render window into and out of stereo mode. More information about the interaction styles can be found in [10, 11] or in online user manuals.
We implemented another subclass of vtkInteractorStyle, called vtkInteractorStyleActor. In a standard VTK object mode interaction, the mouse affects the object that is under the mouse pointer. Here all the scene objects are affected, yielding a simultaneous synchronized view of the objects from the same angle (see Section 2.4).
2.2 Internal interaction language
We have internally defined an interaction language that allows the user to dynamically change view parameters and view content. The language controls view parameters such as object properties, color tables (including multiple color palettes), opacity scheme, background, etc. The editing of the viewing content includes adding/removing of views and objects in these views. The positions of the views are controlled by the user. Objects that can be added/removed from a view are volumes, isosurfaces, cutting and viewing planes, colorbars, histograms, etc. We have added to the language several filters that are specific to our data and visualization problems. Also, the language provides commands that facilitate the creation of user defined animations.
2.3 Multiple views
Our model provides capability for multiple views. User’s needs, intent, and implemented interaction model determine and give control over the visualization content. The content may be obtained from the high dimensional data through (1) different user defined projections, see for example [8], (2) slicing of the high dimensional data, or (3) different views of the same 3D data. We provide “dimension reduction through projections” by VTK’s filtering capabilities, which are included in our internally defined interaction language. VTK’s pipeline execution model makes the projection implementation simple and efficient. Slicing, which we use in the analysis of the QCD data, is automated to the point where the user specifies a sequence of slices to be displayed. Different views of the same 3D data are applied in our meteorite studies (see Section 3).
2.4 Implementation
As mentioned before, the implementation is in C++ and uses the VTK API. Our vtkInteractorStyleActor is a subclass of the VTK’s vtkInteractorStyle. vtkInteractorStyle has a pointer to the current renderer, from which we get the collections of all the actors and volumes in the scene. Instead of manipulating one object, as in the object style interaction, we make a loop and manipulate all the actors and volumes in the current scene.
The internal language interaction is implemented trough the “u Keypress” of the interaction style. Pressing “u” with active visualization window invokes a user defined function. The user can type single commands or pass scripts of the internally defined interaction language.
Different views are implemented by simply applying proper AddPosition and SetOrigin to the actors and volumes that have to be visualized in the views. AddPosition gives an initial translation, in our case performed in the plane, of the new objects. SetOrigin fixes the center for rotations that may follow, in our case set to be the center of bounding box for the new object.
3 Visualization results
We visualized and analyzed two sets of QCD data. The first one is of topological charge density. Figure 1 shows a multiview visualization of such data. The picture is for 4D lattice of size X X X . Shown is the volume visualization of slices for . The ordering is from left to right, top to bottom. Using the internally defined visualization language we have added cutting planes through the center of the volumes. Also, there is one iso-surface marking density . In this case the visualization allowed us to easily make consistency checks of the 4D QCD. The other set of data that we used is for particle propagation. In particular, we visualized the propagation of pion, the lightest bound state of two quarks. The calculation of the pion propagator was performed on a X X X lattice. The theoretical results were visually analyzed and shown to have the correct physical behavior.
We also used the tool developed to visualize and analyze sets of meteorite data. The data was produced using synchrotron-based computed microtomography (CMT) at the Brookhaven National Synchrotron Light Source. This study approach, in contrast to daunting experimental efforts to analyze through grinding through the meteorites a few micrometers at a time [3], is much easier. It needs visualization to study the presence and location of high attenuation cores and low attenuation pores. Different attenuations are mapped and reveal the presence of different metals in the meteorites.
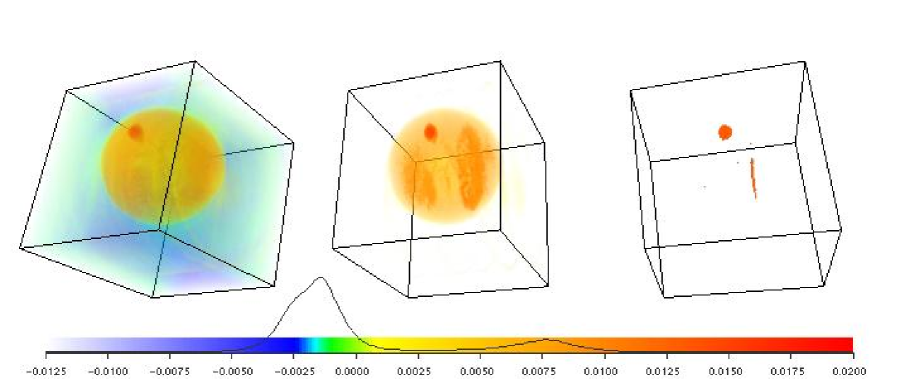
Figure 2 shows views of a meteorite. From left to right we show: (1) volume visualization of the whole data; (2) volume visualization of range ..; and (3) volume visualization of range ... To determine the ranges we use the color bar and the histogram, which can also be seen on Figure 2. The first peak is for the empty space around the meteorite. To skip it from the visualization and see only the core we visualize range .. in (2). One can see clustering of high-attenuation values within the meteorite’s core. Finally we show only the high-attenuation volume, which is after the second peak, i.e. range ...
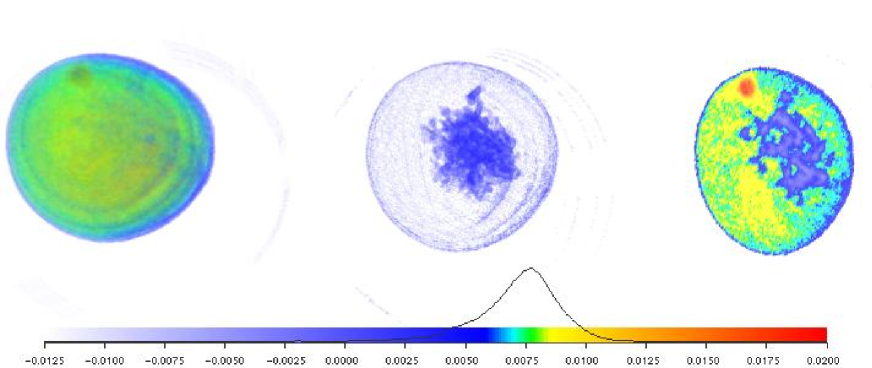
It is also interesting to study the porous space. Figure 3 shows the porous space for the meteorite from Figure 2. First we filtered out the attenuations less than (as being air). See that the histogram now does not have the air peak. We have from left to right: (1) volume visualization of the filtered data; (2) volume visualization of range .. (this should be the porous space); (3) a slice through the center of the high-attenuation core which reveals its position relevant to the pores and the meteorite’s core.
4 Extensions and future work
We are currently working on improving the speed of the multiview visualization environment presented. Adding new views increases the scene to be rendered and becomes a speed bottleneck for the interactive visualization. We are looking into parallel methods to improve the speed and increase the data size to be handled. The task of multiview visualization is trivial to parallelize. We apply the idea from [12] to extend this project to support parallel rendering on commodity-based clusters. We are interested in both tiled displays and high-resolution flat panels.
5 Conclusions
We have developed a multiview interactive visualization for high dimensional data. The functionality of the model was motivated by our need to study QCD and meteorite data. The software and its functionality were tested on this data. As a result we were able to extract insight from the data considered. In particular, the visualization allowed us to easily make consistency checks of the 4D QCD data and to infer the correctness of particle properties calculations. In the meteorite studies we inferred properties about the porous space and high-attenuation cores, which may help in theories of how the meteorites were oxidized while entering the Earth’s atmosphere.
Acknowledgments. We would like to thank Robert Mawhinney, Cheng-Zhoung Sui, Kostas Orginos, Shigemi Ohta, and Chris Dawson from the RIKEN BNL Research center, and Keith Jones from the BNL’s Environmental Research and Technology Division for the discussions with them and for providing the QCD and meteorites’ data. The pion propagation calculation was performed on the QCDSP RIKEN-BNL-Columbia Supercomputer, the meteorites’ data was produced by using synchrotron-based computed microtomography at the Brookhaven National Synchrotron Light Source, and the visualization was developed at the BNL Visualization facility.
References
- [1] D. Andrews, Plots of high-dimensional data, Biometrics 28 (1972), 125.
- [2] D. Asimov, The grand tour: A tool for viewing multidimensional data, SIAM Journal on Scientific and Statistical Computing 6, 1 (1985) 128.
- [3] P. Bonte, C. Jehanno, M. Maurette, D. Brownlee, Platinum metals and mictostructure in magnetic deep sea cosmic spherules, Proceedings of Lunar and Planetary Science Conf. 17th, J. Geophys. Res. 92, E641-E648.
- [4] K. Duffin and W. Barrett, Spiders: A new user interface for rotation and visualization of n-dimensional point sets, Proceedings of the Conference on Visualization Los Alamitos CA (1994) 205.
- [5] A. Hanson and P. Heng, Four dimensional views of 3D scalar fields, Proceedings of IEEE Visualization 92 (1992) 84.
- [6] W. Hibbard, I. Foster, R. Jacob, C. Schafer, and M. Tyree, Exploring coupled atmosphere-ocean models using Vis5D, The International Journal of Supercomputer Applications and High Performance Computing 10 (1996), 211.
- [7] A. Inselberg and B. Dimsdale, Parallel coordinates: a tool for visualizing multi-dimensional geometry, Proceedings of Visualization ’90, pp. 361 – 378.
- [8] M. McGuigan, G. Smith, and S. Ohta, Visualization of Four Dimensional Quantum Chromodynamic Data, Proceedings of Visualization Development Environments 2000.
- [9] M. Noll, A computer technique for displaying n-dimensional hyperobjects, Communications of the ACM 10, 8 (1967), 469.
- [10] W. Schroeder, K.Martin, L.Avila, C. Law The Visualization Toolkit User’s Guide, Kitware, Inc.
- [11] W. Schroeder, K.Martin, B.Lorensen, The Visualization Toolkit: An Object-Oriented Approach to D Graphics, Prentice-Hall PTR.
-
[12]
S. Tomov, R. Bennett, M. McGuigan, A. Peskin, G. Smith, J. Spiletic,
Developing Interactive Parallel Visualization for Commodity-Based
Clusters,
IEEE Supercomputing 2002, Baltimore, MD, Internet address
(accessed on 02/2003):
http://www.acl.lanl.gov/ccviz02/ - [13] J.J. Van Wijk and R. Van Liere, Extracting iso-valued features in 4-dimensional scalar fields, Proceedings of IEEE Visualization 93 (1993).