On the universality of rank distributions of website popularity
Abstract
We present an extensive analysis of long-term statistics of the queries to websites using logs collected on several web caches in Russian academic networks and on US IRCache caches. We check the sensitivity of the statistics to several parameters: (1) duration of data collection, (2) geographical location of the cache server collecting data, and (3) the year of data collection. We propose a two-parameter modification of the Zipf law and interpret the parameters. We find that the rank distribution of websites is stable when approximated by the modified Zipf law. We suggest that website popularity may be a universal property of Internet.
keywords:
Internet, Web traffic, Rank Distribution, Zipf LawPACS:
89.20.Hh World Wide Web, Internet - 89.75.Da Systems being scaling laws, , ††thanks: Present adress: Institute of Information Science, RRC Kurchatov Institute, 1 Kurchatov sq., Moscow, 123182, Russia
1 Introduction
It has been known for a decade that web-document popularity follows the Zipf law [1]. Nevertheless, the exponent values reported by different authors vary significantly, from 0.60 to 1.03 [1, 2, 3, 4] (see Table LABEL:Datasets). We believe that the scattering of the reported values is due to the small sample size in some cases and to the details of the fitting procedure used to extract the exponent.
In this paper, we propose that the rank distribution of the websites follows the Zipf law and give arguments supporting our idea. We must note that website statistics are more extensive than web-document statistics, and the distribution parameters can be obtained with higher accuracy.
We address the following questions: Is the rank distribution of websites Zipf-like? If yes, what are the conditions under which the “true” exponent can be obtained? Does the exponent depend on the duration of the observation? Or on the geographical position of the observer? And does the exponent vary with time, as the Internet develops?
We report some answers to these questions. We have studied website statistics, which are indeed more stable than web-document statistics. We have analyzed log files accumulated on cache servers of Russian academic networks (FREEnet, RASnet, and RSSI) for about six years. These networks differ by their connectivity topology and bandwidth, both national and international. These cache servers have different geographical locations (Moscow, Moscow region, and Yaroslavl in Russia). In addition, we analyzed some statistics collected during seven weeks in the fall of 2004 at a number of IRCache servers in the United States (see Table LABEL:table-setUS).
We found that the statistics studied become stable111The accuracy of the exponent becomes a few percent, e.g., 5%. when the number of queries for the given statistics exceeds . It is therefore meaningful to fit only those data for which the number of queries exceeds this value. This simple criterion can be used to estimate the critical window for the rank interval where the distribution is stable and the power law can be observed.
We found that the statistics are independent of the geographical location of the cache server (observer) collecting the data, at least for the analyzed data sets.
We found that the distribution is independent of the different years of data collection and is therefore stable over Internet history and development.
Nevertheless, we found that the Zipf-like law approximation is suitable only in the middle region of several orders of rank magnitude. We propose a modification of the Zipf-like law with two additional parameters and explain its possible meaning. We found that if we fit the equation of the modified law to the data, the website popularity distribution becomes quite stable. The value of the exponent is for all datasets studied in this paper. We thus may suggest that website popularity follows the Zipf law.
We verified that the same modification also works perfectly for the web-document ranked distribution.
2 Power laws in nature and society
More than 100 years ago, Pareto [5] observed that the income distribution in all countries can be described by the relation
| (1) |
where the exponent and is some constant. About 70 years ago, George Zipf [6] discovered a striking regularity in English texts: the relative occurrence frequency of the th most popular word is inversely proportional to the rank :
| (2) |
A more general form of Zipf law (2) with the exponent is often encountered in the literature and is known as a Zipf-like law:
| (3) |
A Zipf-like law has been found in many areas of human activity and in nature. Among examples are the distribution of words in random texts [7], of nucleotide “words” in DNA [8, 9], of bit sequences in UNIX executable files [8], of book popularities in libraries [6, 10], of countries’ areas and population sizes [6, 14, 15], of scientific publication citation indices [16], of forest-fire areas [17]. Many other examples can be found in recent reviews [18, 19].
Meanwhile, there are many discussions whether a lognormal or power law is a better fit for some empirical distributions, for example, income distribution, population fluctuations, file size distribution, and some others (for a short review, see [19]). In many cases a lognormal distribution looks like a power law distribution for a several orders of magnitude [19, 20]. We leave this question open and analyse our data using a Zipf-like law.
| Dataset | Date | # of | # of | Ref. | |
|---|---|---|---|---|---|
| (Period) | requests | pages | |||
| DEC | 1994 | 100k | 1 | [1] | |
| BU | Jan95(42d) | 575775 | 54438 | 0.99 | [23] |
| BU | 1998 | 66988 | 41049 | 0.65 | [24] |
| DEC | Jul96(6d) | 3543968 | 1354996 | 0.77 | [25] |
| NLANR.RTP | Jun99(13d) | 9113027 | 3249549 | 0.71 | [25] |
| NLANR.SD | Jun99(13d) | 9082461 | 3549609 | 0.72 | [25] |
| NLANR.UC | Jun99(13d) | 8983585 | 2459366 | 0.66 | [25] |
| USASK | Oct98(82d) | 20754720 | 5527667 | 0.76 | [26] |
| CANARIE | Dec98(26d) | 35129680 | 1423081 | 0.63 | [26] |
| NLANR.UC | Dec98(31d) | 20018680 | 7681214 | 0.65 | [26] |
| USASK | Feb99(45d) | 21070330 | 5510561 | 0.84 | [28] |
| CANARIE | Feb99(45d) | 7310038 | 4571539 | 0.77 | [28] |
| NLANR.UC | Feb99(30d) | 24560611 | 8482661 | 0.74 | [28] |
| NLANR.LJ | 1998 | 500k | 0.64 | [29] | |
| UPisa | 1998 | 500k | 0.91 | [29] | |
| FUNET | 1998 | 500k | 0.70 | [29] | |
| SPAIN | 1998 | 500k | 0.72 | [29] | |
| RMPLC | 1998 | 500k | 0.86 | [29] | |
| BU-CS | Oct95(14d) | 80518 | 4471 | 0.85 | [30] |
| Hitachi | 1997(16d) | 2000000 | 0.75 | [31] | |
| DEC | Aug96(7d) | 3543968 | 0.77 | [2] | |
| UCB | Nov96(18d) | 1907762 | 0.78 | [2] | |
| UPisa | (3m) | 2833624 | 0.83 | [2] | |
| Questnet | Jan98(7d) | 2885285 | 0.69 | [2] | |
| NLANR | Dec97(1d) | 1766409 | 0.73 | [2] | |
| FUNET | Jun98(10d) | 4815551 | 0.64 | [2] | |
| HGMP | Jan98(7m) | 750k | 0.60 | [2] | |
| WebTV | Sep00(16d) | 347460865 | 32541361 | 1.03 | [3] |
It is widely assumed that web document popularity follows a Zipf-like law. We summarized all published results in Table LABEL:Datasets with the dataset name, the date and period of log files in days (d) or months (m), the number of requests, the number of unique web pages requested, and the reported value of the exponent .222Some papers do not provide all the information (e.g., the number of unique pages) for the datasets studied. It can be seen that exponent values vary from to .333Here we consider document popularity observed at the client (BU dataset) or proxy side only. Values of the exponent observed at the web-server side vary from to [21]. A question arises. Why is the variation of the exponent so large? Probably, the sample size is important, and the Zipf-like law only fits two decades of ranks well at best. It is quite inapplicable in the “tails” and in small ranks, and the results are sensitive to the choice of the rank window for fitting the data.
We know only two papers where the website popularity issue was addressed. In paper [22], the authors claim that the destination address of web requests can be characterized by two types of Zipf laws. In paper [2], the authors presented results for three sets of user request traces (shown in [2] in Fig. 5, which is similar to our Figs. 3 and 4). In particular, the UCB-trace in their Fig. 5 looks similar to the set 2001-09-03 shown in our Fig. 4, and it is rather impossible to extract any value of the exponent using the fit to Zipf-like law (3). To our knowledge, the authors did not publish the announced preprint with the values of exponent .
3 Datasets and methods
| Dataset | Proxy | Starting | Period | # of | # of |
| date | requests | websites | |||
| 1996 | CHG | Sep 1996 | 74d | 155743 | 4360 |
| 1997 | CHG | Jan 1997 | 1y | 2642722 | 44881 |
| 2000 | CHG | Sep 2000 | 3m | 27130648 | 146693 |
| 2001 | CHG | Feb 2001 | 8m | 64577294 | 269868 |
| ikia-2001 | IKIA | Jul 2001 | 4m | 29296632 | 177497 |
| ikia-2002 | IKIA | May 2002 | 1m | 2067205 | 53747 |
| wc-2001 | FREEnet | Jan 2001 | 4.5m | 16989853 | 152760 |
| wc-2002 | FREEnet | Feb 2002 | 5m | 26576501 | 239891 |
| yar-2002 | Yars | Apr 2002 | 1m | 9639987 | 86611 |
| ras-2002 | RASnet | Feb 2002 | 5m | 9240289 | 227686 |
| 2001-09 | CHG | Sep 2001 | 1m | 7333162 | 68671 |
| 2001-09-1w | CHG | Sep 2001 | 1w | 1382537 | 24103 |
| 2001-09-03 | CHG | Sep 2001 | 1d | 273361 | 7854 |
We start our analysis with the data collected on several proxies (cache servers) located in different Russian academic networks and in the next section will compare the results with the analysis of data collected in the fall of 2004 on American IRCache servers. Collections of data from Russian servers are presented in Table LABEL:table-sets with the dataset name, proxy server location, starting date of log files, period of log file in days (d), weeks (w), months (m), or years (y), number of requests, and number of unique websites requested. The following abbreviations are used for proxies: CHG for the proxy located in the Chernogolovka network (AS9113), Chernogolovka, Moscow region, Russia; IKIA for the proxy in Space Research Institute RAS (AS3218), Moscow, Russia; FREEnet for the proxy in FREEnet (AS2895), Moscow, Russia; RASnet for the proxy located in RASnet (AS3058), Moscow, Russia; and Yars for the proxy located in Yaroslavl State University (AS8325), Yaroslavl, Russia. Proxy-servers CHG and Yars are typical regional cache servers serving requests from local users. Other servers located in Moscow are a central part of the Russian web-caching hierarchy [32] and serve requests from local users as well as from other (e.g., regional) cache servers.

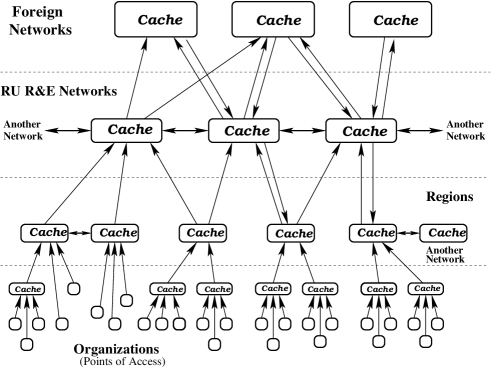
All proxy-servers run Squid caching software. Figure 1 sketches the process of data collection: user queries go to the cache server, which processes user queries to the web servers and keeps traces of user requests as records in log files. We therefore call the cache servers “observers” to stress a possible importance of their displacement in the Internet. Cache servers in Russian academic networks are organized in hierarchy sketched in Figure 2. User queries goes through the local proxy servers to regional cache servers, which may redistribute them to the servers on national research and educational networks, which may send queries to the neighboring caches or directly to the destination. Also some queries may be sent to IRCache servers. We must note that the cache server network is a logical one, programmable, and does not reflect Internet connectivity but is rather some subgraph of the Internet.
We must note here that information in the datasets is private and is subject to a privacy policy agreement. We therefore use all datasets available to us.
Each record contains information on the requested document (URL). A typical URL looks like protocol://web.site.name[:port]/path/to/document. We treat a substring between the ‘//’ and ‘/’ characters (omitting the ‘:port’ field if present444As a rule, requests with the ‘:port’ field are about 2% of all requests, probably because some Russian websites often use the port value for switching between various Cyrillic encodings.) as the website name. Only successful GET requests with code 200 are included in our analysis.
We counted the number of requests for each website in the log for each dataset. Those numbers divided by the total number of requests in the dataset give us the normalized rank distribution of websites by popularity .
Fitting equations and parameter estimation was done by the nonlinear least square method with Levenberg-Marquardt minimization.
4 Discussion
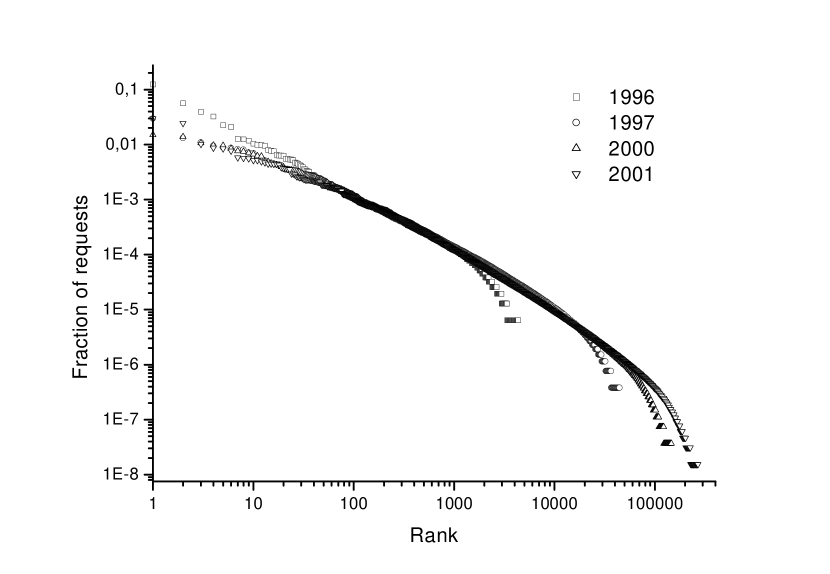
Normalized rank distributions (the fraction of requests to a given website as a function of the corresponding rank) are presented on a log-log scale in Figures 3, 4, 5. Figure 3 shows results for four datasets with the names 1996 (squares), 1997 (circles), 2000 (up triangles), and 2001 (down triangles) as defined in Table LABEL:table-sets. All of them were collected by the same proxy site CHG. Consulting Table LABEL:table-sets, we can conclude from Figure 3 that the rank distribution for all four datasets coincides well in the “middle” straight-line part of about two decades and that the larger the sample size, the larger this middle region is. We can therefore conclude that the rank distribution does not change qualitatively in five years and that the rank distribution comes closer and closer to the ideal Zipf law.
Our goal in Figure 4 is to demonstrate how a rank distribution depends on the period of observation. For that reason, we plot four distributions obtained from the datasets 2001-09-03 (squares), 2001-09-1w (circles), 2001-09 (up triangles), and 2001 (down triangles). Clearly, distribution does not vary in time but becomes more “flat” in the middle part with the longer period (larger sample size).
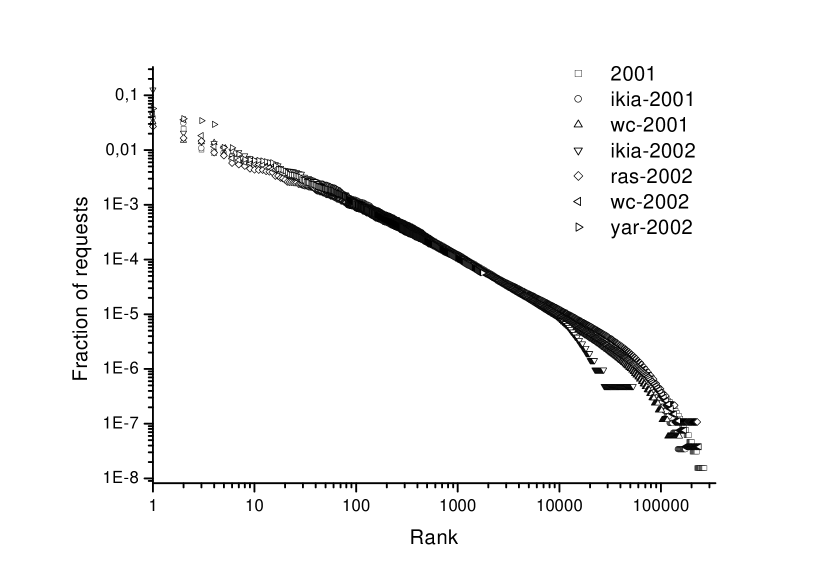
Finally, Figure 5 demonstrates that rank distributions with nearly equivalent sample sizes are independent of the displacement of the observer (i.e., cache server) in the Internet geography (at least, for the Russian academic networks). We plot seven datasets, 2001 (squares), ikia-2001 (circles), wc-2001 (up-triangles), ikia-2002 (down-triangles), ras-2002 (diamonds), wc-2002 (left-triangles), and yar-2002 (right-triangles). Figure 5 is quite convincing that the rank distribution of websites is independent of the displacement of the web cache in the hierarchy.
Totally, it can be seen that rank distributions corresponding to different datasets coincide well for the middle values of ranks. Therefore, the fraction of user requests coming to “mainstream” websites (which are often encountered in logs but are still less popular than top sites) is stable and does not vary with time (Figure 3), with dataset size (Figure 4), or with proxy location (Figure 5).
One more common feature of all graphs is the divergence of the rank distributions in the “tails”, the rightmost parts of the graph. Rank distribution turns down strongly in tails, where the websites were requested less than about times.
There is an interesting peculiarity seen in Figure 3: the fraction of requests coming to the most popular sites decreases with time. For example, the frequency of occurrences of the most popular website in 1996 was about an order of magnitude higher than in 2001. Because the most frequent requests come to different kinds of banners, counters, search engines, etc., Figure 3 demonstrates that their relative popularity diminishes with time. One possible reason is the appearance of many different sites with similar contents (as well as mirror sites) or functions (e.g., banner networks or search engines), which leads to equilibrating user interest to different hot sites. Another reason is improvement of web-client software. The internal cache of the web browser can contain more web documents; requests to the most popular documents are then processed using the internal cache. This phenomena is known as the “trickle-down” effect observed by Doyle et al. [4], which is discussed below.
Figure 4 demonstrates that the top sites have a stable fraction of requests during a given year.
Figures 2 and 3 show that Zipf-like law (3) (which must be represented as a straight line) is a very coarse approximation of the actual distribution. The main deviations from the law (3) are in the region of the most popular (top 50) sites and in the tail of the distribution.
Fitting the data to Zipf-like law, expression (3), and its modifications, expressions (4) and (5), is a tricky problem both because of the influence of the rare statistics of the large ranks and because of the high fluctuations of the leading ranks. Which method is best is not yet understood [27]. We use a least-square fit to estimate the parameters and calculate the accuracy of the estimated values by the standard approach and give it in the parentheses as a correction to the last digit.
We can choose a region of ranks of two orders of magnitude where the rank distribution looks like a straight line. But varying the interval boundaries of the rank window strongly affects the fitting parameters (e.g., the exponent ). We obtained in the range from to depending on the rank window. For example, fitting dataset 2001-09 with Zipf-like law (3) in the window gives and in window gives . Other fitting windows give other values in the range from to . We can therefore conclude that the Zipf-like law cannot give us quantitative characteristics of rank distributions of websites in the whole interval of ranks.
Slightly better results can be derived using a modified Zipf-like law, known as the Zipf–Mandelbrot law [10],
| (4) |
which gives a better approximation in the range of small ranks but is still inapplicable in the “tails”. The fit can be appreciably enhanced by introducing one more parameter in (4):
| (5) |
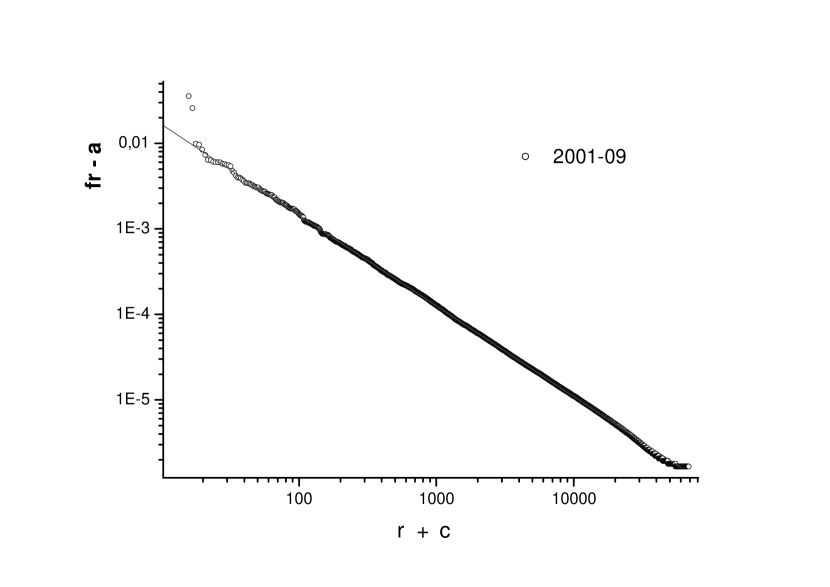
Figure 6 shows the rank distribution of websites in the coordinates , for the particular dataset 2001-09. The fraction of requests (the vertical axis) is shifted by the value and the rank by . This figure clearly demonstrates that function (5) approximates the data distribution well in almost the entire range of ranks.555We note that this method for data “straightening” is often applied in statistical physics [11, 12]. A similar equation was also proposed in a recent work on rank distribution of publication popularity [13]. We have fitted expression (5) to all our data and found that the value of is quite stable; the results are presented in Table 3 for the datasets discussed. The columns in Table 3 are the dataset name as defined in Table LABEL:table-sets and resulting values of , , and as defined in expression (5). The mean of the exponent is , which may be considered . The statistical error is calculated as the variation of from the data in Table 3.
| Dataset | |||
|---|---|---|---|
| 1996 | |||
| 1997 | |||
| 2000 | |||
| 2001 | |||
| 2001-09 | |||
| 2001-09-1w | |||
| 2001-09-03 | |||
| ikia-2001 | |||
| ikia-2002 | |||
| wc-2001 | |||
| wc-2002 | |||
| ras-2002 | |||
| yar-2002 |
The parameter can be considered a correction for the finite sample size. The larger the sample size, the less is.
The parameter in expression (5) has a very clear physical meaning. It is closely connected with the trickle-down effect observed by Doyle [4]. Doyle found that proxies disproportionally absorb requests on different levels of the hierarchy. Rank distributions obtained from data collected on proxies at different hierarchical levels differ in the region of small ranks. This effect has a clear explanation in terms of rank distributions.
As a clarifying example, we consider a two-layer hierarchy of proxies. A first-level proxy receives requests from users. If the requested document is found in its cache, then that document is returned to the client; otherwise, the request is submitted to an upper-level proxy. If we assume that a first-level proxy can hold documents in its cache, then it accordingly filters the most popular documents from the request stream, i.e., it “cuts” the leftmost points from the rank distribution. This is equivalent to the change of variables . Therefore, we presume that the parameter in equation (5) characterizes cache sizes of low-level proxies (which can also be the user’s browser cache).
It can be seen that for all datasets, is close to unity with an accuracy of a few percent. We therefore suppose that the exponent in equation (5) is a universal characteristic of web traffic, which is independent of time (for time-scales comparable with the Internet lifetime), is independent of data collection duration (when the sample size is sufficiently large and contains more than requests), and is independent of the displacement of the proxy server in the Internet hierarchy.
We found a possibility to check our findings using available statistics. We chose BU web-client traces available from ita.ee.lbl.gov (the full dataset from Nov 94 to May 95 contains 1143842 requests, 104532 unique URLs, and 4970 unique sites). This dataset was used in early work and gives one of the best examples of the Zipf law for web-page popularity () [23]. Fitting equation (5) to the rank distribution of website popularity gives , , and , which coincide well with the values obtained for Russian academic networks. This is an additional argument that website popularity distribution is universal (in other words, is independent of both the observation point in the Internet and Internet history) and follows the Zipf law with an exponent close to unity.
| cache | # of | # of | |||
| requests | websites | ||||
| bo | 23935604 | 592679 | -2.89(1) | 8.54(4) | 1.05(2) |
| ny | 12789266 | 407952 | -3.89(1) | -0.12(1) | 0.94(3) |
| pa | 3374392 | 229633 | -1.57(1) | 7.17(12) | 0.96(8) |
| pb | 10018478 | 304049 | -4.47(1) | 18.96(13) | 0.98(4) |
| rtp | 13221655 | 339918 | -4.35(1) | 23.52(13) | 1.01(4) |
| sd | 13840665 | 285356 | -3.22(1) | 0.166(7) | 1.04(3) |
| sj | 26130582 | 264396 | -6.00(1) | 1.935(13) | 1.09(2) |
| sv | 11119941 | 530731 | -3.20(1) | 16.34(13) | 0.93(4) |
| uc | 13294408 | 313178 | -5.17(1) | 15.14(9) | 1.01(4) |
| uc-12d | 3236853 | 84360 | -4.37(2) | 7.79(12) | 0.95(8) |
| uc-1d | 463899 | 13752 | -1.77(4) | 4.99(24) | 0.96(3) |
| all | 127724991 | 1176623 | -8.96(1) | 5.05(1) | 1.03(2) |
To check this statement deeper, we also analyze recently available data666Thanks to D. Wessels, who kindly gave us access to the data sets collected at the US IRCache servers. collected during the period from 11/03/2004 to 12/29/2004 at nine cache-servers of the US national cache-mesh system for science and education built-up within the IRCache project [33]. Table LABEL:table-setUS presents data from the following locations:
-
•
bo – NCAR at Boulder, Colorado
-
•
ny – New York, New York
-
•
pa – Digital Internet Exchange in Palo Alto, California
-
•
pb – PSC at Pittsburgh, Pennsylvania
-
•
rtp – Research Triangle Park, North Carolina
-
•
sd – SDSC at San Diego, California
-
•
sj – MAE West Exchange Point in San Jose, California
-
•
sv – NASA-Ames/FIX-West in Silicon Valley, California
-
•
uc – NCSA at Urbana-Champaign, Illinois.
The second and third entries from the bottom demonstrate the stability of the fit for two subsets of the data collected at uc-location, for 12 days (set name us-12d) and for 1 day (set us-1d). The last entry represents the fit to the sum of the preceding data sets. Results of the fit by expression (5) are close to unity and quite similar to those for Russian servers presented in Table 3.
5 Conclusions
We have presented modified Zipf law (5), which fits the rank distribution of web sites in the full range of ranks rather well. We found that the value of the exponent in expression (5) is stable for the analyzed datasets. It does not vary with (1) the year of data collection, (2) the period of data collection, or (3) the geographical location of the cache server where we collected data. We found that is very close to . We have reasons to suppose this value of is a universal property of web-traffic for the website rank. We have also presented a clear explanation of the “trickle-down effect” based on the properties of our modified Zipf law. We suggest that website popularity is universal property of Internet and follows the Zipf law.
In a similar experiment, fluctuations of the exponent value were checked [34] as a function of the volume of statistics, where cache traces of user requests to different Internet domains were analyzed. User requests were sent to Internet through the cache triangle, namely, they went to the Master Server, which sent each odd request to the left cache and each even request to the right cache. Clearly, the traces should be nearly equal in the limit of a large number of requests. Indeed, it was estimated that exponents extracted separately from the “left” traces and “right” traces were within five per cent for a set volume larger than ten thousand requests, and that those for set volume less than a few hundred fluctuated strongly. Thus, rare statistics may significantly affect the results.
The results in this paper may be useful for building mirror sites and CDNs as well as for improving software for DNS request caching. We also conjecture that fitting with the modified Zipf law is suitable for describing the rank distribution of web-document popularity.

6 Acknowledgment
The authors thank the anonymous referees for the valuable remarks and comments that allowed us to improve this paper. Special thanks to Duane Wessels for access to logs from IRCache web-cache servers.
This work was supported by the Russian Foundation for Basic Research.
References
- [1] Steven Glassman, A caching Relay for the World Wide Web. Proc. 1st Int. Conference on the World-Wide Web, CERN, Geneva (Switzerland), May 1994. Computer Networks and ISDN Systems, 27(2), 165-173 (1994).
- [2] Lee Breslau, Pei Cao, Li Fan, G. Phillips, S. Shenker, Web Caching and Zipf-like Distributions: Evidence and Possible Implications, Proc. IEEE INFOCOM ’99: 18th Annual Joint Conference of the IEEE Computer and Communications Societies, Volume: 1, p. 126-134, 1999.
- [3] Terence Kelly, Jeffrey Mogul. Aliasing on the World Wide Web: Prevalence and performance implications. Proc. 11th Int. WWW Conf., Honolulu, May 2002, ACM Press, pp.281 - 292.
- [4] Ronald P. Doyle, Jeffrey S. Chase, Syam Gadde, Amin M. Vahdat. The trickle-down effect: Web caching and server request distribution. Computer Communications, 25, 345-356 (2002).
- [5] V. Pareto, Cours d’economie politique, Rouge, Lausanne et Paris, 1897.
- [6] G. K. Zipf, Human Behavior and the Principle of Least-Effort. Addison-Wesley, Cambridge, MA, 1949.
- [7] W. Li, Random texts exhibit Zipf’s-law-like word frequency distribution. IEEE Trans. Inform. Theory, 38(6), 1842-1845 (1992).
- [8] R. N. Mantegna, S. V. Buldyrev, A. L. Goldberger, S. Havlin, C. K. Peng, M. Simons, and H. E. Stanley. Linguistic Features of Noncoding DNA Sequences, Phys. Rev. Lett. 73, 3169-3172 (1994).
- [9] C. Martindale, A. K. Konopka, Oligonucleotide frequencies in DNA follow a Yule distribution, Computers & Chemistry, 20, 35-38 (1996).
- [10] B. B. Mandelbrot, The Fractal Geometry of Nature. Freeman, New York, 1977.
- [11] B.I. Shklovskii, A.L. Efros, Electronic Properties of Doped Semiconductors, Percolation Theory (Springer-Verlag, Berlin, 1984) pp. 95-136
- [12] L.N. Shchur, Incipient Spanning Clusters in Square and Cubic Percolation, in Springer Proceedings in Physics, “Computer Simulation Studies in Condensed Matter Physics XII”, Eds. D.P. Landau, S.P. Lewis, and H.B. Schüttler, (Springer-Verlag, Berlin, 2000)
- [13] Ding-Ding Han, Jin-Gao Liu, Yu-Gang Ma, Xiang-Zhou Cai, Wen-Qing Shen. Scale-free download network for publications. Chin. Phys. Lett., 21(9), 1855-1857 (2004); arXiv:cond-mat/0405428 (2004).
- [14] Damaián H. Zanette, Susanna C. Manrubia, Role of intermittence in urban development: A model of large-scale city formation. Phys. Rev. Lett., 79(3), 523-526 (1997).
- [15] Matteo Marsili, Yi-Cheng Zhang, Interacting individuals leading to Zipf’s law. Phys. Rev. Lett., 80(12), 2741-2744 (1998).
- [16] S. Redner. How popular is your paper? An empirical study of the citation distribution. Eur. Phys. J. B 4, 131-134 (1998).
- [17] B. D. Malamud, G. Morein, D. L. Turcotte. Forest fires: an example of self-organized critical behavior. Science, 281, 1840-1842 (1998).
- [18] M.E.J. Newman. Power laws, Pareto distributions and Zipf’s law. arXiv:cond-mat/0412004 (2004)
- [19] Michael Mitzenmacher. A brief history of generative models for power law and lognormal distributions. Internet Mathematics, 1(2), 226-251 (2004).
- [20] J. Laherrère, D. Sornette. Stretched exponential distributions in nature and economy: “fat tails” with characteristic scales. Eur. Phys. J., B 2, 525-539 (1998).
- [21] Azer Bestavros. WWW traffic reduction and load balancing through server-based caching. IEEE Concurrency, 5(1), 56-67 (1997); Takashi Hatashima, Toshihiro Motoda, Shuichro Yamamoto. An “interest” index for WWW servers and CyberRanking. IEICE Trans. Inf. & Syst., E83-D, 729-734 (2000); Venkata N. Padmanabhan, Lili Qiu. The content and access dynamics of a busy web site: Findings and implications. Proc. ACM SIGCOMM’00, Stockholm, Sweden, 2000, pp. 111-123; Adeniyi Oke, Rick Bunt. Hierarchical workload characterization for a busy web server. In: Computer Performance Evaluation (Ed. T. Field, P.G. Harrison, J. Bradley, U. Harder). Springer-Verlag: Berlin ea, 2002, pp.309-328. Proc. TOOLS’2002: 12th Int. Conf. on Modeling Techniques and Tools, London, UK, April 14-17 2002. [Lecture Notes in Computer Science, Vol. 2324].
- [22] Masaki Aida, Noriyuki Takahashi, Tetsua Abe. A proposal of dual Zipfian model for describing HTTP access trends and its application to address cache design. IEICE Trans. Commun., E81-B (7), 1475-1485 (1998).
- [23] C. R. Cunha, A. Bestavros, M. E. Crovella, Characteristics of WWW Client-based Traces, Technical report BU-CS-95-010, Boston University, July, 1995.
- [24] P. Barford, A. Bestavros, A. Bradley, M. Crovella, Changes in Web client access patterns: Characteristics and caching implications. World Wide Web J., Spec. Issue on Characterization and Performance Evaluation, 2, 15-28 (1999).
- [25] Shudong Jin and Azer Bestavros, Sources and Characteristics of Web Temporal Locality. Proc. MASCOTS’2000: The 8th IEEE/ACM International Symposium on Modeling, Analysis and Simulation of Computer and Telecommunication Systems, San Francisco, CA, 29 Aug - 1 Sept 2000. p.28-35.
- [26] A. Mahanti, C. Williamson. Web proxy workload characterization. Tech. Report, Department of Computer Science, University of Saskatchewan, February 1999.
- [27] M.E. Crovella and M.S. Taqqu, Estimating the Heavy Tail Index from Scaling Properties, In: Methodology and Computing in Applied Probability, 1, 55-79 (1999).
- [28] A. Mahanti, C. Williamson, D. Eager, Traffic analysis of a Web proxy caching hierarchy. IEEE Network Magazine, 14(3), 16-23 (May/Jun 2000).
- [29] Chris Roadknight, Ian Marshall, and Deborah Vearer. File Popularity Characterization. Proc. WISP’99: 2nd Workshop on Internet Server Performance, Atlanta, Georgia, May 1999.
- [30] V. Almeida, A. Bestavros, M. E. Crovella, A. de Oliveira, Characterizing Reference Locality in the WWW, Proc. PDIS’96, Dec. 1996, p. 92-103.
- [31] N. Nishikawa, T. Hosokawa, Y. Mori, K. Yoshida, H. Tsuji. Memory-based architecture for distributed WWW caching proxy. Computer Networks and ISDN Systems, 30, 205-214 (1998).
- [32] Serge Krashakov, Lev Shchur. WWW Caching in Russia - Current State and Future Development. Proc. 3d Int. Web Caching Workshop, Manchester, June 15-17, 1998.
- [33] The IRCache project - http://www.ircache.net.
- [34] Sergey A. Krashakov, Lev N. Shchur. Active measurements (experiments) of the Interhet traffic using cache-mesh. Int. J. Modern Physics C, 12, 549-562 (2001).