Replay Debugging of Complex Real-Time Systems: Experiences from Two Industrial Case Studies
Abstract
Deterministic replay is a method for allowing complex multitasking real-time systems to be debugged using standard interactive debuggers. Even though several replay techniques have been proposed for parallel, multi-tasking and real-time systems, the solutions have so far lingered on a prototype academic level, with very little results to show from actual state-of-the-practice commercial applications. This paper describes a major deterministic replay debugging case study performed on a full-scale industrial robot control system, as well as a minor replay instrumentation case study performed on a military aircraft radar system. In this article, we will show that replay debugging is feasible in complex multi-million lines of code software projects running on top of off-the-shelf real-time operating systems. Furthermore, we will discuss how replay debugging can be introduced in existing systems without impracticable analysis efforts. In addition, we will present benchmarking results from both studies, indicating that the instrumentation overhead is acceptable and affordable.
Key Words.:
replay; reproducability; instrumentation; case study0309027211
Daniel Sundmark et al.Replay Debugging of Complex Real-Time Systems: Experiences from Two Industrial Case Studies
1 Department of Computer Science and Engineering, Mälardalen University, PO Box 883, SE-721 23 Västerås, Sweden
2 ABB Robotics Hydrovägen 10, SE-721 68 Västerås, Sweden
1E-mail: {daniel.sundmark, henrik.thane, joel.huselius, anders.pettersson}@mdh.se
1 Introduction
ABB is a world leading manufacturer of industrial robots for industrial automation. Out of all deployed industrial robots to date, ABB has delivered about 50 percent. Out of those 50 percent, 70 percent are deployed in the car manufacturing industry. SAAB Avionics is a major supplier of electronic warfare technology on the international market. The main focus of the company is electronic warfare systems, such as display systems, tactical reconnaissance systems and electromagnetic technology services. Avionics products can for example be found in the Swedish fighter aircraft Gripen, the American F-15 and the NH- 90 helicopter.
1.1 Contribution
In this paper, we present results from two industrial case studies performed in cooperation with the above companies. With these case studies, we show that our recent research results have not merely been academic artifacts, but contributions to a fully operational method of debugging full-scale industrial real-time systems. In addition, we present benchmarking results from both case studies, showing that the overhead incorporated in the system by instrumentation is acceptable.
1.2 Paper Outline
The rest of this paper is organized as follows: Section 2 will give a background and a motivation to the case studies as well as short descriptions of the systems studied. Section 3 describes the implementations of our method in the investigated systems. In Section 4, instrumentation benchmarking results are presented. Finally, Section 5 and Section 6 conclude the paper and discuss future work.
2 Background and Motivation
It is no secret that testing, debugging and maintenance constitute the largest percentage of the overall cost of an average industrial software project. In a recent study, NIST Rep (02) has shown that more than $59 billion/year is spent on debugging software in the U.S.A. alone. As the average complexity of software applications increase constantly it is now common that testing and debugging constitute more than 80% of the total life cycle cost Rep (02). A known fact is also that bugs are introduced early in the design but not detected until much later downstream in the development cycle, typically during integration, and early customer acceptance test. For embedded real-time software this fact makes the situation really difficult, since most failures that are detected during integration and early deployment are extremely difficult to reproduce. This makes debugging of embedded real-time systems costly since repetitive reproductions of the failure is necessary in order to find the bug. The lack of proper tools and methods for testing and debugging of complex real-time systems does not help the situation. The reason why ABB Robotics and SAAB Avionics systems were chosen as case study subjects was based on their high level of software- and overall technical complexity. In addition, the systems operate in safety-critical and high availability environments, where failures might be very costly, making system validation and verification even more important.
2.1 Replay Debugging
During the mid-eighties, in an effort to address the problems with inadequate tools for debugging of complex systems, LeBlanc and Mellor-Crummey proposed a method of recording information during run-time and using this information to reproduce the exact behavior of the execution off-line LMC (87). This method, called Instant Replay, allowed otherwise unfit cyclic debugging techniques to be used for debugging nondeterministic systems. Instant Replay, as many of its successors AL (94)CAN+ (01)RDB (99)TCO (91)CdKF (00), was focused on debugging of non-real-time concurrent programs, thereby concentrating mainly on the correct reproduction of synchronization races and, in some cases, on-the-fly detection of data races. However, some methods for debugging of complex real-time systems have also been proposed DR (92)TFCB (90). These methods have called for the availability of specialized hardware and non standard instrumentation tools in order to work satisfactorily. They have also been mere academic prototypes and not suited for the complexity of real world software applications.
2.2 Real-Time System Debugging using Time Machines and Deterministic Replay
In our previous work on debugging of embedded real-time systems, we have proposed a replay method for recording important events and data during a reference execution and to reproduce the execution in a subsequent replay execution TH (00)TSHP (03)Hus (02). As for most replay debugging methods, if the reference execution fails, the replay execution can be used to reproduce the failure repeatedly in a debugger environment in order to track down the bug. Our method allows replay of real-time applications running on top of standard commercial real-time operating systems (RTOS) and uses standard cyclic debuggers for sequential software. There is no need for specialized hardware or specialized compilers for the method to work and the software based instrumentation overhead has so far proven acceptable. This allows our probes to be left permanently in the system, making post-mortem debugging of a deployed system possible while at the same time eliminating the risk of experiencing probe effects Gai (86) during debugging. We refer to our method as Deterministic Replay. The tool that is used to “travel back in time” and investigate what sequence of events that led to a failure is referred to as the Time Machine and consists of three major parts: The Recorder which is the instrumentation mechanism (similar to the black-box or flight recorder in an airplane), the Historian which is the post-mortem off-line analysis tool and the Time Traveler which is the mechanism that forces the system to behave exactly as the reference execution off-line.
The main objective of performing the case studies was to validate the applicability of the Time Machine method to existing complex real-time systems. The basic questions were:
-
•
Would it be possible to reproduce the behavior of such complex target systems?
-
•
How do we minimize the analysis and implementation effort required in order to capture the data required from such complex target applications?
-
•
Would the instrumentation overhead (execution time and data bandwidth) be sufficiently low for introduction in real-world applications?
2.3 ABB Robotics System Model
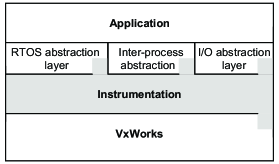
To validate our ideas, we had the opportunity to work with a robotics system that is state-of-the-art in industrial manufacturing automation. The system is a highly complex control system application running on top of the commercial Wind River RTOS VxWorks. However, in order to avoid the somewhat impossible mission of analyzing and instrumenting an approximate of 2.5 million lines of code in an academic project, we focused on instrumenting five central parts in the target system:
-
•
The operating system.
-
•
The application’s operating system abstraction layer.
-
•
The inter-process communication abstraction layer.
-
•
The peripheral I/O abstraction layer.
-
•
The state preserving structures of each individual task.
All instrumentation was system wide and application-transparent except for the state preserving structures in the tasks. A more thorough description of the instrumentation will be given below. For an overview, see Figure 1.
Out of an approximate total of 70 tasks, we choose to record the state (internal static variables) of the three most frequently running tasks. Thus, we limited the instrumentation efforts for parts of the data flow recording. However, these three tasks constituted the major part (approximately 60%) of the CPU utilization and their data flow constituted more than 96% of the overall system data flow bandwidth.
2.3.1 Robotics System-Level Control Flow Model
In general, task activations in the robotics system are dependent on message queues. Basically, each task is set to block on a specific message queue until a message is received in that queue. When a message is received, the task is activated, performs some action, and is finally set to wait for another message to arrive. Chains of messages and task activations, in turn, are initiated by occurrence of external events, such as hardware interrupts at arrival of peripheral input.
2.3.2 Robotics Data Flow Model
We divide the Robotics data flow model into three parts: The per-task state preserving structures, the inter-process communication and peripheral I/O. As for the state preserving structures, each task has its own local data structure used to keep track of the current task state. This structure holds information of message data, static variables and external feedback. Naturally, this structure alters during execution as the state of the task changes.
The inter-process communication is handled by the use of an IPC layer implemented on top of the message queue primitives in VxWorks. This layer extends the functionality of the original message queue mechanisms. Finally, peripheral I/O, such as motion control feedback is received through a peripheral I/O layer.
2.4 SAAB Avionics System Model
In addition to the Robotics system, we also performed a minor case study in a military aircraft radar system. In short, the task of the system is to warn the pilot of surrounding radar stations and to offer countermeasures. This study was less extensive in that it only covered a part of the instrumentation aspect of the Time Machine technology. The full scale Saab Avionics radar system holds about 90 ADA tasks running on top of the Wind River VxWorks RTOS. However, in the scope of the case study, a reduced system with 20 central tasks was investigated.
Dataflow was limited to inter process messages. As in the robotics case, task activations in the Avionics system are controlled by message arrivals on certain queues.
3 Technique Implementations
To be able to facilitate replay, there were three things we needed to achieve: First, we needed to instrument both the VxWorks real-time kernel and the application source codes in order to be able to extract sufficient information of the reference execution. Second, we needed to incorporate the replay functionality into the WindRiver integrated development environment (IDE). We used the Tornado 2 version of the IDE as this is the standard IDE for developing VxWorks real-time applications. Third, we needed to add the Time Machine mechanisms used to perform the actual replay of the system. Even though the Tornado 2 IDE features a VxWorks-level simulator, both recording and replay execution were performed on the actual target system. In the next sections, we will discuss these steps one by one.
3.1 VxWorks Instrumentation
A common denominator for the Robotics system and the Avionics system is that they both run on top of the Wind River VxWorks RTOS. In order to extract the exact sequence of task interleavings, it was essential to be able to instrument the mechanisms in VxWorks that directly influence the system-level control flow. Therefore, we instrumented semaphore wait and signal operations, message queue blocking send and receive, task sleep function taskDelay as well as preemptive scheduling decisions.
3.1.1 Blocking System Call Instrumentation Layer
To instrument the blocking task delay-, semaphore- and message queue primitives mentioned above, we added an instrumentation layer on top of the VxWorks system call API. This layer replaces the ordinary primitives with wrappers including the added functionality of instrumentation. Apart from this instrumentation, the wrappers use the original primitives for system call operation.
3.1.2 Task Switch Hook
With the blocking system call instrumentation layer, we are able to monitor and log what possibly blocking system calls are invoked. However, in order to see which of the invoked calls actually leads to task interleavings, we need to be able to insert probes into the scheduling mechanisms of the kernel. Fortunately, VxWorks provides several hooks, implemented as empty callback functions included in kernel mechanisms, such as a TaskSwitchHook in the task switch routine. These hooks can be used for instrumentation purposes, making it possible to monitor and log sufficient information of each task switch in order to be able to reproduce it.
3.1.3 Preemption Instrumentation
As some of the task interleavings are asynchronous, that is, their occurrence are initiated by asynchronous events such as hardware interrupts, they do not have an origin in the logic control flow of task execution that blocking system calls do. To reproduce these events and interleavings correctly in a replay execution, we need to be able to pinpoint and monitor their exact location of occurrence. In other words, we need some sort of unique marker to differentiate between different program states. The program counter value of the occurrence of the event is a strong candidate for such a unique marker. However, as program counter values can be revisited in loops, subroutines and recursive calls, additional information is needed. To provide such data, we use the information of the task context available from the task control block in the TaskSwitchHook. This task context is represented in the contents of the register set and the task stack. To avoid the massive overhead introduced by sampling the entire contents of these areas, we use checksums instead TSHP (03). Although these checksums are not truly unique, they strongly aid in differentiating between program states.
3.2 ABB Robotics Instrumentation
In contrast to the system-level control flow instrumentation, which is handled on the VxWorks RTOS level, some of the data flow instrumentation needs to be handled on the application level. This is due to the fact that all of the data used to represent the state of the task execution need to be identified explicitly in the source code and instrumented for recording. Such data include static and global variables and structures holding information that can be altered during the entire temporal scope of system execution.
As stated in Section 2.3.2, in the Robotics system, these data are grouped together in static structures, individually designed for each task. To minimize the amount of information stored in each invocation of a task, we used filters that separated the type of data that was prone of changes during run-time from the type of data that was assigned values during system initialization and kept these values throughout the execution. The latter are not recorded during run-time. These filters were constructed from information gathered empirically during test-runs of the system.
To be able to reproduce interaction with an external context and inter-task communication, the peripheral I/O and the inter-task communication message queues are instrumented in two operating system abstraction layers, similar to that described in Section 3.1.1. This solution gives the instrumentation a quality of transparency, making it less sensitive to changes in the application code.
However, the part of the data flow recording that is concerned with the reproduction of state preserving structures is performed by probing functions inserted at various locations in the application code. A more thorough discussion on how and where these probes should be inserted in the code is given in our previous papers TSHP (03)HST (03). A summarizing overview of system instrumentation can be viewed in Figure 1. In the figure, the gray area represents the instrumentation layer, which is slightly integrated into different parts of the RTOS and some application abstraction layers.
3.3 SAAB Avionics Instrumentation
Since both the Robotics and the Avionics system run on top of VxWorks and the RTOS-level instrumentation is application independent, the instrumentation of the Avionics system-level control flow was implemented in a very similar fashion. However, one aspect had to be taken into account. In contrast to the Robotics system, the Avionics system was implemented in Ada. As the Ada runtime environment is added as a layer on top of VxWorks, this layer had to be altered in order to be able to monitor rendezvous and other Ada synchronization mechanisms. This instrumentation allowed for the Ada runtime environment to use instrumented versions of the VxWorks synchronization system calls instead of the original versions.
As for the data flow, this study focused on inter-process communication. Messages were logged in cyclic buffers, dimensioned on a per-process basis, at the receiver. State preserving structures and peripheral I/O were not considered as in the ABB Robotics case. However, the benchmark figures of the inter-process communication recordings give a hint of the overall overhead incorporated in a full-scale instrumentation.
3.4 Time Machine
Once the code is properly instrumented, we are able to record any execution of the system in order to facilitate replay of that very execution. The next step is to implement the mechanisms of the time machine that actually performs the replay. These mechanisms were implemented in an add-on to the Tornado 2 IDE.
3.4.1 The Historian – Starting the Replay Execution
In our Time Machine replay system, the task of the Historian is to analyze the data flow- and system-level control flow recordings of a reference execution. We used basic cyclic FIFO buffers for recording. Combined with the fact that the cyclic buffers are of a finite length and memory resources are scarce, this rarely leads to a situation where all recorded information is available at the end of the reference execution. As these recordings most often will be of a different temporal length, some sort of pruning is needed in order to discard those entries that are out of the consistent temporal scope of all buffers. In other words, all tasks that are to be replayed needs information from both the control flow recording (one per system) and data flow recordings (one per task). Since buffers are dimensioned using a discrete number of entries and not continuous time, we will practically always end up in a situation where some buffers cover a longer span of time than others. As this information is unusable, it must be detected and discarded. This operation is performed by the Historian as depicted in Figure 2.
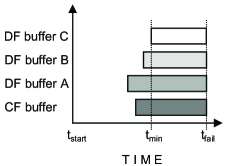
In addition, the Historian has the responsibility to find a consistent state from which the replay executions can be started HST (03). Again considering Figure 2, if such a starting point exists, it is located in between and , where sufficient information of all instrumented tasks is available. When this operation is performed, the Historian sets up the structures in the target system used to reproduce the data flow of the reference execution. A more elaborate description on how a starting state is found and a replay execution is prepared is presented in a recent paper by Huselius et. al. HST (03).
3.4.2 The Time Traveler
As the replay execution is started, the Time Traveler interacts with the debugger and, given the information provided by the Historian and the breakpoints visited in the program, allows recreation of the system state for any given time in the scope of the replay execution TSHP (03).
3.5 IDE and Target System Integration
Tornado 2 is an integrated development environment including a text editor, a project/workspace handler, a gcc compiler, a target simulator and a gdb-based debugger, capable of performing multi-threaded debugging with no requirements on deterministic reproduction of execution orderings.
3.5.1 Tornado 2 IDE Architecture and WTX
Debugging in the Tornado 2 environment is performed by means of remote debugging. That is, the debugging session is executed on-target and controlled from the development environment via communication with an on-target task.
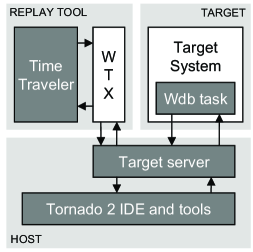
To handle all communication with the target system, a hostbased target server is included in the Tornado 2 IDE. All tools that seek interaction with the target system are able to connect as clients to the target server and issue requests of target operations. To provide tool vendors with a possibility to create their own add-ons to the Tornado 2 IDE, a programming interface is provided. The Wind River Tool Exchange (WTX) API enables developers to create tools that communicate and interact directly with the VxWorks target server. For the implementation of our Time Machine system, the Historian and the Time Traveler were integrated and implemented as a WTX tool, able to connect with a running target server and to force a replay execution upon the system running on that target. The structure of the Tornado 2 IDE, the Time Machine and the target system interactions is depicted in Figure 3.
3.5.2 Wdb Task
To handle the on-target debugging operation, VxWorks provides a dedicated task, the Wdb task. This task handles requests of breakpoints, watches, single-stepping and other debugging functions from the IDE. These functions are used by the Time Traveler via the WTX interface and the target server in order to control the replay execution.
3.5.3 Breakpoints
Breakpoints play a central role in the interaction between the time machine and the target system. As described by the Deterministic Replay method TSHP (03), breakpoints are set at every point of possible task interleaving and as they are encountered in the target system, their occurrence is echoed from the Wdb task through the WTX and into the event handler of the Time Traveler. Based on the individual features of each breakpoint, the state of the replay execution can be deduced and the Time Traveler replay engine will force the desired behavior on the target system
3.5.4 Debugging Mode
Debugging in VxWorks can be performed in two different modes: Task mode and system mode. The difference is that when in system mode, an encountered breakpoint will halt the entire system, including the operating system. In task mode, a breakpoint will only halt the task that encountered it, leaving all other tasks free for execution.
Ideally, since the investigated applications are pseudoparallel, system mode debugging should be used. This would help in guaranteeing the correct ordering of events and task interleavings in the replay execution since no task is able to continue execution and corrupt the system-level control flow if the entire system is halted. However, we experienced problems when trying to reproduce this ordering in system mode debugging regarding incapability of task suspension. This is due to the fact that no tasks can be explicitly suspended from execution by an external operation (such as requests made from the time traveler tool) in system mode debugging. In addition, the locking of the Wdb task substantially complicated communication between the target system and the IDE, making thorough investigation of the target state more difficult. Therefore, task mode debugging is used and the correct ordering of events in the replay execution is explicitly forced upon the system by means of the Time Traveler replay engine.
4 Benchmark
One of the issues of these case studies was to investigate whether the overhead incorporated by system-level control flow- and data flow instrumentation was acceptable in a full-scale complex industrial real-time application or not. In order to resolve this issue, we performed benchmarks measuring instrumentation mechanism CPU load and memory usage in both systems. Since the instrumentation is yet to be optimized and the benchmarking tests are performed under worst-case scenario conditions, many results might be rather pessimistic.
4.1 ABB Robotics
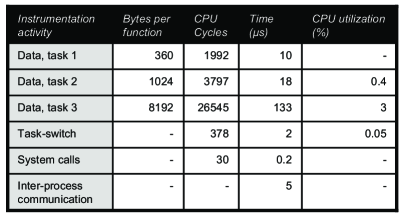
In the ABB robotics case, we timestamped the entry and the exit of all instrumentation and recording mechanisms. This gave us a possibility of extracting the execution time of the software probes. In addition, we measured the frequency and recording size of the data flow instrumentation mechanisms. The achieved results are presented in Figure 4. The bytes per function column shows the number of bytes logged by each iteration of an instrumentation function, and as each task instance has one and only one data flow instrumentation function, this figure also represents the number of bytes stored in each task instance of a task. The CPU cycles and the Time columns present the execution time spent in each instrumentation function and the CPU utilization column shows the percentage of all CPU time spent in each instrumentation function. Where results are left out, these are discarded due to their insignificant interference with memory or CPU utilization. We note that task 3 has a combination of a high frequency and large state preserving structures, resulting in the largest monitoring overhead (3% CPU utilization).
4.2 SAAB Avionics
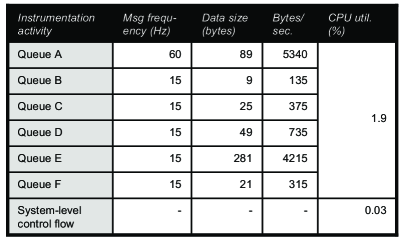
As the data instrumentation in the Avionics system is performed solely on message queues, the data flow benchmark is made in a per-queue fashion. Since there are major differences in message arrival frequencies and message size between the different queues, only the six most memory-consuming message queues are presented in the benchmark results. Out of the 17 instrumented message queues, these six consume 99% of all message queue memory bandwidth. The results of the Avionics benchmarking study are shown in Figure 5, presented in the form of memory utilization for logging (in the bytes/second column) and CPU utilization (in the rightmost column). As in the robotics case, it is the combination of a high frequency and a large size of data (such as the one of Queue A and Queue E) that has the most significant implications on the instrumentation memory utilization.
5 Conclusions
With this paper, we have shown that complex real-time system debugging is feasible using the Deterministic Replay technique and the Time Machine tool. This is true not only for specialized academic systems, but also for full-scale industrial real-time systems. Furthermore, we have shown that it is possible to achieve a high level of transparency and portability of the method by placing much of the instrumentation in system call-, inter-process communication- and peripheral I/O layers, rather than in the application source code. Both case studies presented here indicate a small CPU utilization overhead of 0.03–0.05% for system-level control flow instrumentation. The data flow instrumentation has proven more temporally substantial, but has stayed in the fully acceptable interval of 1.9–3.0%. As for memory utilization, the ABB Robotics instrumentation required a bandwidth of 2 MB/s and the Saab Avionics system called for approximately 12-15 kB/s for both system-level control flow and data flow logging. Looking at the size of these systems and the resources available, such a load is definitely affordable.
6 Future Work
We have successfully applied the time machine approach in a number of applications running on different operating systems, hardware and debuggers TSHP (03). However, we have learned that it is necessary to carefully analyze the target system’s data flow with respect to what data is re-executed, re-transmitted and what data has external origin in order not to forego something that may inhibit deterministic re-execution or that we do not record to much. Missing out on information is a serious problem and is something we have begun to address. We have started to look into how to automatically derive tight sets of possible data derived from what we actually have recorded. Another issue that needs to be considered is replay of applications which use vast amounts of information, e.g., real-time database applications. In such applications the “state preserving variables” are very substantial and require some kind of incremental snapshot algorithm to be manageable.
References
- AL (94) K. Audenaert and L. Levrouw. Interrupt Replay: A Debugging Method for Parallel Programs with Interrupts. Microprocessors and Microsystems, 18(10):601 – 612, 12 1994.
- CAN+ (01) J.-D. Choi, B. Alpern, T. Ngo, M. Sridharan, and J. Vlissides. A Pertrubation-Free Replay Platform for Cross-Optimized Multithreaded Applications. In Proceedings of 15th Parallel and Distributed Processing Symposium, page 10, April 2001.
- CdKF (00) J. Chassin de Kergommeaux and A. Fagot. Execution Replay of Parallel Procedural Programs. Journal of Systems Architecture, 46(10):835 – 849, 2000.
- CL (87) T.A. Cargill and B.N. Locanthi. Cheap Hardware Support for Software Debugging and Profiling. pages 82 – 83, October 1987.
- DR (92) P. Dodd and C. V. Ravishankar. Monitoring and Debugging Distributed Real-Time Programs. Software-Practice and Experience, 22(10):863 – 877, October 1992.
- Gai (86) J. Gait. A Probe Effect in Concurrent Programs. Software – Practice and Experience, 16(3):1986, March 1986.
- HST (03) J. Huselius, D. Sundmark, and H. Thane. Starting Conditions for Post-Mortem Debugging using Deterministic Replay of Real-Time Systems. In Proceedings of the 15th Euromicro Conference on Real-Time Systems (ECRTS03), July 2003.
- Hus (02) J. Huselius. Debugging Parallel Systems: A State of the Art Report . Technical Report 63, Mälardalen University, Department of Computer Science and Engineering, September 2002.
- LMC (87) T.J. LeBlanc and J.M. Mellor-Crummey. Debugging Parallel Programs with Instant Replay. IEEE Transactions on Computers, 36(4):471 – 482, April 1987.
- MCL (89) J. Mellor-Crummey and T. LeBlanc. A Software Instruction Counter. In Proceedings of the Third International Conference on Architectural Support for Programming Languages and Operating Systems, pages 78 – 86. ACM, April 1989.
- RDB (99) M. Ronsse and K. De Bosschere. RecPlay: A Fully Integrated Practical Record/Replay System. ACM Transactions on Computer Systems, 17(2):133 – 152, 5 1999.
- Rep (02) NIST Report. The economic impacts of inadequate infrastructure for software testing., May 2002.
- TCO (91) K.-C. Tai, R.H. Carver, and E.E. Obaid. Debugging Concurrent Ada Programs by Deterministic Execution. IEEE Transactions on Software Engineering, 17(1):45 – 63, January 1991.
- TFCB (90) J.P.P. Tsai, K.-Y. Fang, H.-Y. Chen, and Y.-D. Bi. A Noninterference Monitoring and Replay Mechanism for Real-Time Software Testing and Debugging. IEEE Transactions on Software Engineering, 16(8):897 – 916, August 1990.
- TH (00) H. Thane and H. Hansson. Using Deterministic Replay for Debugging of Distributed Real-Time Systems. In Proceedings of the 12th EUROMICRO Conference on Real-Time Systems, pages 265 – 272. IEEE Computer Society, June 2000.
- TSHP (03) H. Thane, D. Sundmark, J. Huselius, and A. Pettersson. Replay Debugging of Real-Time Systems Using Time Machines. In Parallel and Distributed Systems: Testing and Debugging (PADTAD). ACM, April 2003.