Supporting Exploratory Queries in
Database-Centric Web Applications
Abstract
Users of database-centric Web applications, especially in the e-commerce domain, often resort to exploratory “trial-and-error” queries since the underlying data space is huge and unfamiliar, and there are several alternatives for search attributes in this space. For example, scouting for cheap airfares typically involves posing multiple queries, varying flight times, dates, and airport locations. Exploratory queries are problematic from the perspective of both the user and the server. For the database server, it results in a drastic reduction in effective throughput since much of the processing is duplicated in each successive query. For the client, it results in a marked increase in response times, especially when accessing the service through wireless channels.
In this paper, we investigate the design of automated techniques to minimize the need for repetitive exploratory queries. Specifically, we present SAUNA, a server-side query relaxation algorithm that, given the user’s initial range query and a desired cardinality for the answer set, produces a relaxed query that is expected to contain the required number of answers. The algorithm incorporates a range-query-specific distance metric that is weighted to produce relaxed queries of a desired shape (e.g., aspect ratio preserving), and utilizes multi-dimensional histograms for query size estimation. A detailed performance evaluation of SAUNA over a variety of multi-dimensional data sets indicates that its relaxed queries can significantly reduce the costs associated with exploratory query processing.
1 Introduction
An increasing number of Web applications are utilizing database engines as their backend information storage system. In fact, a recent survey [4] states that more than 200,000 Web sites generate content from databases containing 7500 terabytes of information, and they receive 50% more monthly traffic than other sites.
Users of database-centric Web applications, especially in the e-commerce domain, often resort to exploratory “trial-and-error” queries since the underlying data space is huge and unfamiliar, and there are several alternatives for search attributes in this space [21]. Consider, for example, the query interface provided at Travelocity [24], a popular Web site for travel planning. Here, for each itinerary, users must select origin and destination airports, departure and return times, departure and return dates, and may optionally select airlines. Faced with this environment, users often pose a sequence of range queries while scouting for cheap airfares. For example, the first query could be:
         SELECT * FROM FLIGHTS
         WHERE DepartureTime BETWEEN 10.00 A.M. AND 11.00 A.M. AND
         DepartureDate BETWEEN 09-11-2003 AND 09-12-2003 AND
         Origin = "LAX" AND Destination = "JFK" AND Class = "ECONOMY".
and if the result for this query proves to be unsatisfactory, it is likely to be followed by
        SELECT * FROM FLIGHTS
        WHERE DepartureTime BETWEEN 08.00 A.M. AND 12.00 A.M. AND
        DepartureDate BETWEEN 09-11-2003 AND 09-13-2003 AND
        Origin = "LAX" AND Destination = "JFK" AND Class = "ECONOMY".
and so on, until a satisfactory result set is obtained.
Such trial-and-error queries are undesirable from the perspective of both the user and the database server. For the server, it results in a drastic reduction in effective throughput since much of the processing is duplicated in each successive query. For the client, it results in a marked increase in response times, as well as frustration from having to submit the query repeatedly. The problem is compounded for users who access the Web service through a handheld device (PDA, smart-phone, etc.) due to the high access latencies, cumbersome input mechanisms, and limited power supply.
Too Few Answers
A primary reason for the user dissatisfaction that results in repetitive queries is the cardinality of the answer set – the Web service may return no or insufficiently few answers, and worse, give no indication of how to alter the query to provide the desired number of answers [21]. (The complementary problem of “too many answers” has been previously addressed in the literature – see, for example [6, 7].)
Two approaches, both implemented on the client-side, have been proposed for the “too few answers” problem: The 64K Inc.[1] engine augments query results (if any) with statistical information about the underlying data distribution. Users are expected to utilize this information to rephrase their queries appropriately. However, it is unrealistic to expect that naïve Web users will be able (or willing) to perform the calculations necessary to rephrase their queries.
An alternative approach was proposed in Eureka [21]. In response to the initial user query, Eureka caches the relevant portion of the database at the client machine, allowing follow-up exploratory queries to be answered locally. A major drawback is that the user needs to install a customized software for each of the Web services that she wishes to access. In addition, this strategy may not be feasible for resource-constrained client devices which may be unable to host the entire database segment, or which are connected through a low-bandwidth network.
Finally, yet another possibility is to convert the user’s range query into a point query (e.g., by replacing the box represented by the query with its centerpoint) and then to use one of the several Top-K algorithms available in the literature (e.g., [5]) with respect to this point. However, this approach is unacceptable since it runs the risk of not providing all the results that are part of the original user query. Further, as discussed later in this paper, closeness to a point may not be equivalent to closeness to the query box.
The SAUNA Technique
In this paper, we propose SAUNA (Stretch A User query to get N Answers), a server-side solution for efficiently supporting Web-based exploratory queries. More formally, given an initial user query (which we expect to return answers), and given the desired number of answers , if , SAUNA derives a new relaxed query which contains and is expected to have answers. A pictorial representation of a SAUNA relaxation is shown in Figure 1 for a two-dimensional range query.

Note that a variety of relaxed queries, which may even be infinite in number, could be derived that obey the above constraints. In this solution space, SAUNA aims to deliver a relaxed query that (a) minimizes the distance of the additional answers with respect to the original query, that is, it aims to derive the closest answers, and (b) minimizes the data processing required to produce this set of answers. The first goal is predicated on defining a distance metric for points lying outside the original query – this issue is well understood for point-queries [5] but not for the range (or box) queries that we consider here. Therefore, SAUNA incorporates a box-query-specific distance metric that is suitably weighted to produce relaxed queries of a desired shape (e.g., aspect-ratio preserving with respect to the original query). To achieve the second goal, SAUNA utilizes multi-dimensional histograms as the tool for query size estimation. Histograms [17, 18, 19] are the de facto standard technique for maintaining statistical summaries in current database systems, and therefore our system is easily portable to these platforms. While uni-dimensional histograms are currently the norm, techniques for easily building and maintaining their multi-dimensional counterparts have recently appeared in the literature [2].
As we show in Section 5, a detailed performance evaluation of SAUNA over a variety of real and synthetic multi-dimensional data sets stored on a Microsoft SQL Server 2000 engine indicates that its relaxed queries can significantly reduce the costs associated with exploratory query processing, and in fact, often compare favorably with the optimal-sized relaxed query (obtained through off-line processing). Further, these improvements are obtained even when the memory budget for storing statistical information is extremely limited.
Organization
The remainder of this paper is organized as follows: The relaxation problem is formally defined in Section LABEL:sec:problem. Distance metrics for box queries are discussed in Section 3. The SAUNA query relaxation strategy is presented in Section 4. The performance model and the experimental results are highlighted in Section 5. Related work on query relaxation is reviewed in Section LABEL:sec:related. Finally, in Section 6, we summarize the conclusions of our study and outline future research avenues.
2 Problem Definition
3 Distance Metrics for Box Queries
Most distance functions used in practice are based on the general theory of vector p-norms [13], with . For example, gives the classical Euclidean metric, represents the Manhattan metric, and results in the Max metric. In the remainder of this paper, for ease of exposition, we assume that all distances are measured with the Euclidean metric. Note, however, that the SAUNA relaxation algorithm can be easily adapted to any of the alternative metrics.
3.1 Reference Points
When computing the distances of database tuples with respect to point queries, it is clear that the distances are always to be measured (whatever be the metric) between the pair of points represented by the database tuple and the point query. However, when we come to box (range) queries, which is the focus of this paper, the issue is not so clear-cut since it is not obvious as to which point in the box should be treated as the reference point. In fact, it is even possible to think of distances being measured with respect to a set of reference points.
One obvious solution is to take some point inside the box (e.g., the center), treat the box as being represented by this point, and then resort to the traditional distance measurement techniques. However, this formulation appears highly unsatisfactory since the spatial structure of the box, which is representative of the user intentions, is completely ignored. Instead, we contend here that the user’s specification of a box query implies that she would prefer answers that are close to the periphery of the box. To motivate this, consider the example situation shown in Figure 2, where point is farther from the box center than point i.e., , but ’s distance from the closest face of the box is smaller than the corresponding distance for i.e., . In this situation, we expect the user to prefer point over since there is less deviation with respect to the complete box.

The above observation can be formally captured by the following reference point assignment technique: For measuring the distance between a point and a query box , the reference point on is the point of intersection of the perpendicular line drawn from to the nearest face or corner of the box .
We could, of course, have devised more complex reference point assignments – for example, compute the average of the distance between and all corners of the box , with the box corners operating as a universal set of reference points. However, we expect that the above simple formulation may be sufficient to express the expectation of a significant fraction of users of Web services, and further, more complex assignments can be directly accommodated, if required, in the SAUNA relaxation algorithm.
In summary, given a point and a box-query with lower and upper limits and respectively, we denote the component of distance on the -th dimension as
and the overall (Euclidean) distance between and as
| (1) |
Note that with this formulation, all points that lie within or on the box have an associated distance of zero.
3.2 Attribute Weighting
An implict assumption in the above discussion was that relaxation on all dimensions was equivalent. However, it is quite likely that the user finds relaxation on some attributes more desirable than on others. For example, a business traveler may be time-conscious as compared to price, whereas a vacationer may have the opposite disposition. Therefore, we need to weight the distance on each dimension appropriately. That is, we modify Equation 1 to
| (2) |
where is the weight assigned to dimension .
One option certainly is to explicitly acquire these weights from the user, and use them in the above equation. However, as a default in the absence of these inputs, we can resort to the following: Use the box shape as an indicator of the user’s intentions. Specifically, we can assume that the user is willing to accept a relaxation on each range dimension that is proportional to the range size in that dimension, i.e., the user would prefer what we term as an Aspect-Ratio-Preserving relaxation. This metric preserves the aspect ratio of user-supplied query hence the name. This objective can be easily implemented by setting
| (3) |
An alternative interpretation of the user’s box-query structure could be that attributes should be relaxed in inverse proportion to their range sizes, since the user has already built-in relaxation into the larger ranges of her query. This can be implemented with the following distance function
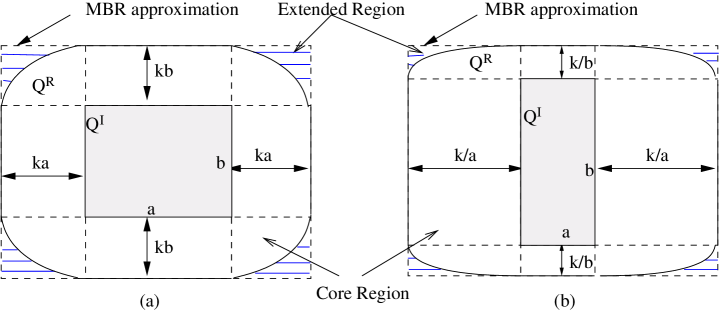
Figure 3 shows an example of the relaxed queries produced by using the Aspect and Inverse metrics, respectively. Given a constant and relaxation units and (in the and axes, respectively), we see in these figures that the locus of points equidistant from the original query is not hyper-rectangular in the corners. Since relational databases can execute only hyper-rectangular queries, we approximate the relaxed queries by their Minimum Bounding (Hyper)-Rectangles (MBRs). We refer to the area enclosed within the locus as the core region and the area between the core region and the MBR rectangle as the extended region.
If our goal is to produce the closest set of answers to the query box, then we need to explicitly prune the extended region points. This is because there may be a point lying just outside the current MBR whose distance is less than that of the extended region points. We term this as a distance-preserving relaxation. However, if minor deviations from the optimal set of answers is acceptable, then we can settle for a box-preserving relaxation instead, wherein answers from the extended region are also included in the answer set. Our experimental results indicate little performance difference for these alternative relaxations – therefore, we assume a box-preserving relaxation in the remainder of this paper.
As a final point, note that if the user has specified a point query as opposed to a box query, then the above formulation degenerates to a traditional Top-N query [5], where the goal is to find the nearest N neighbors to the query point.
4 The SAUNA Relaxation Algorithm
We propose SAUNA, a simple query relaxation mechanism that attempts to ensure the desired cardinality and quality of answers while simultaneously trying to reduce the cost of relaxed query execution. Specifically, our algorithm generalizes to box queries the approach taken for point queries in [5, 8].
Our relaxation strategy leverages histograms for query size estimation. Histograms are the de facto standard technique for maintaining statistical summaries in current database systems, and therefore SAUNA is easily portable to these platforms. In particular, we use multi-dimensional histograms for the experiments reported in this study. Although multi-dimensional histograms have been touted as being resource-intensive to create and maintain, recent work [2] has addressed this problem by proposing an online adaptive mechanism for easily building and maintaining multi-dimensional histograms, the so-called self-tuning histograms.
Due to their summary nature, histograms can provide only estimates, and not the exact values. Therefore, when relaxing a query to produce answers, there is always a risk of either under-estimation or over-estimation of the cardinality of the answer set. While under-estimation results in inefficiency due to accessing more database tuples than necessary, over-estimation requires the query to be relaxed further and submitted again – a restart in the terminology of [8].
Estimation strategies possible in this environment include a conservative approach that completely eliminates restarts at the risk of getting many more tuples than necessary, and an optimistic approach that trades restarts for improved efficiency. These No-Restarts and Restarts approaches were implemented in [8] by assuming that all database tuples in a histogram bucket are at the maximum or minimum distance, respectively, with respect to the point query. Note that for a point query, there is always a unique location on a histogram bucket which is at a minimum (maximum) distance from the point query. However, when we consider box-queries in conjunction with the periphery-based distance metric described in the previous section, there is a set of points on the histogram bucket that are all at the same minimum (maximum) distance from the box query. In Figure 4, we present the MinDist and MaxDist algorithms to find these minimum and maximum distances, respectively. Both these algorithms are linear in the number of query attribute dimensions. We describe below the various relaxation strategies for box queries that are based on these distance computations.
4.1 Box-Restarts Strategy
In this approach, all tuples inside a histogram bucket are assumed to be present on a locus of minimum distance from the query box. Since both the query box and the histogram bucket are -dimensional hyper-rectangles, the minimum distance between them is the minimum distance between any pair of their dimensional hyper-rectangle surfaces. We use the MinDist algorithm (Figure 4(a)) to compute this minimum distance. MinDist locates one of the points at minimum distance on the bucket and then computes the distance of that point from the query box. In the algorithm, and are the lower and upper bounds of the bucket in the i-th dimension, while and are the corresponding lower and upper bounds of the box query. It should be noted here that the identification of the nearest point in the MinDist algorithm is independent of the specific distance metric (including attribute weighting) chosen for computing the minimum distance.
|
|
||||||||||||||||||||||||||||||||||||||||||||||||||||||||||||||||||||||||||||||
| (a) MinDist | (b) MaxDist |
In the Box-Restarts relaxation strategy, we compute the minimum distances of all histogram buckets from the query box, and then sort these buckets in increasing order of these distances. We assume that relaxing the query up to the minimum distance of some bucket implies that the relaxed query includes all tuples in that bucket. Hence we choose the largest distance from the set of bucket distances such that the relaxed query is expected to contain tuples. Since the underlying assumption that all points in a bucket are as close as possible to the query box is optimistic, the Box-Restarts strategy does not guarantee that the relaxed query will indeed return tuples.
4.2 Box-NoRestarts Strategy
In this approach, all tuples inside a histogram bucket are assumed to be present on a locus of maximum distance from the query box. We use the MaxDist algorithm (Figure 4(b)) to compute this maximum distance. The process we follow for finding the Box-NoRestarts relaxation distance is the same as that for the Box-Restarts approach outlined above. Since the relaxed query is guaranteed to cover all the histogram buckets at a distance less than or equal to relaxation distance, the Box-NoRestarts strategy guarantees that the relaxed query shall return at least answers. This guarantee is obtained at the cost of efficiency in that many more tuples than strictly necessary may have to be processed to find the desired answer set.
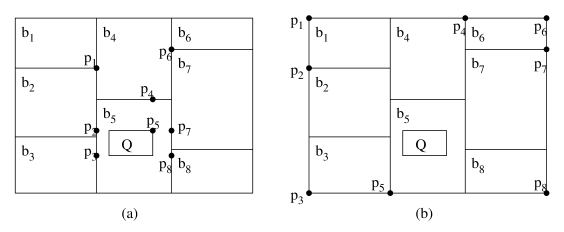
To make the above discussion concrete, sample points chosen by the MinDist and MaxDist algorithms are shown in Figures 5(a) and 5(b), respectively. In these figures, is the query box, through are the histogram buckets in the 2-dimensional space, and through are the points chosen by the algorithms. Note that while minimum distance points can be located on the query box itself (e.g., in Figure 5(a)), the maximum distance points always have to be on the corners of the histogram bucket (all in Figure 5(b)).
4.3 Box-Dynamic Strategy
Since Box-Restarts and Box-NoRestarts represent extreme solutions, an obvious question is whether an intermediate solution that provides the best of both worlds can be devised? For this, we adopt the dynamic workload-based mapping strategy of [5], which attempts to find the relaxation distance that minimizes the expected number of tuples retrieved for a set of queries while ensuring a reduced number of restarts. This is implemented as follows: Given as a parameter such that
where and are the Box-Restarts and Box-NoRestarts distances for query , we need to dynamically find the value of that minimizes the average number of tuples retrieved for a given query workload. Since is a unidimensional function of , the golden search algorithm [20] can be utilized to estimate this optimal value of . Note that this approach requires an initial “training workload” to determine a suitable value of , which can then be used in the subsequent “production workloads”.
In the remainder of this paper, we present results only for the Box-Dynamic strategy since we found that it consistently outperformed the extreme strategies.
4.4 Relaxation Algorithm
While the Box-Dynamic strategy does reduce the likelihood of restarts, it does not completely eliminate them. To ensure that we do not get into a situation where there are repeated restarts of a given query, we follow the strategy that if the Box-Dynamic strategy happens to fail for a particular query, then we immediately resort to the conservative Box-NoRestarts strategy – that is, all queries are relaxed with at most one restart. The complete set of steps of the SAUNA relaxation algorithm is shown in Figure 6.
| { |
| 1 = estimateCardinality(); |
| 2 if |
| 3 = relaxBoxDynamic(); |
| 4 numAnswers = execute(); |
| 5 if numAnswers return the nearest answers; |
| 6 else |
| 7 = relaxNoRestart(); |
| 8 execute(); |
| 9 else |
| 10 numAnswers = execute(); |
| 11 if numAnswers return all answers; |
| 12 else |
| 13 = numAnswers; |
| 14 go to Step 3; |
| } |
4.5 Handling Categorical Attributes
An implicit assumption in the discussion so far was that all attributes are either continuous or discrete with inherent ordering among the values. In practice, however, some of the dimensions may be categorical in nature (e.g., color in an automobile database), without a natural ordering scheme. We now discuss how to integrate categorical attributes into our relaxation algorithm.
In the prior literature, we are aware of two techniques that address the problem of clustering in categorical spaces – the first approach is based on similarity [14] and the second is based on summaries[12]. While both techniques can be used in our framework to calculate distances, we restrict our attention to the former in this paper.
The similarity approach works as follows: Greater weight is given to “uncommon feature-value matches” in similarity computations. For example, consider a categorical attribute whose domain has two possible values, and . Let occur more frequently than in the dataset. Further, let and be tuples in the database that contain , and let and be tuples that contain . Then the pair is considered to be more similar than the pair , i.e., ; in essence, tuples that match on less frequent values are considered more similar.
Quantitatively, similarity values are normalized to the range [0,1]. The similarity is zero if two tuples have different values for the categorical attribute. If they have the same value , then the similarity is computed as follows:
where is frequency of occurrence of value , is the number of tuples in the database, and MoreSim(v) is the set of all values in the categorical attribute domain that are more similar or equally similar as the value (i.e., they have smaller frequencies).
We cannot directly use the above in our framework since our goal is to measure distance, not similarity. At first glance, the obvious choice might seem to be to set distance similarity. But this has two problems: Firstly, tuples with different values in the categorical attribute will have a distance of 1. Secondly, tuples with identical values will have a non-zero distance. Both these contradict our basic intuition of distance.
Therefore, we set the definition of distance as follows: If two tuples have the same attribute value, then their distance is zero. Tuples with different values will have distances based on the frequencies of their attribute values. The more frequent the values, the less is the distance. For example, if the categorical attribute has values , and in decreasing order of frequencies, , since is more frequent than . In general, given tuples with values and , we can quantitatively define
5 Experimental Results
5.1 Experimental Settings
We used a variety of synthetic and real-world data sets to evaluate SAUNA – these datasets are the same as those used in [5]. The real-world data sets consisted of the US census data set ( tuples) and the Forest data set ( tuples) obtained from [25]. We selected from these data sets the same set of attributes as [5]. The synthetic data consisted of the Gauss and Array data sets, each containing tuples. The Gauss data sets [20] were generated using predetermined number of overlapping multidimensional gaussian bells. Each bell was parameterized by the variance and zipfian parameter. The Array data sets were generated using zipfian distribution [26] for frequency of data values along each attribute. The value sets of each attribute were generated independently. The values of zipfian parameter for both these data sets were chosen to be and .
All the experiments were performed using multidimensional equi-depth histograms [17], as they are both accurate and simple to implement. Further, an -dimensional unclustered concatenated-key -tree multidimensional index covering all the query attributes was built over each data set.
The query workload consists of queries with the number of range dimensions varying from 2 to 4, which is typical of many Web applications. The specific queries were generated by moving a query template over the entire domain space. The size of each query template was assigned so as to ensure that the complete domain space was covered by a hundred queries. This query density was sufficient to ensure that most queries suffered from the problem of too few answers and therefore required relaxation. All results we report are averages for this set of hundred queries.
Besides different datasets, we also evaluated the performance of SAUNA with respect to (a) varying the number of buckets in the histogram; (b) varying , the desired result cardinality; (c) varying the skew in the data; and, (d) varying the distance metric. To serve as comparative yardsticks for SAUNA’s performance, we used two benchmarks:
- Sequential (SEQ)
-
: In this strategy, a sequential scan of the database is made in order to produce a sorted list of the tuples w.r.t. their distance from the query box, after which the top tuples are returned.
- Optimal (OPT)
-
: This strategy refers to a hypothetical optimal relaxation strategy which produces the minimally relaxed query that contains the desired answer set. Note that the minimum bounding hyper-rectangle enclosing the nearest tuples of a query box is not guaranteed to return answers only and often returns more than answers. Further, it is not possible for any relaxation technique, without observing the actual data tuples, to retrieve tuples equal to OPT tuples. In our experiments, the answers for OPT were found through an offline complete scan of all the data tuples.
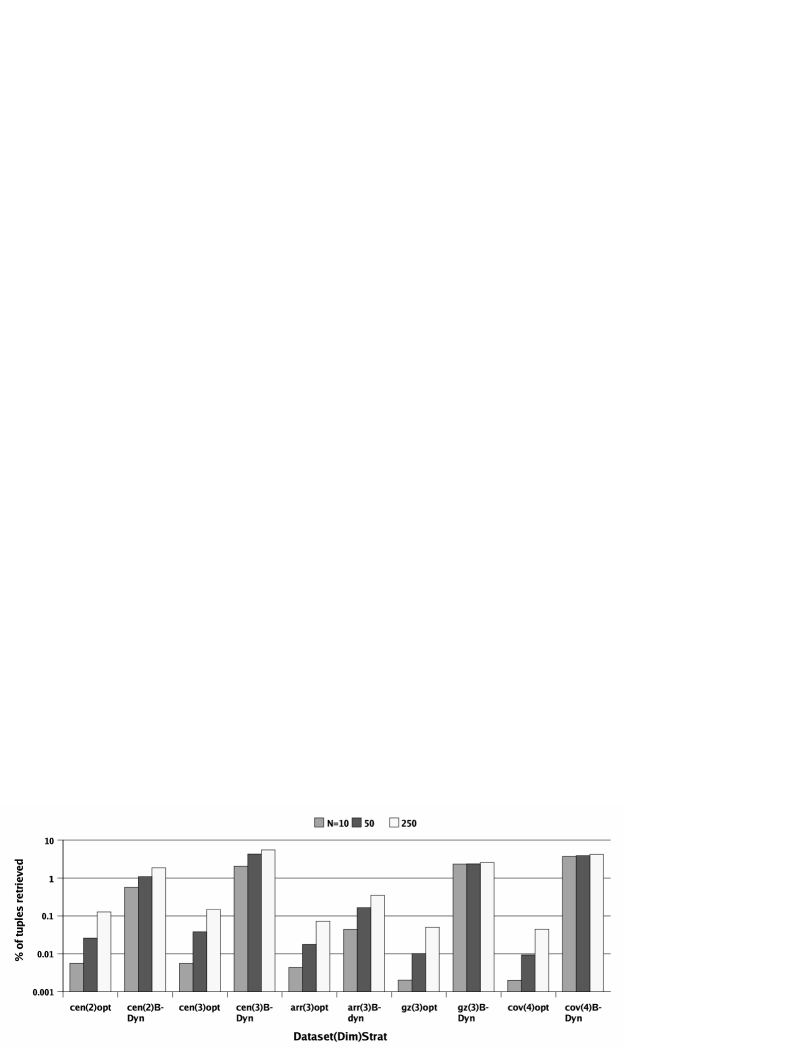
In the following experimental descriptions, the labels in the X-axis of the graphs are of the form , where: is the name of the dataset – “cen” refers to the Census data sets, “gz” refers to the Gauss data sets, “arr” refers to the Array data sets, and “cov” refers to the Forest data set; is the number of dimensions of the data; and is the relaxation strategy – where “opt” indicates the optimal values and “B-dyn” refers to the Box-dynamic strategy. For all the results, unless otherwise mentioned, the default settings were zipfian parameter , number of dimensions , number of desired answers , Aspect distance metric and number of histogram buckets . Finally, the Box-dynamic strategy (see Section 4.3) is used for SAUNA relaxation in all the experiments presented here. Our experiments were conducted on a Pentium IV machine running the Windows 2000 operating system.
5.2 Experiment 1: Basic SAUNA performance
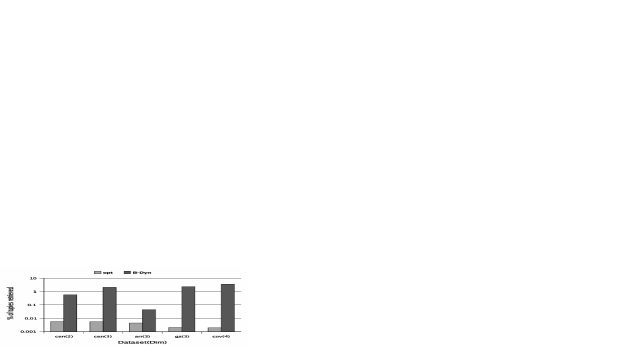
The performance of SAUNA and OPT on the various datasets for the default parameter settings is shown in Figure 7 with respect to the number of tuples retrieved (note that the Y-axis is shown on a log scale). The first point to observe here is that for all the datasets, SAUNA requires processing less than 4% of the tuples – in fact, for the census and array datasets they are less than . Secondly, note that there is quite a substantial gap between the optimal performance and that of SAUNA. This is due to the fact that SAUNA has to depend on statistical information that is limited by a tight memory budget (only 256 histogram buckets, consuming around 5KB memory, were used in this experiment).
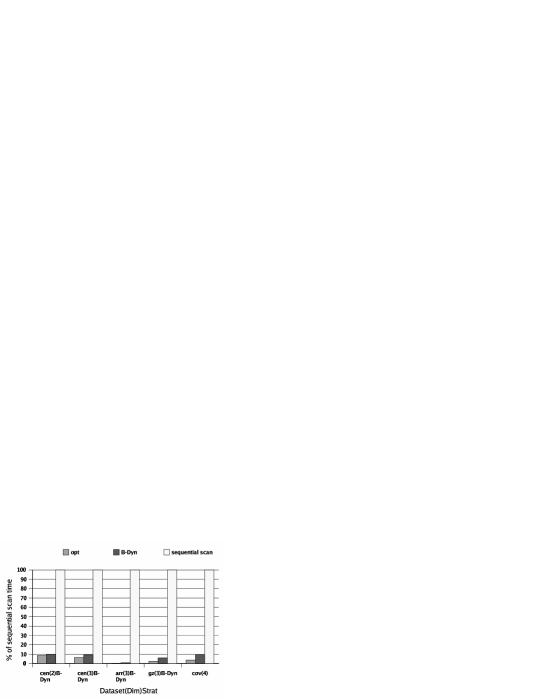
In Figure 8, we show the running times of SAUNA and OPT strategy(excluding the time required to find the optimal relaxed query), normalized to the execution time of SEQ, for the various datasets. The first point to note here is that the SAUNA execution times are below of the sequential scan time for all the datasets. Secondly, for the census and array datasets the SAUNA times are close to that of OPT, and even for the other datasets the difference is small.
The execution time figures clearly indicate the efficiency of SAUNA w.r.t. the optimal strategy. Again, it should be noted that it is not the relaxation algorithm, but the quality of the histograms (the type and number of buckets) that affect the efficiency of SAUNA as compared to the optimal in terms of number of tuples retrieved or the execution time. By increasing number of histogram buckets, we expect that SAUNA would perform closer to the optimal.
Finally, in order to illustrate the usefulness of SAUNA, we compared it against a model of a user’s (manual) relaxation session. Although each user is likely to have her own relaxation strategy, we choose the following simple model to serve as an indicator of the potential of automated relaxation: The user’s performance is measured as the total execution time of a sequence of queries, beginning with the original query, which is relaxed by in each dimension ( in each direction) after each iteration until the optimal relaxation is achieved.
When the execution time of SAUNA was compared against the above MANUAL procedure, we obtained Table 1. We see in this table that SAUNA outperforms the MANUAL approach by a substantial factor time-wise. Note further that these numbers are extremely conservative since they completely ignore the high latencies (i.e., from the network, Web server and back-end database) that are involved in submitting a sequence of queries. Finally, observe that even though the ranges of the queries were as large as of the domain in each dimension, they required numerous iterations to reach the desired value. It is likely that users faced with such situations would prematurely terminate their interaction with the Web service out of frustration.
| Dataset | cen(2) | cen(3) | arr(3) | gz(3) | cov(4) |
|---|---|---|---|---|---|
| Manual Iterations | 112 | 129 | 23 | 116 | 16 |
| ManualTime/SaunaTime | 11 | 9 | 1.2 | 3.5 | 2 |
5.3 Experiment 2: Varying Number of Histogram Buckets
In this experiment, we investigated the performance improvements that could be obtained if our tight memory budget for statistical information was somewhat relaxed. In particular, we varied the memory budget from the default 5 KB to about 100 KB.

The results of this experiment are shown in Figure 9. It can be clearly seen here that the number of tuples retrieved approaches optimal values with increasing number of buckets. This supports our claim that SAUNA is limited by the quality of histogram statistics only.
5.4 Experiment 3: Varying N
We now move on to evaluating the effect of the choice of , the desired answer cardinality, on the performance of SAUNA. The performance for values of is shown in Figure 10. We see here that, in most cases, the cost does not increase considerably with increasing values of . This is because as increases, the effective accuracy of the histogram becomes better and better, and therefore there is lesser wasted effort.
The problems of dealing with too many and too few answers have been addressed in many different contexts. In the information retrieval literature, various techniques have been proposed to both relax and constrain keyword-based queries (see e.g., [3]). Many proposals for dealing with these problems for more structured queries can be found in the database literature [11, 16, 6, 7, 10, 8, 5].
Recently, significant attention has been devoted to the evaluation of Top-N queries. Top-N queries arise in many applications where users are willing to accept non-exact matches that are close to their specification. The answers to such queries consists of a ranked set of the N tuples in the database that best match the selection condition. When a query returns too many answers, an interesting problem is how to avoid processing data that will not contribute to the final Top-N results. Carey and Kossmann [6, 7] proposed new operators to improve the efficiency of Stop-After N type queries. Fagin [10] addressed the problem of finding Top-N matches for queries that combine information from multiple systems that may have different semantics.
Chaudhuri et al [8] discuss the problem of evaluating Top-N equality selection queries that return too few answers. They propose distance metrics for equality selection queries and present histogram-based query relaxation strategies to automatically relax such queries and return the desired number of answers. They carry forward their work in [5], where they introduce a dynamic workload-aware strategy for processing Top-N equality queries. Their work differs from ours essentially in the type of queries they support – whereas their work is limited to equality selection queries, SAUNA supports the more general class of range queries. Chen and Ling [9] handle the same problem as [8], but using sampling as an estimation technique. They show that, unlike histograms, sampling is quite efficient and effective when the number of dimensions is large.
6 Conclusions
In this paper, we proposed SAUNA, a novel server-based framework for automated query relaxation that improves the efficiency and efficacy of query exploration over large and unknown data spaces. Unlike previous approaches that are limited to point queries, SAUNA is able to relax multi-dimensional range queries. Through the use of an intuitive range-query-specific distance metric, SAUNA returns high-quality answers that are closest to the user-specified query box. In addition, since histograms are used for query size estimation, the SAUNA framework can be easily integrated with commercial RDBMS that support histograms. We also showed how categorical attributes can be naturally integrated into this framework.
Our experimental results indicate that SAUNA significantly reduces the costs associated with exploratory query processing, and in fact, often compare favorably with the optimal-sized relaxed query (obtained through off-line processing). Further, these improvements are obtained even when the memory budget for storing statistical information is extremely limited. Specifically, we found that even with as low a memory budget as 5 KB, SAUNA was able to provide satisfactory relaxation retrieving less than 10% of the tuples in the database and taking less than 10% of the time taken by SEQ. We also showed how it provides significant benefits of up to an order of magnitude in execution time as compared to user-driven manual relaxation.
There are two main directions we intend to pursue in future work:
- •
-
•
Currently, when a restart is required, relaxation is applied and the new relaxed query is executed. Note that this leads to redundant work, as all answers for previous query are derived again. For future work, we intend to investigate query splitting techniques (see e.g., [23]) to try and execute only the difference query.
References
- [1] 64K Inc. DBGuide introduction and technology overview, 1997.
- [2] A. Aboulnaga and S. Chaudhuri. Self tuning histograms: Building histograms without looking at data. In Proc. of SIGMOD, pages 181–192, 1999.
- [3] R. A. Baeza-Yates and B. A. Ribeiro-Neto. Modern Information Retrieval. ACM Press/Addison-Wesley, 1999.
- [4] M. K. Bergman. The deep web: Surfacing hidden value (white paper). Journal of Electronic Publishing, 7(1), August 2001.
- [5] N. Bruno, S. Chaudhuri, and L. Gravano. Top-k selection queries over relational databases: Mapping strategies and performance evaluation. ACM TODS, 27(2), 2002.
- [6] M. Carey and D. Kossmann. On saying ”enough already!” in sql. In Proc. of SIGMOD, pages 219–230, 1997.
- [7] M. Carey and D. Kossmann. Reducing the braking distance of an sql query engine. In Proc. of VLDB, pages 158–169, 1998.
- [8] S. Chaudhuri and L. Gravano. Evaluating top-k selection queries. In Proc. of VLDB, pages 397–410, 1999.
- [9] C.-M. Chen and Y. Ling. A sampling-based estimator for top-k query. In Proc. of ICDE, pages 617–627, 2002.
- [10] R. Fagin. Combining fuzzy information from multiple systems. In Proc. of PODS, pages 216–226, 1996.
- [11] T. Gaasterland, P. Godfrey, and J. Minker. Relaxation as a platform for cooperative answering. Journal of Intelligent Information Systems, 1(3-4):293–321, 1992.
- [12] V. Ganti, J. Gehrke, and R. Ramakrishnan. Cactus - clustering categorical data using summaries. In Proc. of KDD, pages 73–83, 1999.
- [13] I. Gradshteyn and I. Ryzhik. Tables of Integrals, Series, and Products. Academic Press, 2000.
- [14] C. Li and G. Biswas. Unsupervised learning with mixed numeric and nominal data. IEEE Trans. on Knowledge and Data Eng., 14(4):673–690, 2002.
- [15] Y. Matias, J. Vitter, and M. Wang. Wavelet-based histograms for selectivity estimation. In Proc. of SIGMOD, pages 448–459, 1998.
- [16] A. Motro. VAGUE: A user interface to relational databases that permits vague queries. ACM Transactions on Office Information Systems, 6(3):187–214, 1988.
- [17] M. Muralikrishna and D. J. DeWitt. Equi-depth histograms for estimating selectivity factors for multi-dimensional queries. In Proc. of SIGMOD, pages 28–36, 1998.
- [18] V. Poosala and Y. Ioannidis. Selectivity estimation without the attribute value independence assumption. In Proc. of VLDB, pages 486–495, 1997.
- [19] V. Poosala, Y. Ioannidis, P. Haas, and E. Shekita. Improved histograms for selectivity estimation of range predicates. In Proc. of SIGMOD, pages 294–305, 1996.
- [20] W. H. Press, B. P. Flannery, S. A. Teukolsky, and W. T. Vetterling. Numerical Recipes in C : The Art of Scientific Computing. Cambridge University Press, 1993.
- [21] J. C. Shafer and R. Agrawal. Continuous querying in database-centric web applications. Computer Networks, 33(1-6):519–531, 2000.
- [22] B. Shneiderman, D. Byrd, and B. Croft. Clarifying search: A user interface framework for text searches. DLib Magazine, Jan. 1997.
- [23] K. Tan, C. Goh, and B. Ooi. On getting some answers quickly, and perhaps more later. In Proc. of ICDE, pages 32–39, 1999.
- [24] Travelocity. http://www.travelocity.com.
-
[25]
UCI knowledge discovery in databases archive.
http://kdd.ics.uci.edu/summary.data.type.html. - [26] G. Zipf. Human behaviour and the principle of least effort. Addison-Wesley, 1949.