Debugging Tool for Localizing Faulty Processes in Message Passing Programs
Abstract
In message passing programs, once a process terminates with an unexpected error, the terminated process can propagate the error to the rest of processes through communication dependencies, resulting in a program failure. Therefore, to locate faults, developers must identify the group of processes involved in the original error and faulty processes that activate faults. This paper presents a novel debugging tool, named MPI-PreDebugger (MPI-PD), for localizing faulty processes in message passing programs. MPI-PD automatically distinguishes the original and the propagated errors by checking communication errors during program execution. If MPI-PD observes any communication errors, it backtraces communication dependencies and points out potential faulty processes in a timeline view. We also introduce three case studies, in which MPI-PD has been shown to play the key role in their debugging. From these studies, we believe that MPI-PD helps developers to locate faults and allows them to concentrate in correcting their programs.
Key Words.:
parallel processing; message passing; debugging; fault localization0309027127
Masao Okita et al.Debugging Tool for Localizing Faulty Processes in Message Passing Programs
1
Graduate School of Information Science and Technology,
Osaka University
1-3 Machikaneyama,
Toyonaka,
Osaka 560-8531,
Japan
\extra1E-mail: {m-okita,ino,hagihara}@ist.osaka-u.ac.jp
1 Introduction
In recent years, cluster/grid computing Buy (99); FK (98) is emerging as a cost-effective methodology for high performance computing. The message passing paradigm Mes (94) is a widely employed programming paradigm that gives us efficient parallel programs on these computing environments.
However, debugging message passing programs is usually time-consuming, since we have to investigate a large amount of debugging information compared to sequential programs. Furthermore, once a process terminates with an unexpected error MSR (77), the terminated process can propagate the error to the rest of processes through communication dependencies. For example, if a process terminates before sending an intended message, the receiver process that has no original fault also terminates, since it fails to receive the expected message. This error propagation makes it complicated to locate the hidden faults from a number of observed errors.
To give developers valuable insights for debugging, a number of debugging tools have been developed for message passing programs. Post-mortem performance debuggers such as ParaGraph HE (91), ATEMPT KGV (96), XMPI LAM (02), and Vampir Pal (99) visualize detailed timeline view of communications, so that developers can intuitively understand program behaviors.
Source-level debuggers such as TotalView Etn (02), MPIGDB BGL (00), and CDB WCS (02) allow stepwise execution of programs. TotalView also has a facility for visualizing, named Message Queue Graph (MQG), which shows the states of the pending send and receive operations. MPIGDB is based on a sequential debugger, GDB SPS (02), and allows developers to broadcast terminal input to all GDB processes attached to computing processes. CDB also provides a similar debugging environment by employing GDB at its lower layer.
Fault localization JHS (02) is another approach for debugging programs. Relative debugging HJ (00); WA (01) is a kind of fault localization for programs that have been ported from sequential to parallel architectures or between different parallel architectures. It dynamically compares data between two executing programs, so that can locate errors in the compared programs. In NBDK (96), Netzer et al. have pointed out that unforeseen consequences of bugs can cause messages to arrive in unexpected orders. Their algorithm dynamically locates errors by detecting unintended nondeterminism, or race conditions.
Process grouping Kra02b ; Kun (93); SNdK (00) is a fundamental technique for scalable visualizing and debugging. DeWiz Kra02a ; Kra02b aims at identifying closely related processes and reducing the amount of trace data. Given a specific process, DeWiz isolates the related processes according to the accumulated length of transmitted messages.
Thus, a number of tools provide useful debugging functions. However, developers still suffer for selecting the original error from a number of observed errors, including original and propagated errors. Once the original error is given to developers, they can immediately investigate faults by using existing debuggers and concentrate in correcting them.
In this paper, we propose a novel debugging tool, named MPI-PreDebugger (MPI-PD), for localizing faulty processes in message passing programs. Current MPI-PD supports programs written using the Message Passing Interface (MPI) standard Mes (94) and focuses on faults that terminate program execution. MPI-PD aims at reducing developers’ workloads required for localizing faulty processes in timeline visualization.
To achieve this, MPI-PD dynamically checks communication errors in accordance with the error definition in a program execution model. If MPI-PD observes any communication errors, it then generates a trace file, backtraces communication dependencies and points out potentially faulty processes in a timeline view. Thus, MPI-PD reduces the amount of debugging information before developers visualize and investigate it by using performance debuggers and source-level debuggers.
The rest of this paper is organized as follows. Section 2 formally characterizes communication errors in MPI programs and makes clear the differences among faults, errors, and failures. Section 3 gives an algorithm for localizing faulty processes in a given trace file while Section 4 presents MPI-PD, which implements the proposed algorithm. Section 5 introduces three case studies assisted by MPI-PD. At last, Section 6 concludes this paper.
2 Modeling Behavior of Message Passing Programs
This section shows a definition of communication errors in MPI programs. We define it by extending the program execution model described in NM (92).
2.1 Event graph: program execution model
An execution of a message passing program is defined as a directed graph, , where represents a finite set of events while represents the happened-before relation Lam (78) defined over NM (92). In the following, we call this directed graph the event graph Kra02a .
An event in this context represents the execution instance of a set of consecutively executed statements in some process NM (92). Any event is observed during a program execution. In the following, let be the event on process .
The happened-before relation shows how events potentially affect one another Lam (78). This relation is defined as the irreflexive transitive closure of the union of two other relations: . Here, and respectively represent the sequential order relation and the concurrent order relation as follows Kra02a :
(a) Blocking communication (b) Nonblocking communication
- Sequential order relation, :
-
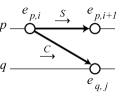
As illustrated in Figure 1(a), the sequential order of events, , defines that the event on any sequential process occurred before the event .
- Concurrent order relation, :
-
As illustrated in Figure 1(a), the concurrent order of events, , defines that the event on any process occurred directly before the event on another process , if is the sending of a message by process and is the receipt of the same message by another process .
Although the event graph is a sufficient model for visualizing the behavior of message passing programs, we have to add one relation to this graph to characterize the errors relevant to nonblocking communications Mes (94). This additional relation exists between a pair of events caused by the initiation and the completion of a nonblocking send/receive operation:
- Nonblocking order relation, :
-
As illustrated in Figure 1(b), the nonblocking order relation, , shows the order in which nonblocking messages are initialized and then completed: defines that , if is the send/receipt initiation of a message by process and is the completion of the same message by the same process .
In our extended event graph, the happened-before relation is redefined as .
2.2 Fault, error, and failure
The concepts of faults, errors, and failures MSR (77) used in our discussion are briefly explained as follows: a program with a bug has a fault in itself and an active fault causes an error. If the error fails to be corrected, it causes a failure.
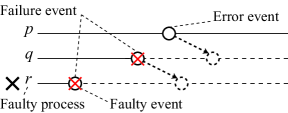
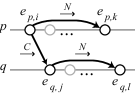
Figure 2 shows an example that interprets these three concepts on events. In this example, process is the faulty process, since it executes a faulty statement and causes a faulty event. It also terminates against developer’s intension, so that causes a failure event. After this, process fails to pass a message to process , so that causes an error event, resulting in a failure event (since it terminates). Process also faces with a communication error, however, its error handler avoids its failure.
Let denote whether event causes a failure or not. Since failure events have no successor and occur when programs unexpectedly terminate, is defined as follows:
2.3 Communication errors in MPI programs
In MPI programs, an event causes a communication error, if it satisfies one of the following two conditions: isolated or truncated, defined as follows;
-
•
Isolated events.
-
–
An event () is called an isolated send (receive) event, if such that , respectively Kra02a .
-
–
An event () is called an isolated send/receive initiation (completion) event, if such that , respectively.
-
–
-
•
Truncated events.
-
–
Two events and are called truncated events, if and , where and represent the length of the send buffer specified in event and the receive buffer specified in event , respectively.
-
–
Isolated events are caused under the following two situations. One is the mismatch of occurred events and the other is the non-occurrence of expected events. First, occurred but mismatched events can trigger off an error propagation. For example, an MPI routine call with an invalid tag/communicator Mes (94) or an invalid source/destination rank fails to pass the intended message. Similar mismatch can occur between the initiation and the completion of a nonblocking send/receive operation. Next, expected but non-occurred events cause serious problems, since they can propagate errors through all processes. For example, if a process terminates before sending an intended message, the receiver process that has no original fault also terminates, since it fails to receive the expected message. Thus, isolated events propagate errors similarly to the domino effect, leading to a program failure.
A pair of truncated events indicates an occurrence of an overflow at the receive buffer. In a strict sense, a message should be passed between the send and the receive operations with the same buffer length Kra02a . However, as MPI does, we also permit passing a message between events and such that and . In practice, some nondeterministic applications require this flexibility, because the receiver processes in these applications want to receive a variable length message at one receive operation. Therefore, we permit passing a message between events with different buffer length except for truncated events.
Thus, the error of an event can depend on that of an event on another process. In this paper we call that processes and have a communication dependency if the error of event on process determines that of event on another process .
Here notice that MPI has four communication modes Mes (94): the standard, buffered, synchronous, and ready modes. These modes differ by when they solve the matching of outgoing messages. For example, when two processes send a message to each other, they fall into a deadlock in the synchronous mode while they are deadlock-free in the buffered mode. Therefore, we have to check communication errors without destroying these communication semantics in the target programs. That is, outgoing messages have to be checked in the same mode as their original mode. The error detection mechanism employed in MPI-PD is presented later in Section 4.2.
For collective communications, since they can be implemented by using point-to-point communications, we repeatedly apply the above error definition to all of the point-to-point messages that compose the collective communication.
In the following, let denote whether event is isolated event or not. Let also denote whether events and are truncated events or not.
3 Algorithm for Localizing Faulty Processes
This section presents the details of our proposed algorithm. We describe how to localize faulty processes in a given event graph. We assume here that the event graph is already generated by the error detection mechanism presented later in Section 4.2.
1. Algorithm LocalizeFaultyProcesses(, , , )
2. // Input: , a set of process ranks.
3. // , an event graph.
4. // Output: , a set of localized faulty process ranks.
5. // , a set of failure events on each processes.
6. begin
7. // (1) Identify failure events occurred on each processes.
8. ;
9. foreach () begin
10. if such that exists. then
11. else
12. endif
13. ;
14. end
15. // (2) Localize faulty processes by recursive analysis.
16. ;
17. foreach () begin
18. if (BacktraceCommDep(, ) 0) then ; // Process has faults.
19. end
20. end
21. // A recursive function that backtraces communication dependencies from process .
22. function BacktraceCommDep(, )
23. begin
24. if (() (() && ())) then return 0; // is already traced or valid.
25. else if ( is a calculation event) then return –1; // (a) Calculation fault.
26. else if () then return –2; // (b) Non-occurred event.
27. else if () then return ; // (c) Deadlock or (d) Overflow.
28. endif
29. ; // Source/destination rank for
30. ; // Update the call history.
31. BacktraceCommDep(, );
32. if () then ; // Process has faults.
33. if () then ;
34. else if () then ++;
35. endif
36. return ;
37. end
(a) Calculation fault
(b) Non-occurred event
(c) Deadlock (d) Overflow
Figure 3 shows our algorithm, which requires a set of process ranks, , and an event graph, , and returns sets of localized faulty processes and the failure events on each process, and , respectively. Our algorithm consists of two stages as follows:
At the first stage, the algorithm identifies all failure events. After this stage, it localizes faulty processes by backtracing communication dependencies in a recursive manner. Our algorithm then classifies program failure into the following four situations:
- (a) Calculation fault:
-
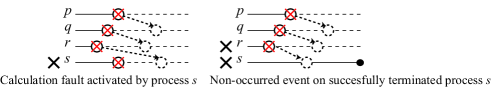
Figure 4(a) illustrates this situation. As a result of backtracing, our algorithm finds that process terminates unexpectedly and has no communication dependency to any other processes. Therefore, the algorithm determines that the faulty process is process , which causes a calculation fault.
- (b) Non-occurred event:
-
Figure 4(b) illustrates this situation, in which process has a communication dependency from but terminates successfully. In this situation, we think whether process could have sent a message redundantly or process could have missed to call a receive routine. However, it seems to be difficult to automatically identify the faulty process from processes and . Therefore, our algorithm determines that the faulty processes are both of processes and , or a process left by a normally terminated process and the terminated process.
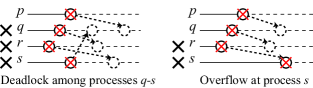
- (c) Deadlock:
-
A deadlock occurs if there exists a cyclic communication dependency. In Figure 4(c), processes , and fall into a deadlock. Our algorithm determines that the faulty processes are all the processes that participate in the deadlock.
- (d) Buffer overflow:
-
In Figure 4(d), process causes a buffer overflow. As same as situation (b), it also seems to be difficult to identify which of processes and has called an MPI routine with an invalid buffer length. Therefore, our algorithm determines that the faulty processes are both of processes and , which have a pair of truncated events.
Notice that the algorithm described in Figure 3 backtraces communication dependencies by assuming that all the source/destination ranks are valid. Therefore, if a faulty process calls an MPI routine with an invalid source/destination, this algorithm can omit the faulty process from the localized processes. We discuss this problem later in Section 5.1.
4 MPI-PreDebugger
This section presents the details of MPI-PD, including its environment for debugging and its mechanism for run-time error detection.
4.1 Overview of debugging environment
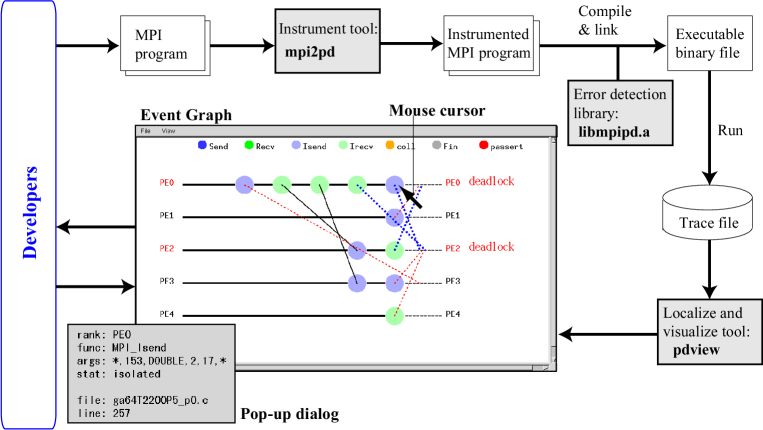
Figure 5 shows the debugging process with MPI-PD. The debugging functions in MPI-PD are implemented using the C++ language and the Ruby-GNOME toolkit Rub (02) and composed of three components: the instrument tool mpi2pd, the run-time error detection library libpdmpi.a, and the localize and visualize tool pdview.
The instrument tool mpi2pd automatically replaces all of the MPI routines in programs with instrumented MPI routines based on pattern-match rules. The instrumented routine is a combination of the original MPI routine and the run-time error detection function. After this replacement, developers have to generate the object codes by compiling their programs and the executable binary file by linking the object codes with the run-time error detection library.
The run-time error detection library checks communication errors whenever the processes call the instrumented MPI routines (see Section 4.2). If the library detects any communication error, it terminates program execution and generates a trace file. The trace file has the following information for every event observed during program execution: (1) event number, (2) process rank, (3) corresponding line in source code and its file name, and (4) corresponding MPI routine and its arguments.
Given a trace file, the visualization tool pdview allows developers to view the behavior of the terminated program, as shown in Figure 5. It visualizes the event graph, which has the process axis in vertical and the time axis in horizontal, and shows the result of the fault localization described in Section 3. In the event graph, a colored node corresponds to an event and the type of the MPI operation that caused the event decides its color. A solid line between two nodes corresponds to a successful communication while a dotted line corresponds to a failure communication.
In default mode, pdview avoids visualizing the entire event graph. It visualizes all of failure events occurred on each process and the successful events occurred directly before the failure events. Furthermore, pdview can isolate faulty processes from the event graph. Developers can visualize an isolated event graph by selecting process whichever they want. In addition to these visualization functions, pdview also shows following information:
-
•
Faulty processes localized by the proposed algorithm.
-
•
Failure situation selected from four situations (see Figure 4).
Furthermore, developers can investigate every visualized event. If they click the mouse on a node in the visualized event graph, then pdview pops up a dialog, which shows information (1)–(4) about the corresponding event and its error reason (isolated/truncated). This information is useful for developers to locate faults in programs. After this fault localization, source-level debuggers can effectively assist developers to investigate the detailed behavior of the localized part.
4.2 Mechanism for run-time error detection
MPI-PD checks the occurrence of communication errors during program execution. If it detects any errors, it generates a trace file.
To realize this, we employ three methodologies. We first discuss on the synchronous blocking send (MPI_Ssend) then others. The three methodologies are as follows:
-
•
Manager process: To generate trace files under a deadlock situation, we employ a manager process for every process . checks the value of before its responsible process executes event . We present later how to check at next paragraph. If obtains , it allows to execute event and pushes the information about into its local Event Graph . Otherwise, it detects a communication error, terminates and generates a trace file from .
-
•
Message queue: To handle nonblocking communications, we employ a message queue. For nonblocking communications, to decide the failure of completion event , we have to refer the information about its corresponding initiation event (). Therefore, for all processes , manager has its own message queue for referring to the information about the past events.
-
•
Timeout mechanism: We also employ a timeout mechanism due to the difficulty in distinguishing the valid and the invalid computation. For example, a receive event that never receive a message has to be decided as . However, it is hard for to identify whether the sender sends the message or not. That is, can send the message after heavy computation or can fall into an infinite loop. Therefore, holds a timeout time for every and decides when the time is up.
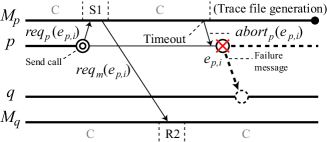
Figure 6 shows the process of run-time error detection for MPI_Ssend. In Figure 6, the manager of the sender has three states (states C, S1 and S2) and that of the receiver has four states (states C, R1, R2 and R3) as follows:

(a) Successful case (b) Failure case
- Common state for the sender/receiver:
-
State C: Timeout checking and control-message waiting. In this state, continues to check whether there exist any timeout events, until it receives any control message (ack or request messages) from or another manager. If detects a timeout event , then it decides and sends an abort request to . It also adds the failure event to and terminates. If receives a control message, then it changes its state to an appropriate state.
- States for the sender:
-
State S1: Send initiating. If receives a send request from , then it pushes the information about into with . It also checks the destination rank of and transmits a send request to the destination process’s manager, (go to state C).
-
State S2: Message sending. If receives an ack from another manager, then it searches and selects such that . It also checks whether and are truncated events.
-
•
If , decides and sends an ack to . After this acknowledgement, it deletes from , and adds both and to (go to state C).
-
•
Otherwise, decides and sends an abort request to . It also adds both and to as failure events and terminates.
-
•
- States for the receiver:
-
State R1: Receive initiating. If receives a receive request , it then searches and selects such that .
-
•
If such exists, decides that and are the matching events (go to state R3).
-
•
Otherwise, it leaves the error detection on and pushes the information about into with (go to state C).
-
•
-
State R2: Send-request receiving. If receives a request from another manager, then it searches and selects such that .
-
•
If such exists, decides that and are the matching events (go to state R3).
-
•
Otherwise, it leaves the error detection on and pushes the information about into with (go to state C).
-
•
-
State R3: Message receiving. sends an ack to . It then checks if and are truncated events.
-
•
If , then decides and sends an ack to . After this acknowledgement, it deletes () from and adds both and to (go to state C).
-
•
If , then decides and sends an abort request to . It also adds both and to as failure events and terminates.
-
•
The manager processes buffer all events until they detect an error, so that their local memory are possibly full. Our algorithm described in Figure 3 requires failure events on each process. Therefore, if local memory of is full, we allow to delete information about the oldest successful event from .
Here, recall that we have to keep the communication semantics, as explained in Section 2.3. Therefore, for the blocking buffered mode send (MPI_Bsend), we alter the sequence of error detection. That is, to keep the buffered behavior of message passing, process passes the original message immediately after sending request to its manager . This alternation omits receiving an ack from . Instead of this omission, checks an abort message from whenever it calls an instrumented MPI routine. If receives the abort message , it terminates its execution. Otherwise, it continues processing the original routine. This alteration allows to execute a few events after an original faulty event, however there is no influence on faulty process localization since identifies the faulty event correctly.
For nonblocking communications, we process states S1 and R1 at the send initiation and the receive initiation of nonblocking operations, respectively; and process send acks at the completion of the nonblocking operations. For collective communications, we can apply the same approach as for the blocking mode point-to-point routines, since the collective communications can be implemented by using those point-to-point routines.
Thus, exchanging information about every event among managers enables us to detect communication errors and generate trace files before program failure.
5 Case Studies: Debugging Message Passing Programs with MPI-PD
In this section we introduce three case studies. The aim of each study is to investigate the effectiveness of MPI-PD from the following point of view:
-
1.
Applicability: We investigated what kinds of faults are effective for MPI-PD. To do this, we applied MPI-PD to a few ten of the Gaussian programs developed by MPI beginners (see Section 5.1).
- 2.
-
3.
Usability: We investigated the usability of faulty process localization. To do this, we applied MPI-PD to a complicated program generated automatically by a parallelizing compiler YTFH (02). We also compared visualization results between proposed MPI-PD and existing TotalView Etn (02) (see Section 5.3).
| Case study | Details of program | Details of trace file | |||
|---|---|---|---|---|---|
| Developer | Employed MPI routines | ||||
| 1. Applicability | Beginner | 300 | Send, Recv, Isend, Irecv, Wait | 4 | 412 |
| 2. Scalability | Expert | 40,000 | Send, Recv, Sendrecv | 64 | 9,774 |
| 3. Usability | Compiler | 20,000 | Isend, Irecv, Waitall | 15 | 253 |
Table 1 shows a summary of the above studies. In the following, we omit “MPI_”, the prefix of MPI routines, as shown in Table 1.
In these studies we used a PC cluster with 64 symmetric multiprocessor (SMP) nodes. Each node in the cluster has two Pentium III 1GHz processors and connects to a Myrinet-2000 switch BCF+ (95). We also employed an MPI implementation, MPICH-GM Myr (02).
5.1 Study 1: Applicability of MPI-PD
In this study, we applied MPI-PD to 28 faulty programs developed by six graduate students through a practice in MPI programming. These programs solve simultaneous equations using Gaussian elimination.
| Debugging phase | Number of programs | |
|---|---|---|
| Success | Failure | |
| MPI Program execution | 13 of 28 | 15 of 28 |
| Event graph visualization | 15 of 15 | 0 of 15 |
| Faulty process localization | 12 of 15 | 3 of 15 |
We first executed the programs on our PC cluster and then visualized localization results by using MPI-PD. Table 2 shows the application results at each debugging phase.
At the execution phase, 15 of 28 programs unexpectedly terminated. As we mentioned in Section 1, since current MPI-PD focuses on faults with program failures, it failed to visualize the event graph for the remaining 13 programs that never terminated but returned incorrect results. These programs contain semantic faults such as invalid specifications of operators/variables and invalid writing to message buffers before the completion of nonblocking communications.
At the localization phase, MPI-PD successfully localized faulty processes for 12 of 15 programs while it failed to localize them for the remaining three programs. These three programs have calculation faults activated by all processes at the same statement. Therefore, every process terminated outside the instrumented MPI routines, so that their trace files contained no information about failure events. Thus, MPI-PD failed to localize their faulty processes. However, in these cases, since every process terminates without any communication dependency, error propagation is unable to occur. Therefore, developers have to investigate every process. That is, they have to investigate their programs between the last MPI routine executed in a success and the next MPI routine expected to be executed, especially where the common statements that every process executes.
The 12 programs which MPI-PD successfully localized had a variety of faults classified into following four types. Notice that MPI-PD localized not the faults but the faulty processes which activate them.
-
•
Invalid source/destination rank (six programs).
-
•
Invalid length of message buffer (three programs).
-
•
Calculation fault (two programs).
-
•
Deadlock occurred when passing long messages (one program).
We next confirmed that there was no faulty process omitted from the localized results. For all cases where invalid source/destination ranks were specified, MPI-PD pointed out deadlock processes, including the faulty process. Therefore, the deadlock processes pointed out by MPI-PD can include valid processes, so that there exists a room for improving the accuracy of localization. However, this redundancy was a little problem for the programs applied in this study. Since their faults appear on any number of processes, developers are allowed to scale down the number of processes without missing the activated faults.
5.2 Study 2: Scalable debugging with MPI-PD
We applied MPI-PD to a parallel rendering program TIH (03) implemented on 64 processes. This program has a fault in gathering and compositing rendered images generated by distributed processors. For the purpose of high-speed compositing, the developers have implemented own collective communication routines for the gather and the broadcast operations by using point-to-point routines, Send and Recv. Their collective routines are called at every compositing stage with splitting the processes into two groups. That is, given processes, each of groups performs collective communications at the stage, where .
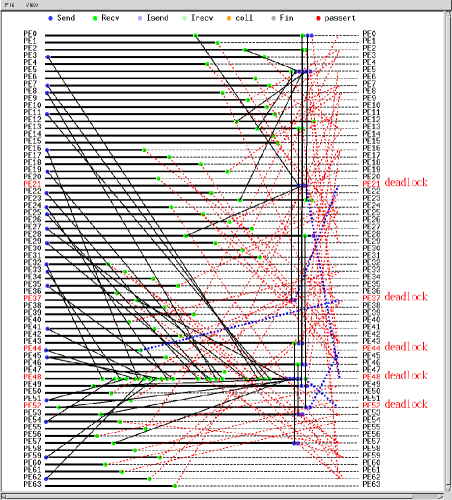
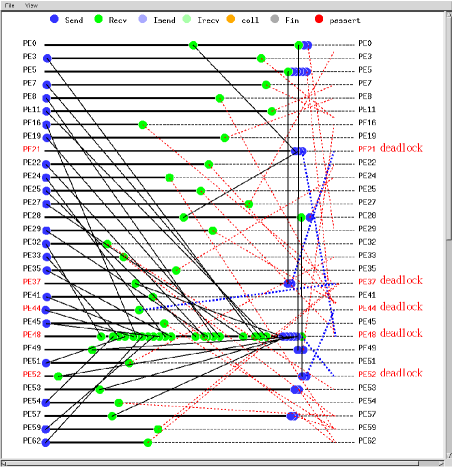
Figure 7 shows the event graph for all processes visualized by MPI-PD. While the program generates the total of 9,774 events, the visualized event graph is composed of 164 events classified into 64 failure events and 100 successful events occurred directly before the failure events. In Figure 7, MPI-PD points out five faulty processes from 64 processes: processes PE21, PE37, PE44, PE48, and PE52. It also points out that these five processes fall into a deadlock and that each of them has one failure event.
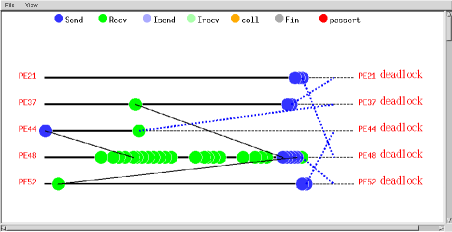
As we mentioned in Section 4.1, MPI-PD allows developers to visualize specific processes whichever they want. For example, developers can view only the deadlock processes as shown in Figure 8, so that easily know how the processes fell into the deadlock. They can also add related processes that communicated to the deadlock processes (see Figure 9), so that intuitively know process PE48 received many messages compared to the other four faulty processes: processes PE21, PE37, PE44, and PE52.
Thus, MPI-PD guided the developers to the five faulty events, so that they easily found that process PE48, the root process of a broadcast operation, called an excessive Send routine due to the lack of a break statement. Therefore, MPI-PD assists developers in scalable debugging, where the numbers of processes and events are too large for them to understand the behavior of programs.
We also indicate that the buffered send operation makes it complicated to locate faults, since this operation causes a gap between the faulty send event and the failure event. For example, when we executed the rendering program without error detection, since process PE48 pushed out messages in the buffered mode, it successfully returned from the faulty Send routine and terminated at a succeeding Recv routine. Therefore, without MPI-PD, the developers can investigate the Recv routine, which causes a non-original fault, or a fault due to error propagation. Thus, MPI-PD’s run-time error detection is necessary for handling the buffered send operation.
5.3 Study 3: Comparison with existing debuggers
To make clear the usability of fault localization, we compared MPI-PD with TotalView Etn (02) by applying them to a complicated program. This program is automatically generated by a parallelizing compiler based on a task scheduling algorithm, Scheduling with Packaged Point-to-point Communications (SPPC) YTFH (02).
The MPI program generated by SPPC consists of two layers, the calculation and the communication layers, which repeatedly appear during program execution. In the calculation layer, each process independently performs calculation without any communication. In the communication layer, it exchanges messages by calling nonblocking communication routines. Each process first calls many initiation routines, Isend and Irecv, then a completion routine, Waitall. Since the parallelizing compiler mechanically generates large-scale MPI programs, it requires a complicated work to debug them. Furthermore, since the Waitall routine completes all of initiated communications at a time, it is time-consuming to distinguish failure communications from a number of communications completed by the Waitall routine.
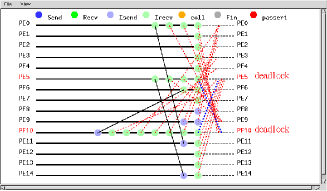
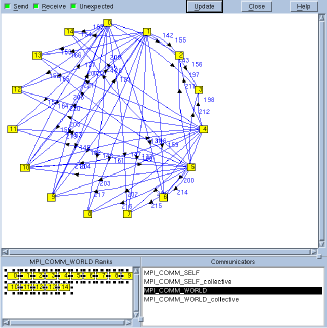
Figure 10 shows the visualizations obtained by MPI-PD and TotalView. While MPI-PD visualizes all of failure events occurred on each process and the successful events occurred directly before the failure events, TotalView shows pending sends/receives and unexpected messages CG (99); Etn (02) at an arbitrary execution step. Pending sends/receives represent the sends/receives that have been initiated but have not yet been matched. Unexpected messages represent messages that have been sent to a process but have not yet been received.
In this program, every process terminated at a call of Waitall routine. At the termination, the processes tried to complete the total of 171 nonblocking operations. For this faulty program, TotalView visualizes 50 pending receives, represented as arrows in Figure 10(b). However, it is time-consuming for the developers to investigate each of the 50 pending receives. On the other hand, MPI-PD checks the error of every communication and localizes faulty processes, so that it visualizes 34 of 171 events as shown in Figure 10(a). Since eight of 34 events are successfully communicated events, MPI-PD reduces the number of events that have to be investigated from 171 to 26 events. Furthermore, it points out that processes PE5 and PE10 fall into a deadlock. Here, processes PE5 and PE10 have three and seven error events, respectively, so that the number of events that have to be investigated is reduced further from 171 to 10 events.
With the assistance of MPI-PD, the developer has successfully debugged this program less than five minutes. He first investigated process PE5 and confirmed that it had no fault, and then process PE10. At last, he reached at the fault where an invalid source was specified at an Irecv routine.
(a) Event Graph by MPI-PD (b) Message Queue Graph by TotalView
| Function | MPI-PD | DeWiz Kra02a ; Kra02b | TotalView Etn (02) |
|---|---|---|---|
| 1. Faulty process localization | by dependency analysis | — | — |
| 2. Run-time error detection | every message | every message | every message |
| 3. Process grouping | by dependency analysis | by message length | — |
| 4. Timeline visualization | yes | yes | — |
| 5. Trace file reduction | — | yes | — |
| 6. Stepwise execution | — | — | yes |
Table 3 summarizes the difference among MPI-PD, TotalView, and DeWiz Kra02a ; Kra02b . While MPI-PD is useful to reduce events that have to be investigated, TotalView allows us to execute the target program in stepwise. DeWiz also provides an analysis using the event graph. However, DeWiz aims at identifying closely related processes and reducing the total amount of trace data. In DeWiz, by giving a specific process, then its process grouping function accumulates the length of transmitted messages for every pair of processes and isolates related processes by using a certain threshold. Therefore, developers have to decide which processes have to be specified, and this is a similar problem addressed in this paper. Furthermore, since error propagation has no relevance to message length, their message length based approach is inappropriate for the purpose of faulty process localization.
Summarizing the above discussions, DeWiz is useful to reduce the total amount of trace files and TotalView is useful to investigate the detailed behavior of programs. MPI-PD is useful to reduce the number of events that have to be investigated for debugging. Therefore, we think that appropriate combined use of these tools is a good choice for debugging message passing programs. For example, we first localized faulty processes by using MPI-PD and next investigate them in detail by using TotalView.
6 Conclusions
We have presented a novel debugging tool, named MPI-PD, for localizing faulty processes in message passing programs, aiming at reducing developers’ efforts. MPI-PD helps us to identify the source of failure from a number of observed errors by automatically checking communication errors during program execution. If MPI-PD observes any communication errors, it then generates a trace file, backtraces communication dependencies and points out potentially faulty processes in the event graph visualization.
MPI-PD reduces the amount of debugging information before visualizing and investigating it by using post-mortem performance debuggers and source-level debuggers, respectively. Therefore, we think that appropriate combined use of these tools is a good choice for debugging message passing programs.
Acknowledgements
This work was partly supported by JSPS Grant-in-Aid for Young Researchers (B)(15700030), for Scientific Research (C)(2)(14580374), JSPS Research for the Future Program JSPS-RFTF99I00903, and Network Development Laboratories, NEC. We are also grateful to the anonymous reviewers for their valuable comments.
References
- BCF+ [95] Nanette J. Boden, Danny Cohen, Robert E. Felderman, Alan E. Kulawik, Charles L. Seitz, Jakov N. Seizovic, and Wen-King Su. Myrinet: A Gigabit-per-Second Local-Area Network. IEEE Micro, 15(1):29–36, February 1995. http://www.myri.com/.
- BGL [00] Ralph Butler, William Gropp, and Ewing Lusk. A Scalable Process-Management Environment for Parallel Programs. In Proc. 7th European PVM/MPI Users’ Group Meeting, pages 168–175, September 2000.
- Buy [99] Rajkumar Buyya, editor. High Performance Cluster Computing. Prentice Hall PTR, http://www.prenhall.com/, 1999.
- CG [99] James Cownie and William Gropp. A Standard Interface for Debugger Access to Message Queue Information in MPI. In Proc. 6th European PVM/MPI Users’ Group Meeting, pages 51–58, September 1999.
- Etn [02] Etnus, LLC. TotalView Users Guide, December 2002. http://www.etnus.com/Download/TV.html.
- FK [98] Ian Foster and Carl Kesselman, editors. The Grid: Blueprint of a New Computing Infrastructure. Morgan Kaufmann, July 1998.
- HE [91] Michael T. Heath and Jennifer A. Etheridge. Visualizing the Performance of Parallel Programs. IEEE Software, 8(5):29–39, September 1991.
- HJ [00] Robert Hood and Gabriele Jost. Support for Debugging Automatically Parallelized Programs. In Proc. 4th Int’l Workshop on Automated Debugging (AADEBUG’2000), August 2000.
- JHS [02] James A. Jones, Mary Jean Harrold, and John Stasko. Visualization of Test Information to Assist Fault Localization. In Proc. 24th Int’l Conf. on Software Engineering (ICSE’02), pages 467–477, May 2002.
- KGV [96] D. Kranzlmüller, S. Grabner, and J. Volkert. Event Graph Visualization for Debugging Large Applications. In Proc. ACM SIGMETRICS Symp. on Parallel and Distributed Tools (SPDT’96), pages 108–117, May 1996.
- [11] D. Kranzlmüller. DeWiz – Event-based Debugging on the Grid. In Proc. 10th Euromicro Workshop on Parallel, Distributed and Network-based Processing (EuromicroPDP’02), pages 162–169, January 2002.
- [12] D. Kranzlmüller. Scalable Parallel Program Debugging with Process Isolation and Grouping. In Proc. 16th Int’l Parallel and Distributed Processing Symp. (IPDPS’02), April 2002.
- Kun [93] Thomas Kunz. Process Clustering for Distributed Debugging. In Proc. 3rd ACM/ONR Workshop on Parallel and Distributed Debugging (WPDD’93), pages 75–84, May 1993.
- Lam [78] Leslie Lamport. Time, Clocks, and the Ordering of Events in a Distributed System. Communications of the ACM, 21(7):558–565, July 1978.
- LAM [02] LAM / MPI. XMPI – A Run/Debug GUI for MPI, 2002. http://www.lam-mpi.org/software/xmpi/.
- Mes [94] Message Passing Interface Forum. MPI: A Message-Passing Interface Standard. Int’l J. of Supercomputing Applications and High Performance Computing, 8(3/4):159–416, 1994.
- MSR [77] P.M. Melliar-Smith and B. Randell. Software Reliability: The Role of Programmed Exception Handling. In Proc. ACM Conf. on Language Design and Reliable Software (LDRS’77), pages 95–100, March 1977.
- Myr [02] Myricom, Inc. MPICH over GM, http://www.myri.com/scs/index.html, 2002.
- NBDK [96] Robert H.B. Netzer, Timothy W. Brennan, and Suresh K. Damodaran-Kamal. Debugging Race Conditions in Message-Passing Programs. In Proc. ACM SIGMETRICS Symp. on Parallel and Distributed Tools (SPDT’96), pages 31–40, May 1996.
- NM [92] Robert H.B. Netzer and Barton P. Miller. Optimal Tracing and Replay for Debugging Message-Passing Parallel Programs. In Proc. High Performance Networking and Computing Conf. (SC92), pages 502–511, November 1992.
- Pal [99] Pallas GmbH. Vampir 2.0 User’s Manual, Document Number VA20-UG-12, June 1999. http://www.pallas.com/e/products/vampir/.
- Rub [02] Ruby-GNOME. http://ruby-gnome.sourceforge.net/, 2002.
- SNdK [00] Denise Stringhini, Philippe Navaux, and Jacques Chassin de Kergommeaux. A Selection Mechanism to Group Processes in a Parallel Debugger. In Proc. 2000 Int’l Conf. on Parallel and Distributed Processing Techniques and Applications (PDPTA’00), June 2000.
- SPS [02] Richard Stallman, Roland Pesch, and Stan Shebs. Debugging with GDB:The GNU Source-Level Debugger. Free Software Foundation, January 2002.
- TIH [03] Akira Takeuchi, Fumihiko Ino, and Kenichi Hagihara. An Improvement on Binary-Swap Compositing for Sort-Last Parallel Rendering. In Proc. 18th ACM Symp. on Applied Computing (SAC 2003), pages 996–1002, March 2003.
- WA [01] Gregory R. Watson and David Abramson. Parallel Relative Debugging for Distributed Memory Applications: A Case Study. In Proc. 2001 Int’l Conf. on Parallel and Distributed Processing Techniques and Applications (PDPTA’01), June 2001.
- WCS [02] Xingfu Wu, Qingping Chen, and Xian-He Sun. Design and Development of a Scalable Distributed Debugger for Cluster Computing. Cluster Computing, 5(4):365–375, October 2002.
- YTFH [02] Yuuki Yamamoto, Lin Tan, Noriyuki Fujimoto, and Kenichi Hagihara. A Task Scheduling Algorithm with Message Packaging Method for Point-to-point Communications. IPSJ Trans. on Mathematical Modeling and Its Applications, 43(SIG7):29–43, September 2002. (in Japanese).