Timestamp Based Execution Control for C and Java Programs
Abstract
Many programmers have had to deal with an overwritten variable resulting for example from an aliasing problem. The culprit is obviously the last write-access to that memory location before the manifestation of the bug. The usual technique for removing such bugs starts with the debugger by (1) finding the last write and (2) moving the control point of execution back to that time by re-executing the program from the beginning. We wish to automate this. Step (2) is easy if we can somehow mark the last write found in step (1) and control the execution-point to move it back to this time.
In this paper we propose a new concept, position, that is, a point in the program execution trace, as needed for step (2) above. The position enables debuggers to automate the control of program execution to support common debugging activities. We have implemented position in C by modifying GCC and in Java with a bytecode transformer. Measurements show that position can be provided with an acceptable amount of overhead.
Key Words.:
debug, debugger, reverse execution, Java bytecode transformation030902787
Kazutaka Maruyama et al.Timestamp Based Execution Control for C and Java Programs
1 Dept. of Mechano-Informatics, Grad. School of Information Science and Technology, The University of Tokyo, Japan
2 Dept. of Information and Communication Engineering, The University of Electro-Communications, Japan
1E-mail:kazutaka@acm.org \extra2E-mail:terada@ice.uec.ac.jp
1 Introduction
Studies about formal system specification with mathematical notationInc (92), automatic testing by semanticsMey (91), and so on, have continued for long years. However, these projects still evolve and cannot be used for real problems and are not enough to exterminate all bugs. Programmers must debug programs by hand.
In debugging, we usually use debuggers to observe the behavior of programs. Debuggers have various functions supported by hardware and operating systemRos (97), but the functions offer too low-level commands. Operations that programmers want to do in debugging are more abstract than raw commands of debuggers, and they must break down their operations into them. Programmers have to waste energy thinking about how to use debugger commands while they examine the behavior of programs because of a gap between what debuggers can do and what programmers need. On the other hand, there are some patterns of the operations which programmers want debuggers to do. To automate them is useful for efficient debugging.
In this paper, we propose a new idea position as a base technique of the execution control useful for automating some typical debugging operations that programmers want to do. In order to implement it, we introduce a counter timestamp which increases whenever the control point jumps backward and we insert the codes for updating timestamp into programs to be debugged. We describe the implementation details for C and Java programs. Overhead measurements of programs with the updating codes are also included.
The rest of this paper is organized as follows. Section 2 proposes the notion of “position” and describes the advantages of its applications. Section 3 and 4 describe the implementation details for C and Java respectively, along with the result of overhead measurements. Section 5 describes another representation of position without timestamp and the difference between the two. Section 6 discusses the relevance to other works. Section 7 and 8 describe conclusion and future work.
2 Position: New Idea for Execution Control
Figure 1 shows the structure of our proposal. In this section, we first propose the idea of the position and introduce “timestamp” as its base. Next, we implement a simple application of the position, “dynamic breakpoint”. Finally, we describe three applications of the position, “bookmarking positions”, “reverse watchpoint” and “binary search method”.

2.1 Timestamp and Position
We introduce a new idea, position, in order to specify one point in the program trace, the series of statements executed in order of time.111 The point is really one statement of the source code. The position introduces an absolute coordinate in program traces and indicates a target point of the execution control.
In debugging, the control of program execution used so far is based on static information such as line numbers in source codes and cannot express the position because the backward jumps of the control point may cause multiple executions of one statement. To distinguish them from each other, we introduce a new counter into debuggees. We call the counter timestamp, which increases whenever the control point jumps backward. The position is expressed as the pair of the line number and the value of the timestamp.
An example code with a loop structure is shown in figure 2. There are multiple appearances of three lines (1) to (3) in the program trace (figure 3). We call the static point of execution expressed as the line number location.
        :
(1) while(i < a){
(2)   i += b;
(3) }
        :
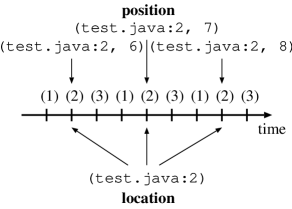
Timestamp increases whenever the loop body is repeated, so the pair of the line number and the value of timestamp expresses the position, the dynamic point of execution. Using the value of timestamp, we can distinguish each of multiple appearances of a location in the trace. For Java programs, timestamp should increase at the following cases:
-
•
entrance and exit of method invocations,
-
•
loop body,
-
•
exception.
Position could be expressed as the whole history of debugger commands, rather than the pair. We discuss this topic in section 5.
2.2 Dynamic Breakpoint
We here describe how to move the control point to a position. We propose a new breakpoint facility, dynamic breakpoint, to be set at a position, rather than at a location.222 We call the normal breakpoint static breakpoint. Because the implementation of it needs the existing breakpoints we get support from debuggers.
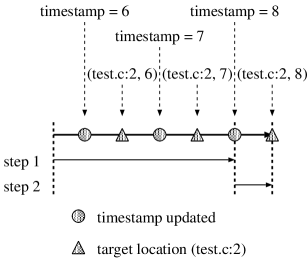
A simple implementation of dynamic breakpoint could use “conditional breakpoint” of debuggers. We show an instruction example with the notation of GDBSPS+ (00). For example, if we want to stop the debuggee at the position, (test.java:2, 8),333 Debugger already stopped at the position and recorded the timestamp in a previous run. If second execution path is unexpectedly different from first, the recorded position becomes meaningless and there is no way the debuggee knows such change by itself. Discussion about non-deterministic debuggees are in section 8. we instruct Java debugger, JDB, as follows:444 JDB does not support conditional breakpoints yet.
break test.java:2 if Timestamp.ts = 8
This implementation has performance problem, since many context switchings may occur in order to evaluate the given conditions. We will show more effective implementation later.
2.3 Applications of Position
We describe three applications of position. We assume that debuggees are deterministic including the execution environments; we discuss non-deterministic cases in section 8.
2.3.1 Bookmarking Positions
When we know where the cause of the bug is only roughly, we use breakpoints to move the control point before the target position, and then use a step execution repeatedly. If a programmer who walks through a large program mistakenly pass over the desired position, he must recall and replay all the commands he had given from the beginning.
Bookmarking positions is like a mountaineer placing anchors for his rope as he goes along. We think that the behavior of the debuggee is correct as far as here, then we bookmark the position by using a dynamic breakpoint. If we mistake something later, we can go back to the lost anchor point before things went wrong.
Furthermore, if a programmer annotates the position as its identifier instead of the ID number, he would remember the position easily. For example, the comment might be: “Just read a right brace; the parser is about to process a compound statement.”
2.3.2 Reverse Watchpoint
Suppose that a program allocates memory dynamically. If the program writes beyond the range of allocated area, it may destroy the header information of it used by allocator functions malloc and free. But the destruction operation itself does not cause the bug manifestation immediately, and the result is usually manifested much later. Similarly, if an object is unexpectedly pointed from two different references (called aliasing), the content of the object could be destroyed.
It is difficult to fix these bugs which are caused by writing an invalid value to a variable unexpectedly because their manifestation occurs later than the write. To catch these invalid writes, debuggers provide data access breakpoint facility, watchpoint in GDB, which traps all write accesses to a certain variable. First, in debugging, we examine which variable are invalid. Second, we look for the operation which destroyed it by using watchpoint.
When we use watchpoint, the debuggee stops many times and we examine all the output to know whether the write access is relevant to the bug. Such work requires too much time for us to concentrate our attention on the whole debugging session and to find a sign of the bug to be found.
On the other hand, the last write to the variable obviously causes the bug manifestation. We do not know which write is the last one until the bug manifests. To know the write, we must set a watchpoint at the variable, re-start the debuggee with counting stops by the watchpoint until the control point reaches where bug manifests, and re-start it again to go back to the last write. We are going to automate this procedure.
We propose the “reverse watchpoint” facility which automatically moves the control point of the debuggee to the last write to a certain variable. This new debugger command takes a variable name to be observed as its argument and does such control movement. Using the reverse watchpoint, programmers do not have to care about each stop by watchpoint and can concentrate their attention on more intelligent work in debugging.
Reverse watchpoint is easily implemented by using the dynamic breakpoint described above and existing debugger. The procedure is as follows.
-
1.
Set a dynamic breakpoint at the position where reverse watchpoint is instructed (S in figure 4).
-
2.
Pass 1:
-
(a)
set a normal watchpoint at the target variable and re-start the debuggee. Whenever it stops by the trap of the watchpoint, collect the information for its position (actually the value of the timestamp) in order to mark the position W1 to Wn in figure 4.
-
(b)
Repeat the collection until the control point reaches the position S.555 We can know it by stopping at the dynamic breakpoint set at step 1.
-
(a)
-
3.
Pass 2:
-
(a)
go back to the beginning again, set another dynamic breakpoint at the most recent position Wn, and re-start it.
-
(b)
The program stops at the target position Wn.
-
(a)

This procedure corresponds to creating dynamic slicingAH (90) manually. The advantage of our proposal is that control point of execution can be moved at interesting positions where a variable is assigned without problems about “unconstrained pointers”BG (96), such as those found in C. Slicing techniques are based on analysis of source codes, but watchpoint of debuggers receive support from hardware for fully precise information of assignments.
2.3.3 Binary Search Method for Locating Bugs
We propose a binary search method for locating bugs using timestamp as a facility for automatically locating the position where a condition becomes false at the first time.
Suppose that a program constructs a doubly linked list and we want to find the position where the consistency of the list is lost. We can do this more easily by using timestamp as an index of the binary search method. A driver program which implements the method should control a debuggee as follows:
-
1.
move the control point to the position where the timestamp value is the middle of the left end (initially, the beginning of the execution) and the right end (first, the end),
-
2.
evaluate the condition, and
-
•
if it is true then go to the position between the current position and the right end, and narrow the target area by dealing with the new position as the new left end,
-
•
if it is false then go back to the position between the left end and the current, and narrow the target area by dealing with the new position as the new right end,
-
•
-
3.
repeat above.
Inserting assertions at various source lines and evaluating them repeatedly might seem to achieve the same effect as ours. But our method has two advantages. First, assert must be inserted manually at all the locations where it may be necessary. The binary method does not have to do. Second, the inserted asserts cause condition evaluations at each call. Using our method, the maximum number of the examinations is such that is the timestamp value at the end of the execution. So, if the condition is complex, the performance of the method may be better than the one of assert.
This method is already proposed by Tolmach and AppelTA (95). We take it from the world of functional programming to one of procedural programming.
Because binary search method requires the condition to be monotonous (or at least become false at the end), we might have to repeat the process in order to arrive the moment of true bug. Suppose the following scenario: the true bug is a temporal invalid value of a variable in a condition C1; the invalid value is propagated to another variable in a condition C2; C1 recovers the correct state; C2 causes the crash. If we use C1 to test the debuggee, we cannot find the moment C1 becomes invalid because the condition is not monotonous. But C2, the direct cause of the crash, leads us to the moment when it becomes invalid. After this step, we use C1 to arrive at the true bug.
3 Implementation for C
We need to modify target program to include codes for updating timestamp.
3.1 Discussion about Target of Transformation
We have implemented the transformer in intermediate code level. There might be three levels of C program transformation:
-
1.
source code level,
-
2.
intermediate code level,
-
3.
assembly code level.
The first one has the advantages of independence from hardware platforms, operating systems, and compilers. However, codes which programmers see in debugging are different from ones they wrote and the implementation is slightly difficult because the transformer have to analysis the output of C preprocessor.
The advantage of the second one is to be independent of target architectures if the compiler supports that platform, while the disadvantage is to be dependent on a certain compiler.
The target of the third level is assembly code emitted by compilers. We first implemented a simple transformer in this levelMT (00), because it is the easiest method, but is dependent on target architectures and lacks the portability.
GNU C Compiler (GCC)Sta (99) is chosen as the target compiler because it is used in various platforms. GCC generates the intermediate code, called Register Transfer Language (RTL), from the source code and we modified a part of GCC to insert the codes of increment of timestamp at the RTL generation stage. The target of our implementation is GCC-2.95.2 which was the latest release of GCC at the time. The details of the modification is described in section 3.3.
When compiled, debuggees are inserted the macro INC_TS shown in figure 5 at proper locations.
int timestamp = -1;
int ref = -1;

void brake(void){}

#define INC_TS if(++timestamp == ref) brake();
3.2 Implementation of Dynamic Breakpoint for C
The implementation of dynamic breakpoint described in section 2.2 has performance problem. Conditional breakpoint evaluates the given condition whenever the control point reaches the location shown as in figure 6, so the execution usually slows down seriously.
The implementation with the least overhead (only 2 breaks) is as follows.
- Step 1
-
Prior to the execution, set a static breakpoint in the function brake(), assign the target value of timestamp to the debuggee’s variable ref. Start the execution until it stops by the breakpoint when the value of timestamp reaches ref.
- Step 2
-
Set another static breakpoint at the target location and continue the execution.
3.3 Modifications of GCC
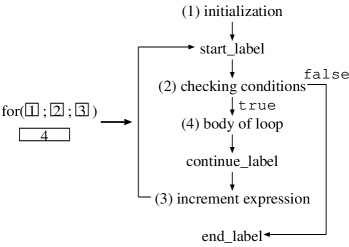
In GCC, the function of the parser, yyparse, invokes its actions which generate RTL. We modify GCC so that it has a new command line option, -pg2, and emits the RTL for updating timestamp if the option is given. In C programs, timestamp should increase at the following cases.666 Our implementation does not increase timestamp when longjmp() is called. It does not matter unless setjmp() and longjmp() are called in the same function, which is usually expressed by goto statement.
- loops
-
The increment code is emitted just after the label, start_label, which is placed at the start of loops in expand_start_loop. The label is the target of jumps from tails of loop bodies and is emitted after the initialization of for statements (figure 7). It works well in the cases of while statements and do/while statements.777 Timestamp should increase just after continue_label in terms of backward jumps. But we do not choose this approach for the unification of the implementations for three kinds of loop statements. Therefore one extra increment of timestamp occurs at each loop structure, but it is negligible.
- goto statements
-
The increment code is emitted just before the invocation of
expand_goto_internal in expand_goto. Jumps of which the destination label is forward do not need to cause the increment of timestamp. But we do not decide whether a jump is backward for the sake of keeping the implementation simple.888 Too frequent updating of timestamp does not destroy the consistency of position, but causes a drop in the performance. GCC has its original features, “nonlocal goto” and “computed goto”. Our modified GCC does not regard these gotos as the target of the increment of timestamp because of the simple implementation. - return statements
-
returns with a return value put it in the registers of CPU. The increment code is emitted just before the computation of arguments of returns in c_expand_return in order to prevent the value in the registers from being destroyed.
- entrance of function calls
-
The code is emitted just after the invocation of store_parm_decls, which registers the name and type of the arguments of the function call.
- exit of function calls
-
This is relevant to the tail of void functions without explicit return. In order to prevent extra increments after one at return statements, the code is emitted just before return_label which is emitted in epilogues of functions.999 return_label is the destination of jumps from return statements.
Our modifications to GCC have around 70 lines. We have confirmed the behavior of our GCC on four platforms. In order to port it to other platforms, all we have to do is the modification of a macro which is relevant to command line options in a header file for each platform.
-
•
i386-linux
-
•
alpha-linux
-
•
sparc-sunos4
-
•
sparc-sun-solaris2.8
Figure 8 shows the inserted codes on i386-linux and sparc-sunos4 in assembly code notation. The codes are generated with options for debugging, optimizations and timestamp.
incl timestamp                 sethi   %hi(_timestamp), %o1
movl timestamp,%eax            ld      [%o1+%lo(_timestamp)], %o0
cmpl ref,%eax                  add     %o0, 1, %o0
jne .L6                        st      %o0, [%o1+%lo(_timestamp)]
call brake                     sethi   %hi(_ref), %o1
                               ld      [%o1+%lo(_ref)], %o1
                               cmp     %o0, %o1
                               bne     L21
                               mov     0, %l2
                               call    _brake, 0
3.4 Overhead Measurement of C Implementation
Table 1 shows the result of measurement of runtime overhead. The debuggee of this benchmark is gawk-2.15.6. Overhead of other C applications is also measured (table 2). The benchmark “empty loop” has only one loop structure whose body is empty and shows the worst case of overhead of our system, because both increment of timestamp and comparing it to ref occur whenever the loop is repeated. The “sed” benchmark is sed-1.18. Platforms in these tables are shown in table 3.101010 We regret to lose SPARC-1 platform and cannot know its clock of CPU.
The number of increments of timestamp is 500000002 in “loop”, 85888810 in “sed” and 96817515 in “gawk”. The average time required for increment is about , and nanoseconds respectively. We think it is acceptable for practical use.
GCC options Intel-1 Alpha SPARC-1 -g -O 2.57 4.64 17.44 (1.00) (1.00) (1.00) -g -O -pg2 3.78 6.34 24.40 (1.47) (1.37) (1.40) seconds (ratio)
App. GCC options Intel-2 SPARC-2 empty loop -g -O 2.762 1.012 (1.00) (1.00) -g -O -pg2 9.632 10.112 (3.49) (9.99) sed -g -O 9.182 3.182 (1.00) (1.00) -g -O -pg2 10.02 4.916 (1.09) (1.54) gawk -g -O 2.87 2.842 (1.00) (1.00) -g -O -pg2 4.466 4.598 (1.56) (1.62) seconds (ratio)
Platform Architecture OS Alpha Alpha 500MHz Linux (glibc2) Intel-1 Celeron 400MHz Linux (glibc1) Intel-2 Celeron 366MHz Linux (glibc2) SPARC-1 SPARC N/A SunOS-4 SPARC-2 UltraSPARC 500MHz Solaris-8
Table 4 shows the total size of files of each benchmark. The increases are acceptable.
App. GCC options Intel-2 SPARC-2 empty loop -g -O 1144 2160 (1.00) (1.00) -g -O -pg2 1248 2416 (1.09) (1.12) sed -g -O 41030 55263 (1.00) (1.00) -g -O -pg2 52430 77215 (1.28) (1.40) gawk -g -O 140046 169310 (1.00) (1.00) -g -O -pg2 169414 223078 (1.21) (1.32) bytes (ratio)
4 Implementation for Java
From the experience of C, we have chosen the implementation using bytecode transformation. We considered four levels to implement the transformer for Java before the decision:
-
1.
compilers (source code level),
-
2.
class files (bytecode level),
-
3.
virtual machines (bytecode execution level),
-
4.
Java Platform Debugger ArchitectureSun (debugger interface level).111111 Java Platform Debugger Architecture (JPDA) is included in JDK. Java debugger JDB also uses it.
The first and the third are excluded because of the same reason (portability) as the case of C. The fourth is very portable but we excluded this approach because of the expected high overhead.
Although bytecode can be regarded as assembly code in the case of C, the format is established by Java virtual machine specificationLY (99), and it is independent of target architectures.
4.1 List of Bytecodes which Cause Increment of Timestamp
As explained in section 2.1, timestamp must be updated at several types of program structure.
- entrance and exit of method invocations
-
No bytecodes correspond with the entrance of method invocations. The top of method body is used instead. return bytecodes (opcode: 172–177) correspond with exit of methods.
Bytecodes which invokes methods such as invokevirtual could be used instead of the beginning of method body. We selected the latter, because the amount of added codes is less than the former. Another advantage of this choice is that the timestamp overhead is only added to the methods of the modified class. There will be no overhead for calling non-modified classes (such as ones in system library). - branches
-
ifeq (153) to if_acmpne (166), ifnull (198) and ifnonnull (199).
- goto
-
goto (167) and goto_w (200).
- other jumps
-
jsr (168), ret (169) and jsr_w (201).
- exceptions
-
athrow bytecode throws exceptions, but there exists certain exceptions which is not athrowed explicitly (such as NullPointerException). Instead the codes of increment of timestamp are inserted into the entry of the catch block.
Our transformer inserts a bytecode for updating timestamp, just before bytecodes described above. The inserted one is only invokestatic followed by the index number of Methodref tag which indicates Timestamp.inc() in constant pool. Bytecodes of branches, gotos and other jumps described above have an operand which designates an offset to its target address. The update of timestamp is inserted when the operand has a negative value, i.e. backward jump. The implementation of Timestamp class at present is shown in figure 9.
public final class Timestamp{
  private static long ts, ref;

  static{
    ts = 0;
    ref = 0;
  }

  public static void inc(){
    if(++ts == ref) brake();
  }

  private static void brake(){}
}
4.2 Bytecode Transformer
Our bytecode transformer which transforms Java class files is written in Java using Bytecode Engineering LibraryDah (99) (BCEL) and has around 160 lines.
It is not necessary to transform all class files of a program: it is possible to do only those classes the user considers suspicious. This reduces the overhead significantly.
4.3 Overhead Measurement of Java Implementation
We show the results of measurement of runtime overhead and increase of size of transformed class files. The target class files include an empty loop and benchmark programs of SPEC JVM98Sta . We run them under JDK-1.4.0 on Linux PC (Pentium III 733MHz, 640MB memory, and Linux-2.4.7).
We ran each benchmark seven times and found the means of five results except the best and the worst. The result is shown in table 5. In the case of empty loop, whenever the loop is repeated, the method invocation of Timestamp.inc() occurs. This benchmark shows the worst case of overhead of our system. Our implementation at present slows down around 4 times. For other benchmarks overheads are around 1.5 to 2 times of slowing down. We think it is acceptable for practical use. When the implementation of reverse watchpoint completed, its overhead would be the sum of two: timestamp system overhead which is around 1.5 to 2 for each of two pass and watchpoint overhead which JDB produces. We may estimate the overhead of reverse watchpoint to be less than around 4 times of slowing down in most cases. Note that _227_mtrt benchmark is a multi-threaded program and we added synchronized to Timestamp.inc() method only for this benchmark. So the overhead is heavier than others.
Benchmark Original Backward Jumps empty loop 12.774 (1.00) 56.416 (4.42) _201_compress 1.4006 (1.00) 2.7754 (1.98) _202_jess 0.2126 (1.00) 0.271 (1.27) _209_db 0.412 (1.00) 0.433 (1.05) _222_mpegaudio 0.1826 (1.00) 0.2792 (1.52) _227_mtrt 0.363 (1.00) 0.9038 (2.49) _228_jack 0.603 (1.00) 0.7212 (1.19) seconds (ratio)
Table 6 shows the total size of files of each benchmark. The increase of empty loop benchmark whose file size is very small and that of _201_compress benchmark are a little large, but others increase little.
Benchmark Original Backward Jumps empty loop 276 (1.00) 328 (1.19) _201_compress 14443 (1.00) 18640 (1.29) _202_jess 396536 (1.00) 407240 (1.03) _209_db 10156 (1.00) 10588 (1.04) _222_mpegaudio 120182 (1.00) 124438 (1.04) _227_mtrt 859 (1.00) 920 (1.07) _228_jack 132516 (1.00) 138109 (1.04) bytes (ratio)
5 Debugger Command History as a Position
We chose timestamp representation, the pair of line number and timestamp, for position. Another one is command-history representation. When we arrive at a certain position in a debugging session, the whole history of debugger commands enables us to come back to the position by re-execution from the beginning. The advantages of our representation are as follows.
- Total order
-
Timestamp representation is totally ordered and any position can be compared to each other in order of time, so we can do binary search method described in section 2.3.3.
- Uniqueness
-
Our choice gives a unique representation for a position while there may be many command histories leading to a position. This enables a 1-to-1 correspondence between a position and a bookmark for it.
- Performance
-
In most cases, playing back debugger commands requires high overhead compared to our method. Longer history produces higher overhead.
6 Related Work
BootheBoo (00) made a C debugger with reverse execution capability using a step counter which counts the number of step executions and re-execution from the beginning of debuggees. The capability could be also implemented with our timestamp counter and re-execution. The difference comes from the purpose of each project. Boothe made reverse execution version of existing debugger commands such as “backward step”, “backward finish”, and so on. Since we try to implement more abstract control of program execution than raw debugger commands, the counter of step execution is too expensive for our purpose.
Feldman et al.FB (88), MoherMoh (88) and Wilson et al.WM (89) save complete memory history of process to achieve fully random accessibility to program states. Their systems have to deal with large “log”. Our system, however, saves only a pair of line number and value of timestamp to obtain the same capability by assuming the determinism of debuggees.
Lieberman et al.LF (97); Lie (87) developed a reversible, animated source code stepper, ZStep95. Its modified interpreter saves the order of evaluating S-expression of Lisp programs to provide fully reversible execution. ZStep95 also provides correspondence between a S-expression and a graphical output which is produced by the expression. The correspondence is similar to position, but the interpreter supports only a subset of Lisp and works very slow.
BertotBer (91) introduced “occurrences” into the lazy -calculus, which makes copies of a subtree in reduction. For example, when an expression is applied to a lambda function , two copies of will be made and used for both operands of . This can be regarded as creation of multiple positions from one correspondent location at the time of execution. Bertot achieved a breakpoint capability, which is set at an expression and enables the program to stop at any copy of the expression is evaluated. In procedural languages, the identification is very easy; use the address of the instruction as a breakpoint. Their purpose is to unify multiple positions to the location; our purpose is to distinguish positions from each other.
Zeller et al.HZ (00); Zel (02) propose “Delta Debugging” which automatically find out data or variables which are concerned with errors by comparing the input data or variables which exit normally with ones which cause errors. It is very useful method and similar with our method in terms of reducing the labor of programmers by power of recent computers. We, however, want to establish more interactive and flexible debugging method and our method is complementary to their one.
DucasséDuc (99) allows the programmer to control the execution not by source statement orientation, but by event orientation such as assignments, function calls, loops, and so on. Users write Prolog-like forms to designate breakpoints which have complex conditions. This mechanism is complementary to our system and suitable for a front end of it in order to designate appropriate positions where we would move control point to.
Templer et al.TJ (98); JZTB (98) developed a event-based instrumentation tool, CCI, which inserts instrumentation codes into C source codes. The converted codes have platform independence. The execution slowdown, however, is 2.09 times in the case of laplace.c and 5.85 times in the case of life.cJZTB (98). In order to achieve position system, events only about control flow should be generated.
Larus et al.LS (95) made EEL, which is a library for building tools to analyze and modify an executable program. Using EEL, we could implement the insertion of codes to maintain timestamp in executable code level. The solution, however, is dependent on a specified platform, so we chose the intermediate code level and modified GCC.
Binder et al.BHV (01) integrated a resource management system of CPU and memory into J-SEAL2 mobile agent system using bytecode transformation for complete portability. They use a counter which counts statements executed for CPU resource management and each thread executed updates the counter at each basic block. They reduce the frequency of the update using control flow analysis and the overhead of the system including other components of agent system is times of slowing down in the worst case. Hayami et al.HTY (02) also inserted similar codes of counter update using bytecode transformation for the same purpose. They implemented more fine grain management and the overhead is times of slowing down. These results are better than ours, because our implementation uses method invocation and its overhead is serious, we think.
7 Conclusion
We proposed a new idea, position, as the base of execution control. It introduces an absolute coordinate into program traces and indicates a point in traces. In order to implement it, we introduced a counter, timestamp, as a global variable of the debuggee, which increases whenever the control point jumps backward. Position is expressed as a pair of the line number and the timestamp value. We introduced the idea of dynamic breakpoint as “breakpoint at a position” and described three applications.
We also described the implementation details of the timestamp system for C and Java programs using the modification to GCC and the bytecode transformation respectively. Our GCC and bytecode transformer insert the codes of increment of timestamp at certain locations which cause control jumps. We measured the result of runtime overhead of C and Java implementations and increase of size of transformed class files and showed that they are acceptable for real use.
8 Future Work
The bytecode transformer transforms all the methods in given class files. We should make it able to do selectively.
The driver program of reverse watchpoint for deterministic C programs is completed but one for Java, based on JDB, is still under development. Although JDB included in JDK-1.4.1 does not provide the support of “watchpoint to individual objects”, WatchpointRequest class of JPDA in JDK-1.4.1 now have the capability of adding instance filters by using the addInstanceFilter method. JDB will have the support soon.
For non-deterministic programs, the applications described in section 2.3 do not work well without appropriate replay mechanisms. If non-determinism of debuggees was based on external environment such as input data, we could use some tools to record and replay the environment. For example, XlabVer (98) could be used to record and replay X window system events. If debuggees have internal non-determinism such as multi-threaded programs, tools to replay the timing of thread switchings would be needed. Choi et al.CS (98) implemented a modified Java VM which can replay multi-threaded Java programs. There is another way that the timing is saved via JPDA.
9 Acknowledgments
Thanks to Naoshi Higuchi for the wealth of his knowledge about Java programming and its APIs.
References
- AH (90) Hiralal Agrawal and Joseph R. Horgan. Dynamic Program Slicing. In Proceedings of the ACM SIGPLAN ’90 Conference on Programming Language Design and Implementation, pages 246–256, 1990.
- Ber (91) Yves Bertot. Occurences in Debugger Specifications. In Proceedings of the ACM SIGPLAN ’91 Conference on Programming Language Design and Implementation, pages 327–337, 1991.
- BG (96) David W. Binkley and Keith Brian Gallagher. Program Slicing. Advances in Computers, 43:1–50, 1996.
- BHV (01) Walter Binder, Jarle G. Hulaas, and Alex Villazón. Portable Resource Control in Java. In Proceedings of OOPSLA’01 the Conference on Object Oriented Programming Systems Languages and Applications, pages 139–155, 2001.
- Boo (00) Bob Boothe. Efficient Algorithms for Bidirectional Debugging. In Proceedings of the ACM SIGPLAN ’00 Conference on Programming Language Design and Implementation, pages 299–310, 2000.
- CS (98) Jong-Deok Choi and Harini Srinivasan. Deterministic Replay of Java Multithreaded Applications. In Proceedings of the SIGMETRICS Symposium on Parallel and Distributed Tools, pages 48–59, 1998.
-
Dah (99)
Markus Dahm.
Byte Code Engineering.
In Java-Information-Tage 1999(JIT’99), 1999.
http://bcel.sourceforge.net/. - Duc (99) Mireille Ducassé. Coca: An Automated Debugger for C. In Proceedings of the 1999 International Conference on Software Engineering, pages 504–513, 1999.
- FB (88) Stuart I. Feldman and Channing B. Brown. IGOR: A System for Program Debugging via Reversible Execution. In Proceedings of the ACM SIGPLAN and SIGOPS Workshop on Parallel and distributed debugging, pages 112–123, 1988.
- HTY (02) Yuta Hayami, Kenjiro Taura, and Akinori Yonezawa. Java Bytecode Transformation for Fine Grain CPU Resource Management. Transactions on Programming, Information Processing Society of Japan, 43(SIG3(PRO14)):41–51, 2002. (In Japanese).
- HZ (00) Ralf Hildebrandt and Andreas Zeller. Simplifying Failure-Inducing Input. In Proceedings of the ACM SIGSOFT International Symposium on Software Testing and Analysis (ISSTA2000), pages 135–145, 2000.
- Inc (92) D. C. Ince. An Introduction to Discrete Mathematics, Formal System Specification, and Z, Second Edition. Oxford University Press Inc., 1992.
- JZTB (98) Clinton L. Jeffery, Wenyi Zhou, Kevin Templer, and Michael Brazell. A Lightweight Architecture for Program Execution Monitoring. In Proceedings of the ACM Workshop on Program Analysis for Software Tools and Engineering, pages 67–74, 1998.
- LF (97) Henry Lieberman and Christopher Fry. ZStep 95: A Reversible, Animated Source Code Stepper. In Blaine Price John Stasko, John Domingue and Marc Brown, editors, Software Visualization: Programming as a Multimedia Experience. MIT Press, 1997.
- Lie (87) Henry Lieberman. Reversible Object-Oriented Interpreters. First European Conference on Object-Oriented Programming, 1987.
- LS (95) James R. Larus and Eric Schnarr. EEL: Machine-Independent Executable Editing. In Proceedings of the ACM SIGPLAN ’95 Conference on Programming Language Design and Implementation, pages 291–300, 1995.
- LY (99) Tim Lindholm and Frank Yellin. The Java Virtual Machine Specification (2nd Edition). Addison-Wesley Pub. Co., 1999.
- Mey (91) Bertrand Meyer. Introduction to the Theory of Programming Languages. Prentice Hall, Inc., 1991.
- Moh (88) Thomas G. Moher. PROVIDE: A Process Visualization and Debugging Environment. IEEE Transactions on Software Engineering, 14(6):849–857, 1988.
- MT (00) Kazutaka Maruyama and Minoru Terada. One-pass Pseudo Reverse Execution of C Programs. Transactions on Programming, Information Processing Society of Japan, 41(SIG9(PRO8)):1–7, 2000. (In Japanese).
- Ros (97) Jonathan B. Rosenberg. How Debuggers Work. John Wiley & Sons, Inc., 1997.
- SPS+ (00) Richard Stallman, Roland Pesch, Stan Shebs, et al. Debugging with GDB – The GNU Source-Level Debugger – Eighth Edition, 2000. (Included in GDB source tree).
-
(23)
The Standard Performance Evaluation Corporation.
SPEC JVM98 Benchmarks.
http://www.spec.org/osg/jvm98/. - Sta (99) Richard M. Stallman. Using and Porting the GNU Compiler Collection. Free Software Foundation, 1999. (Included in GCC source tree).
-
(25)
Sun Microsystems, Inc.
Java Platform Debugger Architecture.
http://java.sun.com/products/jpda/. - TA (95) Andrew Tolmach and Andrew W. Appel. A Debugger for Standard ML. Journal of Functional Programming, 5(2):155–200, 1995.
- TJ (98) Kevin S. Templer and Clinton L. Jeffery. A Configurable Automatic Instrumentation Tool for ANSI C. In Proceedings of the IEEE International Conference on Automated Software Engineering, pages 249–257, 1998.
-
Ver (98)
Marc Vertes.
Xlab – a tool to automate graphical user interfaces.
In Linux Weekly News, May 1998.
http://mvertes.free.fr/. - WM (89) Paul R. Wilson and Thomas G. Moher. Demonic Memory for Process Histories. In Proceedings of the ACM SIGPLAN ’89 Conference on Programming Language Design and Implementation, pages 330–343, 1989.
- Zel (02) Andreas Zeller. Isolating Cause-Effect Chains from Computer Programs. In Proceedings of the SIGSOFT 10th International Symposium on the Foundations of Software Engineering (FSE-10), pages 1–10, 2002.