Centralized reward system gives rise to fast and efficient work sharing for intelligent Internet agents lacking direct communication
Abstract
WWW has a scale-free structure where novel information is often difficult to locate. Moreover, Intelligent agents easily get trapped in this structure. Here a novel method is put forth, which turns these traps into information repositories, supplies: We populated an Internet environment with intelligent news foragers . Foraging has its associated cost whereas foragers are rewarded if they detect not yet discovered novel information. The intelligent ‘news foragers’ crawl by using the estimated long-term cumulated reward, and also have a finite sized memory: the list of most promising supplies. Foragers form an artificial life community: the most successful ones are allowed to multiply, while unsuccessful ones die out. The specific property of this community is that there is no direct communication amongst foragers but the centralized rewarding system. Still, fast division of work is achieved.
1 Introduction
The largest source of information today is the World Wide Web. The number of documents may reach 10 billion soon; the number of documents changing on a daily basis is also enormous. The ever-increasing growth presents a considerable challenge in finding novel information on the web.
WWW has a scale-free structure [2, 11]: a graph is a scale-free network if the number of incoming (or outgoing or both) edges follows a power-law distribution (, where is integer, denotes the probability that a vertex has incoming (or outgoing or both) edges and ). The direct consequence of the scale-free property is that there are numerous URLs or sets of interlinked URLs, which have a large number of incoming links. Intelligent web crawlers can be easily trapped at the neighborhood of such junctions [6, 12, 13, 14].
We have developed a novel artificial life (Alife) method with intelligent individuals (agents) to detect ‘breaking news’ type information on a prominent and vast WWW domain. We turned to Alife to achieve efficient division of labor under minimized communication load between individuals. For reviews on relevant evolutionary theories, see, e.g., [4, 7]. See [5, 9] on the dynamics of self-modifying systems. See, e.g., [10] for a review on emerging intelligence in ‘swarm’ communities. Our agents crawl by estimating the long-term cumulated reward using reinforcement learning. (For a review on reinforcement learning, see, e.g., [16].) The estimation uses function approximation and temporal difference learning. Inputs to the function approximator are provided by probabilistic term-frequency inverse document-frequency (PrTFIDF) classifier [8] using text classes formed by a well-known text clustering method [3].
2 Methods
In our model, individuals are foragers, ‘populating’ a continuously changing world, where the rate of the emergence of new resources is limited.
Environment. The domain of our experiments (one of the largest news sites), as most WWW domains, was scale-free according to our measurements. The distributions of both incoming and outgoing links show a power distribution (Fig. 1(a)). The inset shows the links and documents investigated by a forager when it takes a step. The distributions, shown in the figure, correspond to links investigated by the foragers. The news forager visits URL ‘A’, downloads the not-yet visited part of the environment (documents of URLs, which URLs have not been visited yet and are linked from URL ‘A’). Downloading is followed by a decision, URL ‘B’ is visited, downloading starts, and so on. The series ‘A’, ‘B’, ‘C’, … is called path.
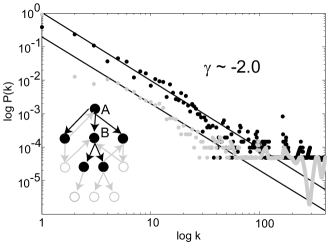
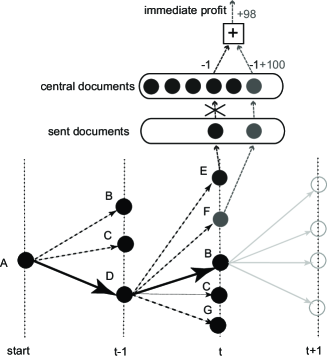
(a): Log-log scale distribution of the number of (incoming and outgoing) links of all URLs found during the time course of investigation. Horizontal axis: number of edges (). Vertical axis: relative frequency of number of edges at different URLs (). Black (gray) dots: incoming (outgoing) edges of URLs. Slope of the straight lines . Inset: method of downloading. Black (gray) link: (not) in database. Solid (empty) circle: (not) in database. (b): Central reinforcement system. Empty (solid) circles: (not) novel documents. Positive (negative) numbers: reward and profit (cost). Vertical dashed lines: consecutive time steps. Dots on the dashed line: documents available at time step .
The foragers. Foragers have two components of long-term memory. The first component serves decision making and determines the behavior of the forager. Foragers with different behaviors may make different decisions at the same URL. The second component is a finite-sized memory, which contains procedures. This ‘procedural memory’ codes how to escape from a trap. Here, a procedure is simply a switching to a new URL, a new starting point. The forager searches for a given number of steps. Steps are taken according to the forager s behavior. After the given number of steps are taken, a procedure, which is selected randomly from the procedural memory, solves the problem of being trapped.
At each visited page, the forager downloads the neighboring documents and determines whether a document has a time stamp of the current (actual) date. If it does, this document is sent to the center (these documents will be referred as ‘sent’ documents).
Reward system. Foragers are searching for ‘food’, which is novel news. A central reinforcing unit administers positive and negative rewards. Positive reward is delivered only to the first sender of a given news item only if the document’s time stamp is not older than a day according to GMT. Then reward ( in arbitrary units (a.u.)) is ‘provided’. Each sending of a document, costs ( a.u.) for the forager. The (immediate) profit is the difference of rewards and costs at any given step. Figure 1(b) shows the reinforcement of a step in an example path: at start (time ), the agent is at URL ‘A’, where documents of neighboring URLs ‘B’, ‘C’ and ‘D’ are downloaded. URL ‘D’ is visited next. Documents of URLs ‘E’, ‘F’ and ‘G’ are downloaded. Document of URL ‘G’ has an obsolete date. Documents of URLs ‘E’ and ‘F’ are sent to the center. Document of URL ‘F’ is novel to the center, so it is rewarded. In turn, profit 98 is received by the forager.The forager maintains a list of neighbors of visited URLs, called frontier. It can only visit URLs of the frontier.
Long term cumulated profit. (LTP) Immediate profit is a myopic characterization of an URL. Foragers behave intelligently by following the policy that maximizes the expected LTP instead of the immediate profit. Policy and profit estimation are interlinked concepts: profit estimation determines the policy, whereas policy influences choices and, in turn, the expected LTP. (For a review, see [16].) Here, choices are based on the greedy LTP policy: The forager visits the URL, which belongs to the frontier and has the highest estimated LTP. Visited URLs form a path and each path is limited to 100 steps.
Each forager has a dimensional PrTFIDF text classifier [8] generated on a previously downloaded portion of the Geocities database. 50 clusters was created by Boley s clustering algorithm [3] from the downloaded documents. The PrTFIDF classifier was trained on these clusters plus an additional one representing general texts from the internet. The PrTFIDF outputs were non-linearly mapped to interval [-1,+1] by a hyperbolic-tangent function. The classifier was applied to reduce the texts to a small dimensional representation. When the forager visits URL ‘A’ displaying document , the output vector of the classifier is . (The output was dismissed.)
A linear approximator is used for LTP estimation. It encompasses parameters, the weight vector . The LTP of document is estimated as the scalar product of and : . This weight vector is the first component of a forager s long-term memory. The weight vectors are tuned by temporal difference learning [15]: let us denote the document to be visited next by , the output of the classifier by and the estimated LTP of the document by . Assume that leaving the actual document and arriving to the next document, we have immediate profit . Our estimation is perfect if . Future profits are typically discounted in such estimations: , where . In turn, the error of value estimation is
Throughout the simulations was used. At each actual step the weights of the value function were tuned to decrease the error of value estimation for the visited documents. This estimation error was used to correct the parameters: the component of the weight vector was corrected by
with and .
URL lists and decisions. The second component of foragers’ long-term memory, the procedural memory, is the weblog, which is a list of URLs with items less than or equal to 100. Starting points are the first 10 elements of the weblog. At the start of a path the forager makes a random choice amongst starting points and visits that URL. After a path is finished the forager selects a new starting point for the next path.
For an URL ‘A’, the cumulated profit is the sum of immediate profits collected during the path after visiting URL ‘A’. Denoting the cumulated profit of URL ‘A’ by , when a path is completed, the value of the URL ‘A’, denoted by is estimated as follows:
where was set to . If URL ‘A’ did not have a value before, then is set to . These values are then used to update the weblog after each path. URLs are ordered by decreasing value and the list is clipped at the URL to form the new weblog.
The forager also maintains two short-term memory lists during each path. One of the lists contains URLs visited during the path to avoid loops. The other list is the frontier, which contains the URL’s of pages directly accessible from the visited pages, excluding the visited URLs themselves. Forager selects its next step from this list. If the list is empty or the actual path has length of 100 steps then this path is finished.
Multiplying by bipartition and extinction. Every forager has a value of 100 at start. The value is reduced by 0.05 for each document sent to the center and increased by 1 if a sent document is reinforced. Once the forager’s value reaches 200, the forager multiplies by bipartition and value 100 is assigned to both descendants. The weblog of the parent is randomly separated into two 50 element lists. The original weight vector of the parent and the partial weblogs are passed on to the descendants. On the other hand, if the forager s value hits 0 then it dies out.
Foraging periods. Foragers run sequentially in a prescribed order for approximately equal time intervals on one PC (the analysis of the last visited URL (donwloading neighbouring URLs and LTP estimation) is allowed). The foraging period is the time interval while all foragers run once. Unfinished paths are continued in the next run.
3 Experimental results
Multiple two-week long experiments were conducted between September and November 2002. Apart from short breaks, monitoring was continuous for each two week period. Most of the figures in this article represent the November 5-21, 2002 time period. The parameters of this experiment are representative to the entire series: The number of downloaded, sent and reinforced documents was 1,090,074, 94,226 and 7,423, respectively. The used Internet bandwidth (1Mbps on average) was almost constant, decreasing slowly by 10 % towards the end of the experiment. The number of foragers increased from 2 to 22. Experiments were run on a single computer. Within each foraging-period, the allocated time of every forager was 180 s. Some uncertainty (s) arose, because foragers were always allowed to complete the analysis of the last URL after their allocated time expired. The net duration of a 100 step path was 350s.
3.1 Time lag and multiplication
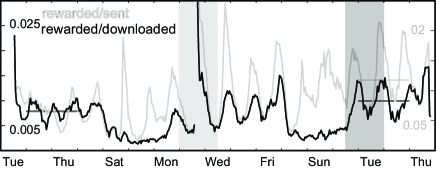
(a): The rate of sent and rewarded documents showed daily oscillations. Lighter (darker) gray curve: the ratio of rewarded to sent (rewarded to downloaded) documents. Horizontal lines: average values of the two curves during two workdays. Light (darker) gray regions: number of foragers is 10 (number of foragers increases from 14 to 19). (b): Forager population and forager values vs. time. The scores of the foragers are given with different gray levels. Starting of white horizontal line means forager multiplication. (There was a break in our Internet connection in the middle of the second week.)
In the presented experiments we applied the cost/reward ratio described in Section 2. Larger cost/reward ratio increased the foraging areas and we noted a sudden increase in extinction probability.
Time-lag between publishing news and finding those decreases already after a few days (see Fig. 2(a)): the ratio of maxima to minima of the curves increases; and also, fewer news published on Friday were picked up on Saturday, a day late, during the second weekend of the experiment than during the first. Further gains in downloading speed are indicated by the relative shift between lighter gray and darker gray peaks. The darker gray peaks keep their maxima at around midnight GMT, lighter gray peaks shift to earlier times by about 6 hours. The shift is due to changes in the number of sent documents. The minima of this number shifts to around 6:00 P.M. GMT, when it is around 3:00 A.M. in Japan. (Identical dates can be found for a 48 hour period centered around noon GMT.) Maxima of the relevant documents are at around 11:00 P.M. GMT (around 6:00 P.M. EST of the US). During the first week, the horizontal lines (average values of the corresponding curves during 2 workdays) are very close to each other. Both averages increase for the second week. The ratio of sent to reinforced documents increases more. At the beginning of the darker gray region, the relative shift of the two curves is large, at the end it is small, but becomes large again after that region, when multiplication slows down.
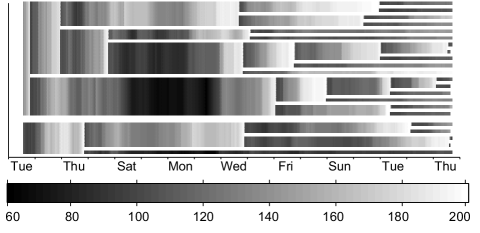
The multiplication of the foragers is shown in Fig. 2(b). Gray levels of this figure represent the value of the foragers, the range goes from 60 (darker) to 200 (lighter). In the time region studied, the values of the foragers have never fallen below 60. Upon bipartition new individuals are separated by horizontal white lines in the figure.
3.2 Compartmentalization
Division of work is illustrated by Fig. 3. According to Fig. 3(b) large proportion of the sites are visited exclusively by not more than one forager. Only about 40% of the sites is visited by more than one forager. Figure 3(a) demonstrates that new foragers occupy their territories quickly. Figure 3(b) shows that similar data were found for few (2-4) and for many (22) foragers (upper boundary is mainly between 0.6 and 0.7 throughout the figure). The figures depict the contributions of individual foragers: as new foragers start they quickly find good terrains while the older ones still keep their good territories. The environment changes very quickly, cca. 1200 new URLs were found every day. Time intervals of about 75 mins were investigated.
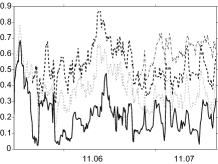
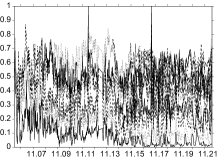
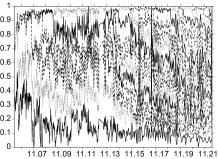
Horizontal axis in ‘month.day’ units. (a): Number of sites visited by only one forager relative to the number of all visited sites in a finite time period (). Contribution of a single forager is superimposed on cumulated contributions of older foragers. The difference between 1.0 and the upper boundary of the curves corresponds to the ratio of sites visited by more than one forager. Duration: about three days. (b): Same for 16 day period. (c): The ratio of different two step trajectories relative to all two step trajectories conditioned that the two step trajectories start from the same site, belong to different foragers and are in a finite time period (). Contribution of a single forager is superimposed on cumulated contributions of older foragers. The difference between 1.0 and the upper boundary of the curves corresponds to the ratio of the conditioned 2 step trajectories taken by more than one forager.
Figure 3(c) depicts the lack of overlap amongst forager trajectories. A relatively large number of sites were visited by different foragers. The question is if these foragers were collecting similar or different news. If they had the same ‘goal’ then they presumably made similar decisions and, in turn, their next step was the same. According to Figure 3(c) the ratio of such 2 step trajectories – i.e., the difference between the upper cover of the curves and value 1.0 – drops quickly at the beginning of the experiment, it remains very small and, it decreases further as the number of foragers is growing. Given that the increase of the number of foragers gave rise to the decrease of individual foraging time, the actual numbers are only indicative. Nevertheless, the fast decrease at the beginning and the small ratio for few as well as for many foragers provides support that foragers followed different paths, that is, foragers developed different behaviors. Differences between hunting/foraging territories and/or differences between consumed food are called compartmentalization (sometimes called niche formation) [4, 5, 7, 9]. Figure 3 demonstrates that compartmentalization, is fast and efficient in our algorithm.
4 Discussion and Summary
New Internet pages have been introduced continuously on the vast Internet news domain that we studied. The population of news foragers can be viewed as a rapidly self-assembling and adapting news detector. The efficiency and speed of novelty detection is increasing. This occurs in spite of the fact that the structure of the environment is changing very quickly: the number of newly discovered URLs was about constant versus time. Such drastic changes are followed by the news detector, which continuously reassembles itself and improves its monitoring efficiency.
In summary, our application demonstrates that evolutionary algorithms can efficiently operate on scale-free networks. Similar results can be expected in problems different from Internet searches. However, we believe that the speed and the efficiency of work sharing is mostly due to the highly clustered scale-free small world structure of the Internet, a terrain full of traps. These traps were turned into foraging-fields using the two-component long-term memory, (a) the list of promising starting points that we tentatively called ‘procedural memory’ and (b) the long-term profit (or reward) estimator. Both components are needed: without (a) foragers can not escape traps, without (b) forages can not compartmentalize, in other words share work with high efficiency. The evolution of the forager population progresses rapidly, making successful adaptation to fast-changing worlds possible. These attractive properties are achieved without direct communication among foragers, a major advantage in communication networks.
We close by noting that the algorithm is not restricted to robotic search on the Internet. Most notably, the algorithm seems attractive for all networks where scale-free small world structure is suspected, including social networks, cooperative networks as well as others. (For a review, see, e.g., [1].) Such human networks are constantly developing over the Internet, see, e.g., the network of software and hardware experts (http:www.experts-exchange.com). Similar networks could be formed by human and robotic communities. To highlight the similarities, reward may mean money, whereas multiplication could mean (i) hiring of employees, or, (ii) purchasing computers and Internet bandwidth.
Acknowledgments
This material is based upon work supported by the European Office of Aerospace Research and Development, Air Force Office of Scientific Research, Air Force Research Laboratory, under Contract No. F61775-00-WE065. Any opinions, findings and conclusions or recommendations expressed in this material are those of the author(s) and do not necessarily reflect the views of the European Office of Aerospace Research and Development, Air Force Office of Scientific Research, Air Force Research Laboratory.
References
- [1] R. Albert and A.L. Barabási. Statistical mechanics of complex networks. Reviews of Modern Physics, 74:47–91, 2002.
- [2] A.L. Barabási, R. Albert, and H. Jeong. Scale-free characteristics of random networks: The topology of the world wide web. Physica A, 281:69–77, 2000.
- [3] D.L. Boley. Principal direction division partitioning. Data Mining and Knowledge Discovery, 2:325–244, 1998.
- [4] C.W. Clark and M. Mangel. Dynamic State Variable Models in Ecology: Methods and Applications. Oxford University Press, Oxford UK, 2000.
- [5] V. Csányi. Evolutionary Systems and Society: A General Theory of Life, Mind, and Culture. Duke University Press, Durham, NC, 1989.
- [6] M. Diligenti, F. Coetzee, S. Lawrence, C. Lee Giles, and M. Gori. Focused crawling using context graphs. In 26th International Conference on Very Large Databases, VLDB 2000, Cairo, Egypt, 10–14 September 2000. http://www.neci.nec.com/ lawrence/papers/ focus-vldb00/ focus-vldb00.ps.gz.
- [7] J.M. Fryxell and P. Lundberg. Individual Behavior and Community Dynamics. Chapman and Hall, London, 1998.
- [8] Thorsten Joachims. A probabilistic analysis of the Rocchio algorithm with TFIDF for text categorization. In Douglas H. Fisher, editor, Proceedings of ICML-97, 14th International Conference on Machine Learning, pages 143–151, Nashville, US, 1997. Morgan Kaufmann Publishers, San Francisco, US.
- [9] G. Kampis. Self-modifying Systems in Biology and Cognitive Science: A New Framework for Dynamics, Information and Complexity. Pergamon, Oxford UK, 1991.
- [10] J. Kennedy, R.C. Eberhart, and Y. Shi. Swarm Intelligence. Morgan Kaufmann, San Francisco, USA, 2001.
- [11] J. Kleinberg and S. Lawrence. The structure of the web. Science, 294:1849–1850, 2001.
- [12] I. Kókai and A. Lőrincz. Fast adapting value estimation based hybrid architecture for searching the world-wide web. Applied Soft Computing, 2:11–23, 2002.
- [13] A. Lőrincz, I. Kókai, and A. Meretei. Intelligent high-performance crawlers used to reveal topic-specific structure of the WWW. Int. J. Founds. Comp. Sci., 13:477–495, 2002.
- [14] J. Rennie, K. Nigam, and A. McCallum. Using reinforcement learning to spider the web efficiently. In Proc. 16th Int. Conf. on Machine Learning (ICML), pages 335–343. Morgan Kaufmann, San Francisco, 1999.
- [15] R. Sutton. Learning to predict by the method of temporal differences. Machine Learning, 3:9–44, 1988.
- [16] R. Sutton and A.G. Barto. Reinforcement Learning: An Introduction. MIT Press, Cambridge, 1998.