The Rich-Club Phenomenon In The Internet Topology
Abstract
We show that the Internet topology at the Autonomous System (AS) level has a rich–club phenomenon. The rich nodes, which are a small number of nodes with large numbers of links, are very well connected to each other. The rich–club is a core tier that we measured using the rich–club connectivity and the node–node link distribution. We obtained this core tier without any heuristic assumption between the ASes. The rich–club phenomenon is a simple qualitative way to differentiate between power law topologies and provides a criterion for new network models. To show this, we compared the measured rich–club of the AS graph with networks obtained using the Barabási–Albert (BA) scale–free network model, the Fitness BA model and the Inet–3.0 model.
Index Terms:
Internet, topology, modeling, networks.I Introduction
The analysis of the Internet topology at the Autonomous System (AS) level by Faloutsos et al [1] showed that the probability that a node has links has a power–law tail for large , following , . Subramanian et al [2], using a heuristic argument based on the commercial relationship between ASes, found that the Internet has a tier structure. Tier 1 consists of a “core” of ASes which are well connected to each other. There have been some attempts to model the network using Transit–Stub and Tiers generators. Tangmunarunkit et al [3] showed that the degree distributions produced by these structure-based generators are not power–laws. Their results are based on qualitative metrics and they recognized that there is a need for further studies to characterize network topologies. There exist network models that produce power–law networks, e.g. the Barabási and Albert (BA) scale–free model [4] and the Inet–3.0 model [5] to mention just two of them.
We address in this letter the following questions: Can we characterize the core tier of the AS without making any heuristic assumptions? Does the power–law network generators produce a tier structure similar to the one measured in the Internet? To answer these questions we introduce the rich–club phenomenon as a quantitative way to characterize a core tier without making any heuristic assumption on the network elements interaction.
One of the main properties of power–law networks is that a small number of nodes have large numbers of links, we call these nodes, rich nodes. In this letter we show that the AS graph shows a rich–club, i.e. a core tier. The members of the club tend to be very well connected between each other, they create a tight group where if two members of the club do not share a link, it is very likely that they share a common node that can link them, that is the average hop distance is between one and two. Also, we have compared the rich–club measured in the AS graph with the one produced by the BA model, the Fitness BA model [6] and the Inet–3.0 model, where the synthetic networks are created to model the AS graph. Our results show that the BA and Fitness BA model do not create a rich–club. The Inet–3.0 model creates a rich–club but with a deficit in the number of core–links. Notice that in this letter, we are not trying to characterize all the existing power–law network generators, but to show that it is possible to distinguish between them by studying the properties of the rich–club.
II The AS Graph And Its Models
| PARAMETER | AS GRAPH | INET–3.0 | FITNESS BA | BA MODEL |
|---|---|---|---|---|
| , NUMBER OF NODES | 11461 | 11461 | 11461 | 11461 |
| , NUMBER OF LINKS | 32730 | 24171 | 34366 | 34366 |
| 28602 | 22620 | 20929 | 15687 | |
| 8919 | 3697 | 1426 | 1511 | |
| MAXIMUM NODE DEGREE | 2432 | 2010 | 1793 | 329 |
| AVERAGE NODE DEGREE | 5.7 | 4.2 | 6.0 | 6.0 |
| EXPONENT OF POWER–LAW DEGREE DISTRIBUTION | 2.22 | 2.22 | 2.255 | 3.0 |
| is the number of links connecting with the top 5% rich nodes. | ||||
| is the number of links connecting between the top 5% rich nodes. | ||||
II-A AS Graph
A number of studies [1, 5, 7] on the AS-level Internet topology used the so-called original AS connectivity maps. The original maps are based on BGP routing tables collected by the University of Oregon Route Views Project [8]. Chen et al [9] constructed the extended maps [10] using additional data sources, such as the Internet Routing Registry (IRR) data and the Looking Glass (LG) data. The extended maps have 20–50% more links than the original maps and provide a more complete picture of the AS graph. The AS connectivity data used in this letter is an extended map measured on May 26th 2001. Table I shows some properties of the data. For comparison, Table I also shows the synthetic graphs generated using the following network models.
II-B Barabási-Albert Model
The model [4] generates networks with a power–law degree distribution by using two generic mechanisms: growth, where the network “grows” by attaching a new node with links to different nodes present in the network; and preferential attachment, where new nodes are attached preferentially to nodes that are already well connected. The probability that a new node will be connected to node with degree is
| (1) |
The BA model has generated great interest in various research areas and has been used as a starting-point in research into the error and attack tolerance of the Internet [7, 11, 12]. The properties shown in Table I are of a network where each new node has three new links () which are preferentially connected to three already existing nodes. Notice that this model generates networks with a power–law link distribution of [13].
II-C Fitness BA Model
The model [6] is a modification of the BA model. It uses generalized preferential attachment which assures that, even a relatively young node with a small number of links, can acquire new links at a high rate if it has a large fitness parameter. The reason we study this model is that, for the uniform fitness parameter distribution, the network generated by this model has a power–law exponent similar to that of the AS graph.
II-D Inet–3.0 Model
The model [5] generates networks in three steps: 1) build a spanning tree with all nodes that have degrees greater than one, 2) connect all nodes with degree one to nodes in the spanning tree with a linear preference, and 3) connect the remaining free links in the spanning tree. The model was designed to match the measurements of the original maps of the AS graph. The number of links generated by the model depend on the number of nodes and the exponent of the power–law. Choosing these two parameters to match the AS graph of Table I, the model typically generates 26% less links than the AS graph.
III The Rich–Club Phenomenon
The rich–club is characterized by the rich–club connectivity and the node–node link distribution, which measure the interconnection between rich nodes.
III-A Rich–club connectivity
Nodes in the network are sorted by decreasing number of links that each node contains. There are instances where groups of nodes contain identical numbers of links. Where this occurs, they are arbitrarily assigned a position within that group. The node rank denotes the position of a node on this ordered list. is normalized by the total number of nodes . The rich–club is defined, for the purposes of this study, as nodes with rank less than (e.g. 1%). The rich–club connectivity is defined as the ratio of the total actual number of links to the maximum possible number of links between members of the rich–club. The maximum possible number of links between nodes is .
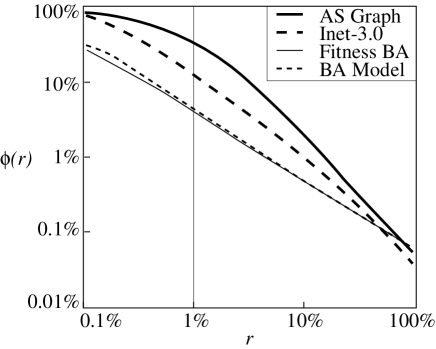
Figure 1 shows the rich–club coefficient against node rank on a log–log scale. It shows that the rich nodes of the AS graph are very well connected between each other. The top 1% rich nodes have 32% of the maximum possible number of links, compared with of the Inet-3.0 and only of the BA and the Fitness BA graphs.
III-B Node-node link distribution
We define as the number of links connecting nodes with rank to nodes with rank , where . Figure 2 shows the node-node link distribution against corresponding node rank and . The node ranks are divided into 5% bins.
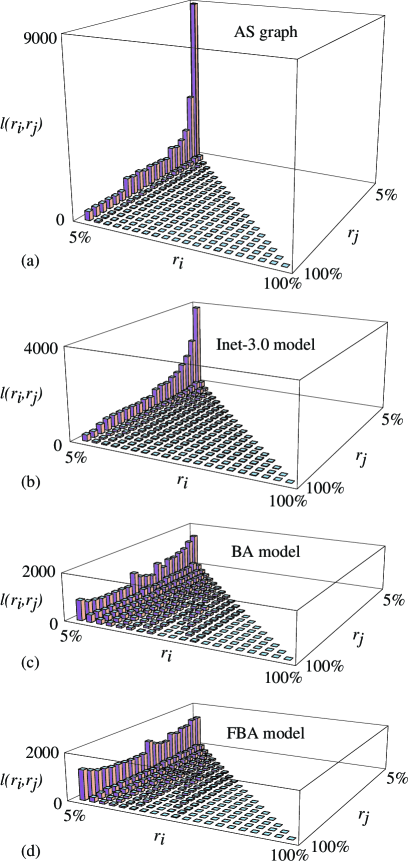
In the AS graph (Fig. 2a), rich nodes are connected preferentially to other rich nodes. The number of links between the top 5% rich nodes (far corner) is significantly larger than the numbers of links connecting the rich nodes to other nodes with smaller degrees (see the column with %).
The node-node link distribution of the Inet-3.0 (Fig. 2b) is similar to that of the AS graph, however, the number of links between the top 5% rich nodes of the Inet–3.0 model (far corner, 3697 links) is significantly smaller than that of the AS graph (8919 links).
The link distributions of the BA and the Fitness BA graphs (Fig. 2c, d) are different from that of the AS graph. The top 5% rich nodes of the BA and the Fitness BA graphs are connected to all nodes with similar probabilities regardless of the node degree. The graphs generated by these two models do not contain a rich–club.
We end this section with the following observation: in the AS graph, if we take the rich–club to comprise the nodes ranking 1% or less, the probability distribution of node degrees between the members of the club is not a power–law, instead is more like the distribution obtained from a random network.
IV Discussion and Conclusion
The AS graph has a core tier that we called the rich–club. Membership of the rich–club, as defined above, could be further limited by imposing the requirement of a relationship between the members of the club and their connectivity, for example that the average hop distance is less than . This relationship can be made more explicit if we approximate the rich–club to a random network. In this case the average hop distance , where is the number of nodes contained in the rich–club and is their average node degree which is approximated by .
We noticed that the BA and Fitness BA model do not have a rich–club due to the growth dynamics of the models. All new links connect with new nodes. Due to the preferential attachment, the probability for a new node to become a rich node decreases as the network grows. As a result, rich nodes are not well connected between each other. This suggests a simple modification to these models to generate a rich–club. As the network grows, new links appear which are preferentially attached between the existing nodes.
We believe that modeling the rich–club phenomenon is important because the connectivity between rich nodes can be crucial for network properties, such as network routing efficiency, redundancy and robustness. In the AS graph, there is a large number of alternative routing paths between the club members, their average path length is very small (1 to 2 hops). The rich–club acts as a super traffic hub and provides a large selection of shortcuts. Hence scale-free models without the rich–club phenomenon may under–estimate the efficiency and flexibility of the traffic routing in the AS graph. Also, networks without the rich–club may over–estimate the robustness of the network to a node attack, where the removal of a few of its richest club members can break down the network integrity.
References
- [1] M. Faloutsos, P. Faloutsos, and C. Faloutsos, “On Power-Law Relationships of the Internet Topology,” Proc. ACM/SIGCOMM, Comput. Commun. Rev., vol. 29, pp. 251–262, 1999.
- [2] L. Subramanian, S. Agarwal, J. Rexford, and R. H. Katz, “Characterizing the Internet Hierarchy from Multiple Vantage Points,” Proc. of INFOCOM 2002, June, 2002.
- [3] H. Tangmunarunkit, R. Govindan, S. Jamin, S. Shenker, and W. Willinger, “Network topology generators: Degree-based vs. structural,” Proc. of ACM/SIGCOMM 2002, 2002.
- [4] A. L. Barabási and R. Albert, “Emergence of Scaling in Random Networks,” Science, vol. 286, pp. 509–512, 1999.
- [5] J. Winick and S. Jamin, “Inet–3.0 Internet Topology Generator,” Tech. Report UM-CSE-TR-456-02, University of Michigan, 2002.
- [6] G. Bianconi and A. L. Barabási, “Competition and multiscaling in evolving networks,” Europhysics Letters, vol. 54, no. 4, p. 436, 2001.
- [7] R. Albert, H. Jeong, and A. Barabási, “Error and attack tolerance of complex networks,” Nature, vol. 406, pp. 378–381, 2000.
- [8] U. of Oregon, “Route Views Project,” http://www.routeviews.org.
- [9] Q. Chen, H. Chang, R. Govindan, S. Jamin, S. J. Shenker, and W.Willinger, “The Origin of Power Laws in Internet Topologies (Revisited),” Proc. of INFOCOM 2002, 2002.
- [10] U. of Michigan, “Topology Project,” http://topology.eecs.umich.edu.
- [11] R. Albert and A. L. Barabási, “Statistical mechanics of complex networks,” arXiv: cond-mat/0106096 v1, 2000.
- [12] P. Holme, B. J. Kim, C. N. Yoon, and S. K. Han, “Attack vulnerability of complex networks,” Physical Review E, vol. 65, 2002.
- [13] A. L. Barabási, R. Albert, and H. Jeong, “Mean-field theory for scale–free random networks,” Physica A, vol. 272, pp. 173–187, 1999.