GridMonitor: Integration of Large Scale Facility Fabric Monitoring with Meta Data Service in Grid Environment††thanks: This work is supported in part by the U.S. Department of Energy and the National Science Foundation.
Abstract
Grid computing consists of the coordinated use of large sets of diverse, geographically distributed resources for high performance computation. Effective monitoring of these computing resources is extremely important to allow efficient use on the Grid. The large number of heterogeneous computing entities available in Grids makes the task challenging. In this work, we describe a Grid monitoring system, called GridMonitor, that captures and makes available the most important information from a large computing facility. The Grid monitoring system consists of four tiers: local monitoring, archiving, publishing and harnessing. This architecture was applied on a large scale linux farm and network infrastructure. It can be used by many higher-level Grid services including scheduling services and resource brokering.
Keywords: Grid monitoring (GridMonitor), Grid Monitoring Architecture (GMA), Monitoring and Discovery Service (MDS).
I Introduction
Grid computing consists of large sets of diverse, geographically distributed resources that are collected into a virtual computer for high performance computation. The success of the Grid depends greatly on efficient utilization of these resource. The Particle Physics Data Grid (PPDG) is an example user of the data Grid. PPDG is a collaboration of computer scientists in distributed computing and Grid technology, and physicists who work on the major high-energy and nuclear physics experiments. These experiments include ATLAS, STAR, CMS, D0, and Babar. There are many computing resources involved in PPDG physics experiments. For example, the computing resources at Brookhaven National Laboratory (BNL) includes 1100 dual processor PCs which come from six different vendors. The Linux farms at the BNL RHIC/USATLAS provide 3.115 TFlops of computation power. The storage system provides 140 Tera-Bytes of disk space and 1.2 Peta-Bytes of robotic tape storage space. The diversity of these computing resources and their large number of users make the Grid environment vulnerable to faults and excessive loads. This seriously affects the utilization of Grid resources. Therefore, it is crucial to get knowledge about the status of all types of computing resources and services to enhance the performance and avoid faults.
Here we give an example to illustrate how a Grid application relies on Grid information service. A job scheduler needs information about available CPU resources in order to plan the efficient execution of tasks. A computing farm consists of a set of many hosts available for scheduling via Grid resource management protocols. If required by the exact nature of the interrelationship between the farm monitor and the job scheduler, the hosts at a given site may be broken down into multiple clusters that consist of homogeneous nodes, such that the local job manager can assume that any queued job can be run on any available node within the computing farm. Grid information service should provide the system status about each cluster, i.e. cluster configuration, associated storage system, and so on.
Many applications, fault detection, performance analysis, performance tuning, prediction, and schedule need information about the Grid environment. Good methods need to be designed to monitor resource usage, get the performance information and detect the potential failures. Due to the complexity of the Grid, implementing a monitoring system for such a large scale computing resource is not a trivial task. The targets to be monitored in Grid resource include CPU usage, disk usage, and network performance of Grid nodes. The ability to monitor and manage distributed computing components is critical for enabling high-performance distributed computing. Monitoring data is needed to determine the source of performance problems and to tune the system and application for better performance. Fault detecting and recovery mechanisms need monitoring data to determine where the problem is, what is the problem and why it happens. A performance prediction service might use monitoring data as inputs for a prediction model, which would in turn be used by a scheduler to determine which resources to use. As more people use the Grid, more instrumentation needs will be discovered, and more facility status needs to be monitored. Many researchers are focused on monitoring computer facility in a relatively small scale. The proposed systems are Autopilot RVSR98 , Network Weather services WSH99 , Netlogger Netlogger97 , Grid Monitoring Architecture (GMA) TCGLT2001 and Grid Information Service (MDS) CFFK2001 .
Due to the diversity of the computing resource and applications in Grid computing, existing monitoring architectures can not monitor all of the computing resources belonging to the Grid. When the size of a computing facility grows, the existing monitoring strategy will significantly increase the system overhead. The dynamic characteristics of the Grid allows the computing resources to participate and withdraw from the resource pool constantly. Only a few existing monitoring systems address this characteristic. In this work, we present a Grid monitoring system which is adaptive to the Grid environment. It includes:
-
•
Local monitoring: The local monitoring system monitors the facility which consists of computing, storage and network resources. The monitored information will be provided to different types of application with different requirements.
-
•
Grid monitoring: it uses MDS CFFK2001 to publish the selected monitoring information into the Grid system.
The proposed architecture can separate the facility monitoring from the Grid environment. By using the MDS, it provides a well-designed interface between the Grid and the facility. It can provide monitoring information for different Grid applications as long they use the Grid information protocols. When new hardware is added to the local facility, the local monitoring infrastructure can easily add the new software to monitor the system. The change of hardware and monitoring tools can be hidden from the Grid computing environment.
II Grid Monitoring Architecture
In this section, we specify the system requirements of Grid monitoring, provide the Grid monitoring infrastructure, and describe the design of each component in the system.
II.1 System Requirements
Due to the complexity and dynamics of the Grid computing model, the monitoring toolkits built on top of this computing model are also complex. To build an efficient and effective monitoring model, the designers and developers need to keep the following requirements in mind.
-
•
The Monitoring toolkits can make use of existing monitoring tools. The overhead for incorporating a monitor tool should be minimum. The Grid monitoring system should make use of existing facility infrastructures with well designed API, not force its own.
-
•
Scalability: the system for monitoring and fault management should be scalable. The number of Grid nodes will increase every year in order to satisfy the growing computing requirement of HENP. The monitoring system should be scalable for the expanding Grid system.
-
•
Flexibility: the system for monitoring should be flexible because the target to be monitored and the Grid architecture are likely to change over time.
-
•
Extensibility and Modularity should be implemented, which allows users to include those components easily that they wish to use. All Communication flows should not flow through a single central component. Having a single, centralized repository for dynamic data causes two performance problems. The centralized repository for information represents a single-point-failure for the entire system. The centralized server can create a performance bottleneck.
-
•
Non-intrusiveness: the Grid monitoring system should incur as small a system overhead as possible. It should not disrupt the normal running of the monitored system. This is extremely important if a large number of target systems are monitored.
-
•
Security: typically, an organization defines policies controlling who can access information about their resource. The monitoring system must comply with these policies.
-
•
Ability of logging: Some important data should be archived.
-
•
Inter-operability: Different monitoring systems could obtain and share each other’s monitoring information to avoid the functionality overlapping.
II.2 A Grid Monitoring Architecture Based on MDS
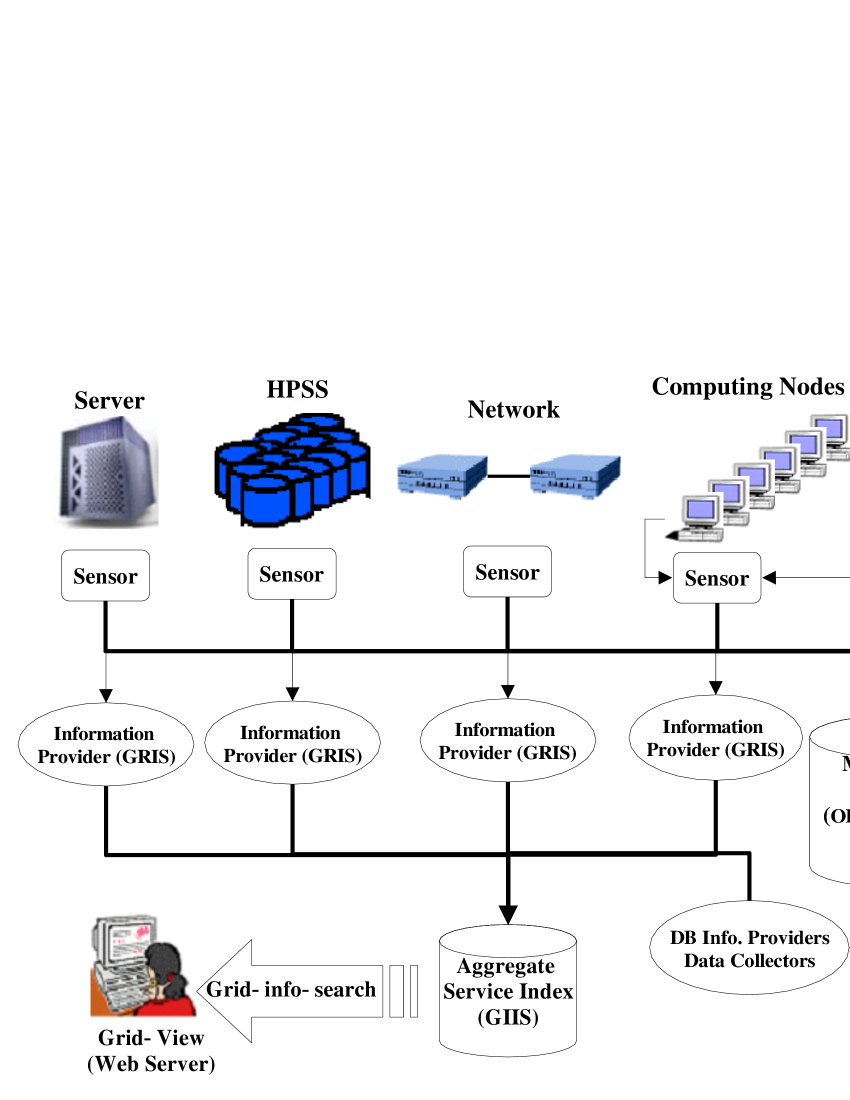
Grid monitoring infrastructure has a four-tiered structure: Sensors, Archive System, Information Providers and Grid Information Browser. Figure 1 shows how monitoring information travels through the four-tiered structure and reaches end users.
-
•
Sensors probe the target systems and obtain related statistics.
-
•
The data importer of the archive system fetches the statistics from sensors and stores them into the database.
-
•
The Grid information provider retrieves information from the database, processes it according to application requirements and returns the results to Grid systems.
-
•
The remote web server issues Grid commands to fetch monitoring information from the Grid information service.
II.2.1 Sensor
A sensor can measure the characteristics of a target system. It generates a time stamped performance statistics. A simple sensor example would typically execute one of the UNIX utilities, such as top, ps, ping, iperf, ndd, or read directly from system files, such as /proc/* to extract sensor-specific measurements. Sensors are used to monitor CPU usage, memory usage and network traffic. Some sensors can monitor and capture abnormal system status. We define the type of measurement generated by a sensor, a “metric”. As shown in Figure 1, four types of computer systems are monitored: file service, high performance storage system (HPSS), network equipment and computing nodes. Each sensor relies on a set of standard APIs and protocols to publish the sensor data. The design of the API and protocol is beyond the scope of this paper.
II.2.2 Archive System
The Archival system is used to hold historical data that can be used for predication and analysis. There are two components in archival system: data importer and telemetry database. An importer fetches the monitoring data from sensors via standard API, and saves the received data into the telemetry database. The database consists mostly of telemetry gathered by different sensors of different metrics. Some databases might include derived parameters, statistics, and any other data elements required by the Grid application. A telemetry database can be any relational database, such as Oracle, MySQL, PostgreSQL, it can even be a set of flat files. A telemetry database also acts as a server to answer all types of telemetry queries. Therefore it needs to support flexible, complicate query operations and powerful query language. SQL is a perfect candidate. But the SQL’s for different relational databases are different from each other, and they do not support interoperability. To hide the details of the underlying databases and provide the user a uniform SQL interface, we use ODBC 111http://www.odbc.org to wrap the telemetry databases. This implementation allows greater flexibility in the archiving system.
II.2.3 Information Provider
The information provider provides detailed, dynamic statistics about instrumentation to Grid monitoring service, MDS. It is managed and controlled by MDS. The information provider either invokes and stops a set of sensors to do active probing, or interacts with running sensors to obtain the current status of resource. An information provider can also query the database to get historical information. We implemented our customized information provider to fetch information from the telemetry database, process the information if necessary, and return the necessary information to the MDS which invokes the information provider.
II.2.4 Grid Information Browser
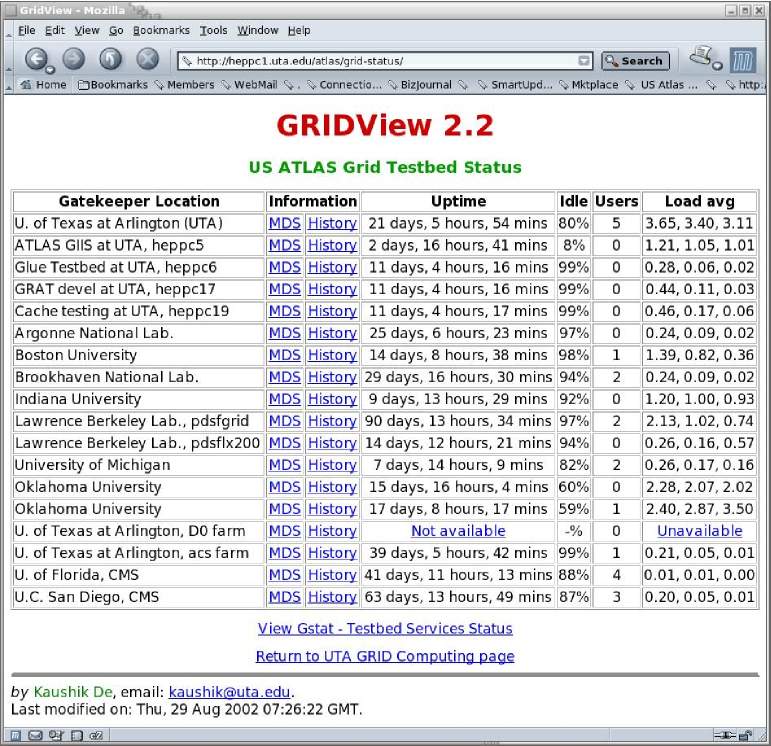
GridView222http://heppc1.uta.edu/atlas/gridview was developed at the University of Texas at Arlington (UTA) to monitor the U.S. ATLAS Grid. It was the first application software developed for the U.S. ATLAS Grid Testbed, released in March, 2001, as a demonstration of the Globus 1.1.3 toolkit. The original text version of GridView provides a snapshot of dynamic parameters like cpu load, up time, and idle time for all Testbed gatekeepers through a web page, updated periodically. MDS information from GRIS/GIIS servers is available through linked pages. In addition, a MySQL server is used to store archived monitoring information. This historical information is also presented through GridView. A java applet version of GridView is also available. This applet version presents a hierarchical display of grid services through a graphical map-centric view. As prototype grids become larger and offer more services it becomes desirable to have a quick and easy method for determining which sites have less than a complete set of operational services, along with detailed error messages for services that are failing. GridView fulfills this need by performing tests of the Globus Toolkit based services at grid computing resources and presenting the results via an applet that provides different views of the state of the testbed.
GridView is comprised of two different subsystems, a data collection daemon and a Java applet for visualization. The data collection process periodically contacts remote computing systems to ascertain the operational status of the three services offered by the Globus Toolkit. During the testing at the remote system, a transcript is maintained of the tests performed, the status of the tests and any generated error messages that indicate faulty services. Also saved during testing is the information provided by the Globus Monitoring and Discovery Service (MDS) for both Grid Information Index Services (GIIS) and Grid Resource Information Services (GRIS). At the completion of a testing cycle, the data collection daemon publishes this information to an HTTP server that provides the applet to users.
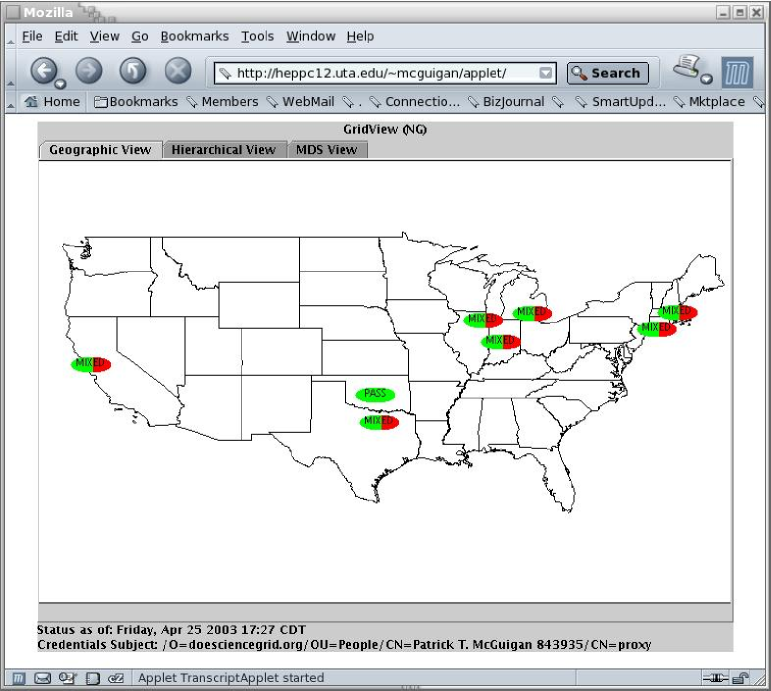
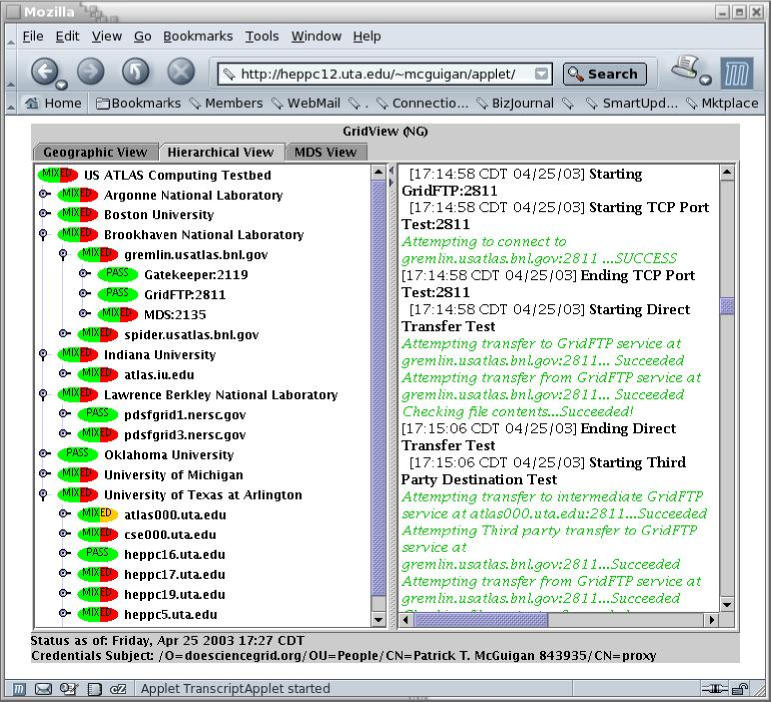
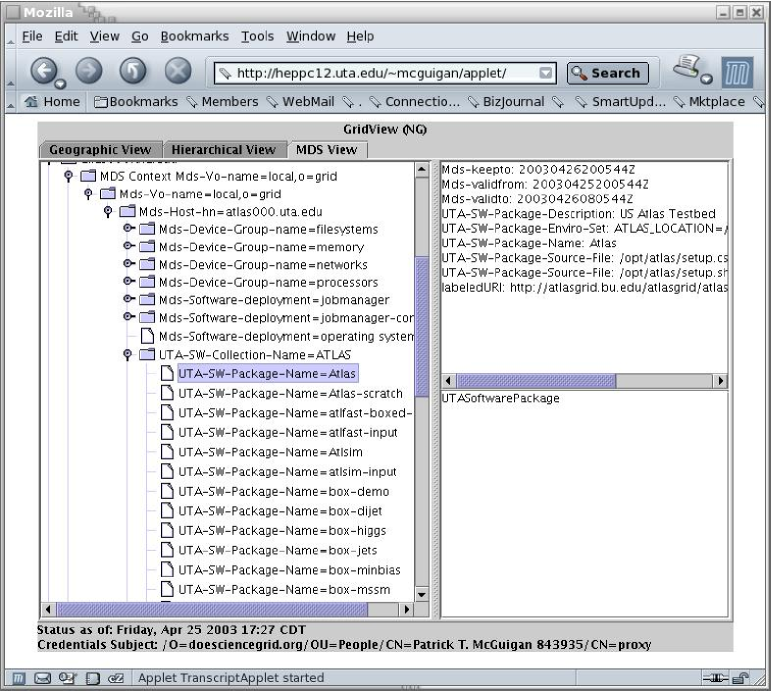
The visualization applet uses the information recorded by the data collection daemon and presents it in three differing views via an HTTP server. Figure 3 presents a geographical representation where top-level computing sites are shown on a map of the continental United States. A status icon for each site shows the combined status of all computers tested at the site. This view provides a quick snapshot of the overall status of the U.S. ATLAS computing testbed. A hierarchical view of the data shows users the status information for every test and test sequence along with the related transcripts associated with the tests. By following the color-coded status icons, users can quickly determine which tests failed at which sites. Clicking on a particular test or test sequence will automatically bring the associated test transcript into view, as shown Figure 4. Finally, the users can inspect the contents of the MDS services offered in the testbed, as shown in Figure 5. This is a graphical and hierarchical view of the data retrieved during testing. The main goal of this screen is to allow users to view static MDS entries as well as the exact values of dynamic entries that have violated the LDAP consistency tests. Figure 2 shows the status of USATLAS Grid testbed as viewed through the GridView text interface.
II.2.5 Desired Features of the System Architecture
The proposed architecture can separate the facility monitoring from the Grid environment. The changes in hardware and monitoring tools can be hidden from the Grid computing environment. When new hardware is added in the local facility, the local monitoring infrastructure can easily add the new hardware to the monitoring system. This monitoring system simplifies the design of new sensors: new sensors can be plugged into the monitoring architecture with minimum effort. The sensors do not need to know who wants to subscribe to this metric and the number of the subscribers. The subscribers (consumers) can also be simplified because they just need to tell information provider what metric they are interested in. It is up to the information provider to deliver the specified metrics to the subscribers. The MDS information provider provides a well-designed interface between the Grid and computing facilities. It can provide monitoring information for different Grid applications as long they use protocols provided by the MDS CFFK2001 . By distributing and replicating the telemetry databases and MDS servers in different locations, we can avoid the problems caused by a single centralized server.
-
•
The MDS provides the cache copy of the lastest value from the MySQL database.
-
•
Non-intrusiveness: Sensors and local monitoring tools put less than 1 Percent CPU Load on the entire system. The information provider can prevent users from directly accessing to the database server, protect the sensitive information in the database effectively.
-
•
Scalability: 1100 linux nodes and the network connectivity of eight USATLAS testbeds are monitored by our system without adding too much load on the target systems.
-
•
Flexibility: Independent of Sensors. Many sensors can be easily plugged in as long as they have a well defined protocol and API. Another advantage is that the archival system is independent to the underlying database.
III Related Works
Ganglia: Ganglia ganglia is a scalable distributed monitoring system designed for high performance computing systems such as large localized clusters and even widely distributed Grids. It relies on a multicast-based listen/announce protocol to monitor the state within clusters and uses point-to-point connections among representative cluster nodes to federate clusters into a Grid and aggregate their states. Ganglia has the advantages of low per-node overhead, high concurrency and robustness.
Ganglia has been deployed at BNL on the RHIC and Atlas clusters to successfully monitor over 1000 nodes, organized into 10 separate clusters based on experiment. One collection node has been setup to gather all of the data from these clusters and archive it locally to be displayed by ganglia’s web front end. The data is made available to each experiment for their own monitoring and job scheduling needs and is also published through Globus MDS.
Network Weather Service (NWS): The goal of the Network Weather Service is to provide accurate forecasts of dynamically changing performance characteristics from a distributed set of meta-computing resources. It can produce short-term performance forecast based on historical performance measurement. The Network Weather Service attempts to use both existing performance monitoring utilities and its own active sensors to make use of resource, probe its own usage and measure the performance. It can measure the fraction of CPU time available for new processes, TCP connection time, end-to-end TCP network latency, and end-to-end TCP network bandwidth. It has NWS sensors, CPU sensors, network sensors. It also has predictors that forecast the system performance. NWS was widely adopted by many Grid communities. Therefore, we will incorporate NWS in our Grid monitoring toolkits. We can pull out the sensor modules and prediction modules and put them into our monitor architecture. We also need to design an interface that can bridge the communication between the sensors and the telemetry database.
Simple Network Management Protocol (SNMP): Since SNMP was developed in 1988, the Simple Network Management Protocol has become the standard for inter-network management. Because it is a simple solution, requiring little code to implement, we can easily build SNMP sensors for our monitoring architecture. SNMP is extensible, allowing us to easily add network management functions to the monitoring system. SNMP also separates the management architecture from the architecture of the hardware devices, which broadens the arena of our monitoring architecture. SNMP is widely available today and has extensive support from academic, commercial vendors and research institutes. Therefore, SNMP based tools are widely used for network monitoring and management. SNMP based tools and sensors should be evaluated for our Grid monitoring system.
Monitoring and Discovery Service (MDS): MDS provides the Grid information in Globus gridbook and OGSA OGSA . The MDS stores the information collected by its information providers in a cache. These information providers are run periodically to update the information about the hosts, networks, memory usage, disk storage and software available on the system and batch queue status. MDS is designed to monitor large number of entities and help users to discover and keep track of these resources. It supports a registration protocol which allows individual entities and their information providers to join and leave MDS dynamically. The monitoring infrastructure is organized hierarchically, built on top of the LDAP server (light weight directory access protocol ldap-1 ; ldap-2 ). MDS provides LDAP compatible client tools to access the MDS server. Due to its LDAP-based implementation, MDS is not designed to handle highly volatile monitoring data.
Grid Monitoring Architecture (GMA): The Grid Monitoring Architecture consists of three components: directory service, producer and consumer. Producers publish their existence, description and type of performance data to the directory service. Consumers query the directory service and subscribe to the selected producer. The time-stamped performance data, called events, are directly sent from the producers to consumers based on subscription entries stored at the directory service. Grid Monitoring Architecture supports both a streaming publish/subscribe model, and query/response model. Compared with MDS, the GMA supports the highly dynamic monitoring data. The data stream continuously flows from producers to consumers until the subscription becomes invalid.
IV Conclusion
Grid computing benefits from a scalable monitoring system. GridMonitor is a promising candidate for this role. It can be used to monitor several thousand computers, geographically distributed among several computing centers. It naturally integrates large scale fabrication monitoring into the grid system. The initial prototype was deployed at Brookhaven National Laboratory. Open challenges include performance, availability of crucial system status information, robustness and scalability.
Acknowledgements.
The authors wish to thank RHIC/USATLAS computing facility group for their valuable comments and discusses for this work. This work is supported by grants from the U.S. Department of Energy and the National Science Foundation.References
- (1) Czajkowski, K. and Fitzgerald, S. and Foster, I. and Kesselman, C. “Grid Information Services for Distributed Resource Sharing”, Proceedings of 10th IEEE International Symposium on High Performance Distributed Computing (HDPC-10), IEEE Press, San Francisco, California, August, 2001.
- (2) Wolski, R., Spring, N., and Hayes, J., “The Network Weather Service: A Distributed Resource Performance Forecasting Service for Metacomputing”, Journal of Future Generation Computing Systems, volume 15, October, 1999.
- (3) Tierney, B., Crowley, B., Gunter, D., Lee, J., and Thompson, M., “A Monitoring Sensor Management System for Grid Environments”, Cluster Computing Journal, volume 4, number 1, 2001.
- (4) Tierney, B. L., “The NetLogger Toolkit: End-to-End Monitoring and Analysis of Distributed Systems”, http://www-didc.lbl.gov/NetLogger/.
- (5) Ribler, R.L., Vetter, J.S., Simitci, H., and Reed, D.A., “Autopilot: Adaptive Control of distributed applications”, Proceedings of 7th IEEE International Symposium on High Performance Distributed Computing (HDPC-10), IEEE Press, 1998.
- (6) Foster, I. and Kesselman, C., eds., The Grid: Blueprint for a New Computing Infrastructure, Morgan Kaufman, 1999.
- (7) Foster, I., Kesselman, C., Nick, J. and Tuecke, S. “The Physiology of the Grid: An Open Grid Services Architecture for Distributed Systems Integration”, Global Grid Forum, June 22, 2002.
- (8) Howes, T., Smith, M., and Good, G. “Understanding and Deploying LDAP Directory Services”, Macmillan Technical Publishing, 1999.
- (9) Howes, T. and Smith, M., “LDAP: Programming Directory Enabled Applications with Lightweight Directory Access Protocol”, Macmillan Technical Publishing, 1997.
- (10) Massie, M. L., Chun, B. N., and Culler, D. E. “The Ganglia Distributed Monitoring System: Design, Implementation, and Experience”, submitted for publication, February 2003.