The Persint visualization program for the ATLAS experiment
Abstract
The Persint program is designed for the three-dimensional representation of objects and for the interfacing and access to a variety of independent applications, in a fully interactive way. Facilities are provided for the spatial navigation and the definition of the visualization properties, in order to interactively set the viewing and viewed points, and to obtain the desired perspective. In parallel, applications may be launched through the use of dedicated interfaces, such as the interactive reconstruction and display of physics events. Recent developments have focalized on the interfacing to the XML ATLAS General Detector Description AGDD, making it a widely used tool for XML developers. The graphics capabilities of this program were exploited in the context of the ATLAS 2002 Muon Testbeam where it was used as an online event display, integrated in the online software framework and participating in the commissioning and debug of the detector system.
I INTRODUCTION
Graphics programs in High Energy Physics experiments are necessary to visualize the detectors geometry and display physics events. They help in the commissionning phase of the experiment in debugging and understanding the systems. They must provide an interactive access to the event data and their reconstruction through online and offline algorithms. As such they play an important role in the search and discovery of new physics.
Persint (Perspectively interacting) is an interactive visualization program persint which is developed primely for the ATLAS collaboration atlas . The display of objects and the interactivity between the user and objects or applications is realized through the use of the HIGZ package higz . Facilities dedicated to the spatial navigation and the definition of the visualization properties are provided, in order to interactively set the viewing and viewed points, so as obtain the desired perspective. In parallel, applications may be launched through the use of dedicated interfaces, such as the interactive reconstruction and display of physics events.
II DESCRIPTION OF THE PROGRAM
II.1 Scope of the program
Persint was originally developed as a tool for debugging and optimizing the ATLAS Muon pattern and track reconstruction algorithm Muonbox muonbox1 . It was early realized that traditional event displays based on simple projections were not fit to the task of visualizing events in the toroidal, inhomogeneous field of the muon spectrometer. Only a three-dimensional interactive tool with navigation capabilities is well suited for such a task.
The program is now routinely used for Event Display of hits and reconstruction objects of complex Monte Carlo events and in TestBeam applications, both online and offline. Persint is used for the visualization of detector geometries : as such it is interfaced to AMDB (the ATLAS Muon Database) and the AGDD-XML ATLAS Generic detector description.
Other applications include the visualization of the magnetic field, the Level-1 Muon Trigger Logic, the interactive generation of tracks, and the display of XML event hits.
II.2 Features
The program offers the following features :
-
•
3-dimensional representation of objects in full volumes or wire frames
-
•
computation of hidden faces
-
•
highlight of volumes edges
-
•
lighting intensity effects on volume facets
-
•
detection of clashing volumes and highlight of intersections
-
•
boolean volume operations (addition, subtraction, intersection)
-
•
spatial navigation with real-time displacements
-
•
focal length adjustable at will (from isometry to wide-angle)
-
•
interfaces and access to applications
-
•
save to postscript
-
•
documentation
II.3 Design
The core of the program is written in Fortran90. Dynamic data objects are extensively exploited in order to minimize the memory usage which can become important when a large numbers of volume are displayed, a situation typical to modern HEP experiments, both with respect to the detector description and the event data themselves.
Persint uses the following features of F90 :
-
•
usage of Modules, with procedure interfaces
-
•
Polymorphism
-
•
Recursive functions
-
•
Dynamic arrays
-
•
Allocate, for local memory management
-
•
Pointers
-
•
String operations
-
•
Array manipulations
-
•
Free source forms
The graphics interface is HIGZ higz and in general the program makes extensive use of the CERNLIB cernlib . It is built on 26000 lines on code and is part of the Saclay Muon software suite. As such it is interfaced directly to the geometrical database Amdbsimrec (13000 lines), the magnetic field database Bfielddtb (3500 lines) and the track reconstruction algorithm Muonbox (58000 lines) muonbox1 .
The code is highly modular, organized in patches. The XML section is such an example of a patch. It contains everything needed to parse, store transiently and generates volumes from standardized XML files.
The computation of volumes with hidden faces is based on the analytical computation of facets’ edges in space. This computation also provides the detection of clashes and the highlights of the volumes intersections, and supports boolean volume operations.
The program is designed to operate in standalone mode, keeping the possibility of integration in frameworks. It was for example successfully used in the context of the online software framework of the ATLAS testbeams.
II.4 Releases and documentation
The program is released officially at CERN on AFS in a public directory 111/afs/cern.ch/atlas/offline/external/Persint/ since version 2.00 for three platforms : Linux, Sun-Solaris Unix and Compaq/Alpha Unix. This repository contains the source and executable files together with documentation and useful input databases, and for developers, the tools necessary to build, compile and load the code. The latest released version is 3.00.
The documentation can be found in the Persint Manual located in the public repository or on the dedicated Persint Web Page 222http://cern.ch/Atlas/GROUPS/MUON/persint.html. This page provides updates on the releases.
III PRESENTATION OF THE PROGRAM
III.1 General layout
The program is designed around the command window and the HIGZ display window. A typical view obtained with the Display Window is shown in Figure 1. The command window is used essentially to load files and type commands interpreted by the code and documented in the Persint Manual. The display window however is organized in such a way to provide maximum interactivity to avoid typing commands as much as possible.
The display window is dedicated to the colour display of both the objects computed by the program for visualization and the graphical interfaces. The primary interface is the Navigator.
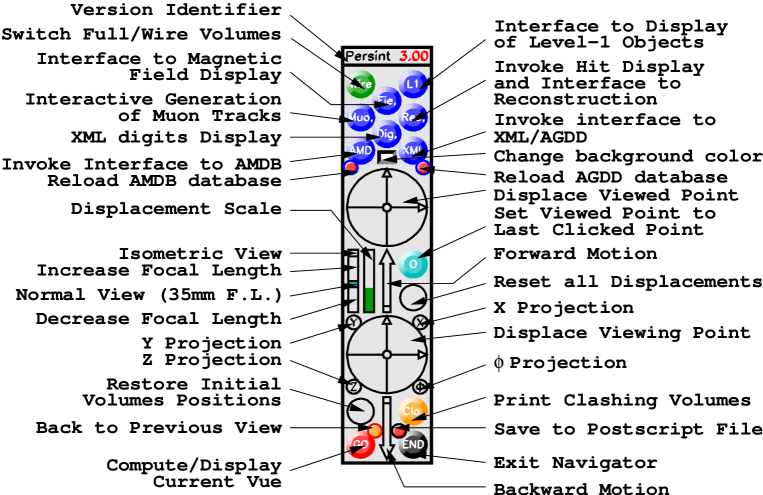
The Navigator supports the navigation facilities necessary to survey the entire detector space and gives access to the various graphics applications provided by Persint. Its layout is shown in Figure 2. It consists in an ensemble of push buttons and gauges which can be clicked, so as to modify the visualization properties or access lower level interfaces.
III.2 Navigation
The spatial navigation, as well as the modification of the visualization properties, are realized through the use of gauges which define the amplitudes of the movements of the Viewing and Viewed Points and of the change in focal length of the observer eye, such as to obtain the desired perspective. Each action is validated with the “GO” Push Button.
Alternatively, the navigation can be performed through real time displacements of the observer point. Continuous displacements are obtained by dragging the cursor over the display itself, thus bypassing the use of the Navigator.
III.3 Visualization properties
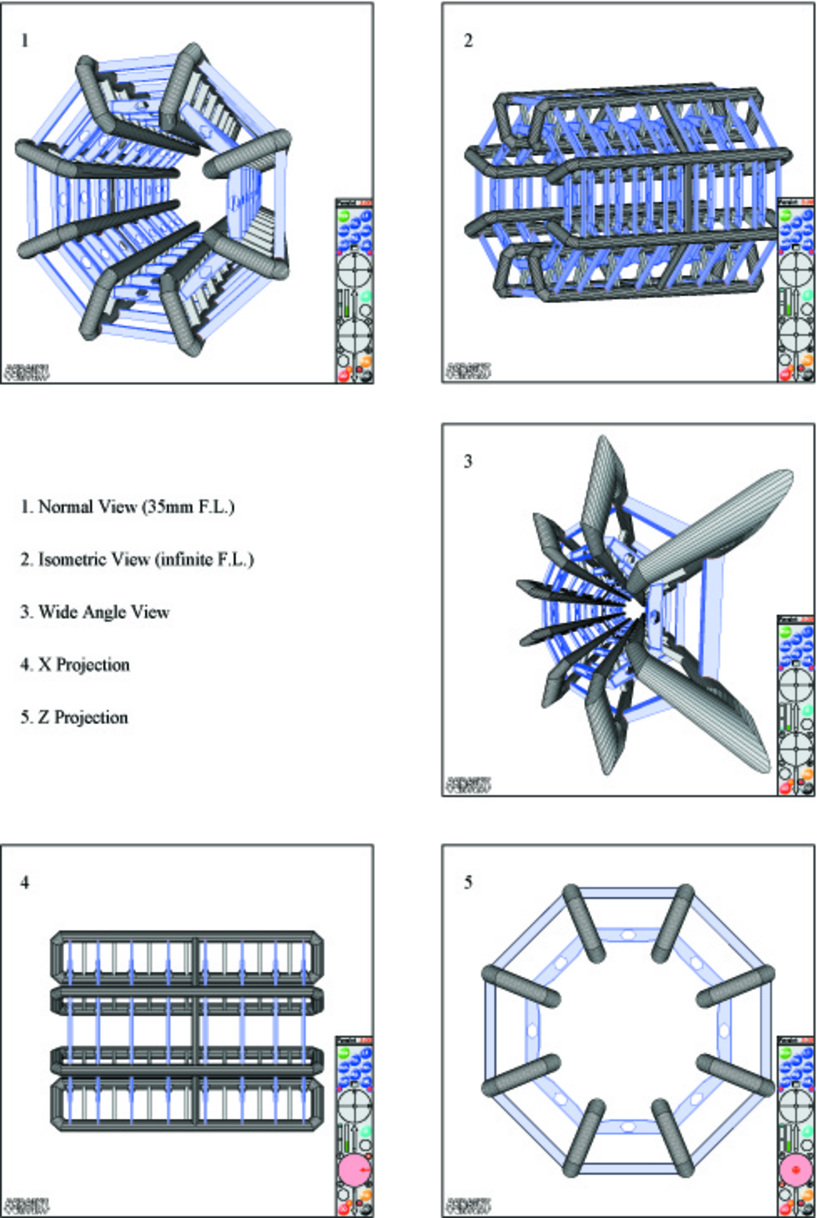
Persint offers the possibility to modify interactively the visualization focal length. In the Navigator, a sectioned gauge may be used to select the Normal View, equivalent to a focal length of 35 mm, the Isometric View, equivalent to an infinite focal length, or to increase or decrease the focal length at will.
Moreover, X, Y, Z, or projections of the volumes on display may be obtained by clicking dedicated push buttons (see Figure 2). In the case of X, Y, and Z projections, the observing point position (e.g. X or X) can be modified by clicking the “Displace Viewing Point” 2D gauge on the corresponding half. In the case of projection, this same gauge can be used to define the value of . Examples of visualization of the same volumes with different perspectives are presented in Figure 3.
IV EVENT DISPLAY
The interactive reconstruction and event display (EVD) application of Persint is dedicated to the reading of event hit files, the visualization of these hits, and the reconstruction of the event through coupling to the Muonbox program muonbox1 .
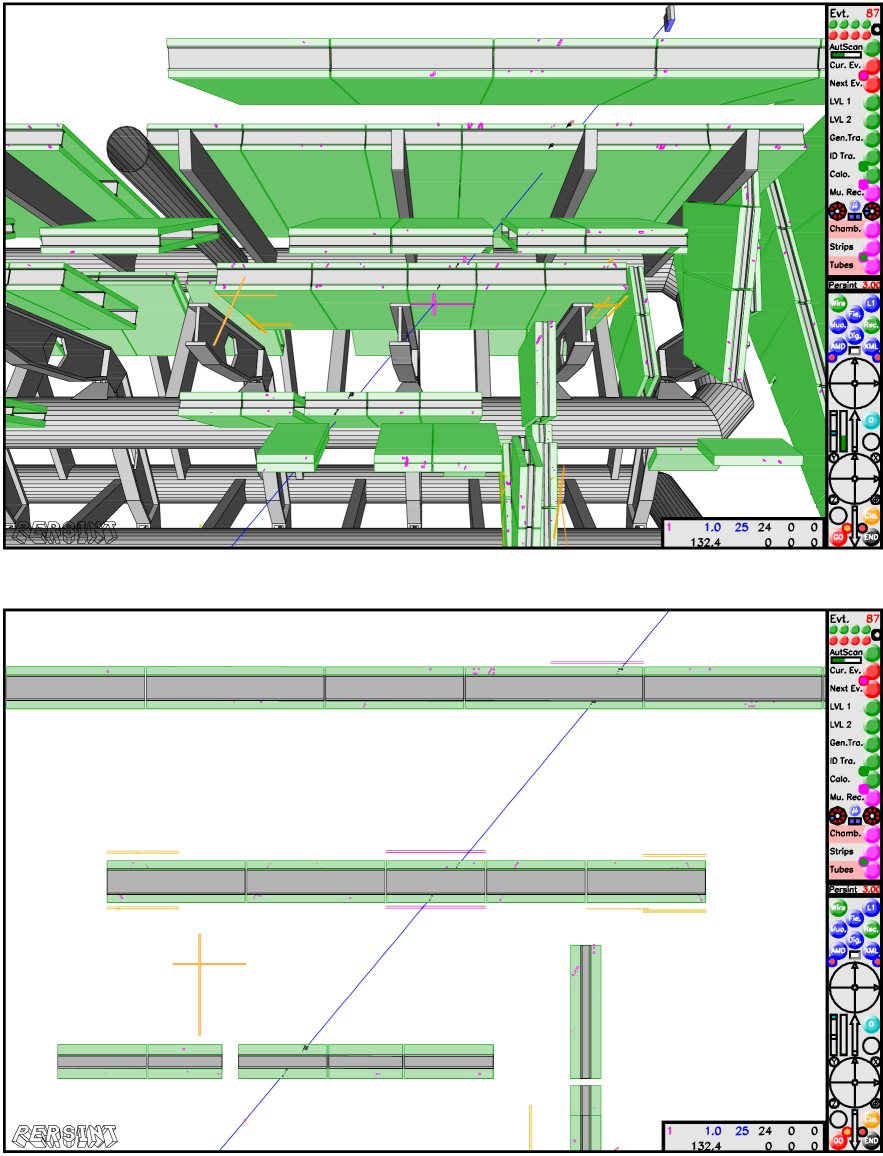
The three-dimensional view of complex events is used to understand complex events and debug the reconstruction algorithms. Figure 4 shows a display of a Monte Carlo event in the ATLAS Muon spectrometer in the context of a high background environment. Such events are generated with the Geant3-based DICE simulation dice . All hits and activated muon chambers are displayed. The reconstructed track is displayed in blue. Visual inspection confirms the efficiency of the reconstruction algorithm in terms of pattern recognition and fitting.
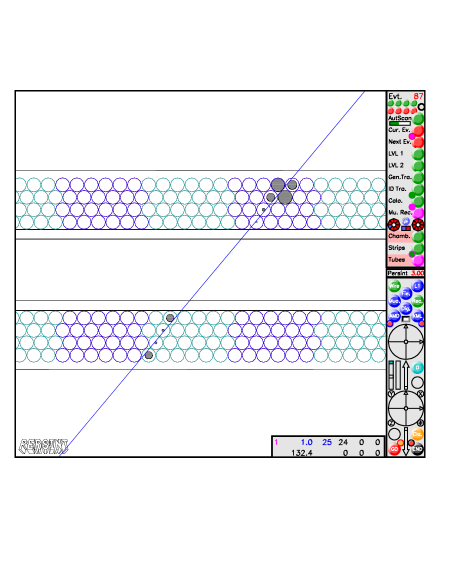
The projective views allows to further examine the events, though it is necessary to restrict the investigation to a limited region of the apparatus. Zooming on detectors is performed to very carefully check the event properties and reconstruction consistency, as illustrated in Figure 5.
In Figure 4 one notes the Interactive Reconstruction and Event Display Interface opened on top of the Navigator. This interface is equipped with an ensemble of push-buttons to set the visual properties of the displayed event and to activate the reconstruction. A separate embedded window is used to display the statistics of the event. The statistics consist essentially in the number of hits of the event, the number of hits taken into account in the candidate tracks, the reconstructed momentum, and if required from the datacards in case of physics channels analysis, the reconstructed invariant mass.
The interfacing between Persint and Muonbox makes it possible to act interactively on the event characteristics to understand which role they play. For instance, a hit tube or a strip can be removed interactively from the event. Then, when re-running the reconstruction algorithms, this removed tube will not be taken into account.
The Persint EVD was used in the design and optimization phase of the Muon Spectrometer, participating in the performance studies of the apparatus and reconstruction software muontdr . It then contributed in refining the performances of this software on complex Monte Carlo physics channels phystdr .
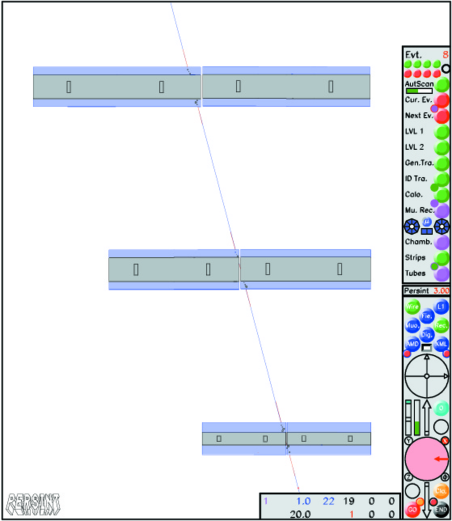
The program is used in the context of muon testbeams to display events on either online of offline mode h8_2001 . Event displays are useful to testbeams in order to validate the commissioning of the entire chain of detectors and data acquisition. When data is recorded in a routine mode, the EVD participate in the online monitoring and the quality control of the dataflow. An example of testbeam event is shown in Figure 6. It consists in a staight muon track reconstructed in the Barrel stand of the H8 2002 Muon System tests h8_2002 . Chambers misalignment is corrected using conditions alignment data.
V GEOMETRY VISUALIZATION
Powerful graphics tool are necessary to develop and debug the geometrical descriptions of the complex HEP detectors. Not only 3D viewers and projective capabilities must be used, but also the possibility to automatically detect geometrical conflicts.
An essential feature of geometry visualization programs is to be able to delineate precisely the volume edges. This is of primary importance in order to clearly identify the volumes boundaries in space and their possible interferences. Such visual property offers a much better understanding and comprehension of the detector geometry to the end user.
Modern geometrical description in HEP makes extensive use of boolean volume operations, which greatly simplifies the task of describing complicated geometries. Visualization tools must therefore support such technology.
The Persint program is interfaced to the two detector description used for the ATLAS Muon Spectrometer : AGDD-XML and AMDB.
V.1 Interface to AGDD-XML
The Atlas Generic Detector Description is based on standardized XML files. Such a description is used to describe the Muon Spectrometer geometry agdd . This description is implemented in the reconstruction algorithm.
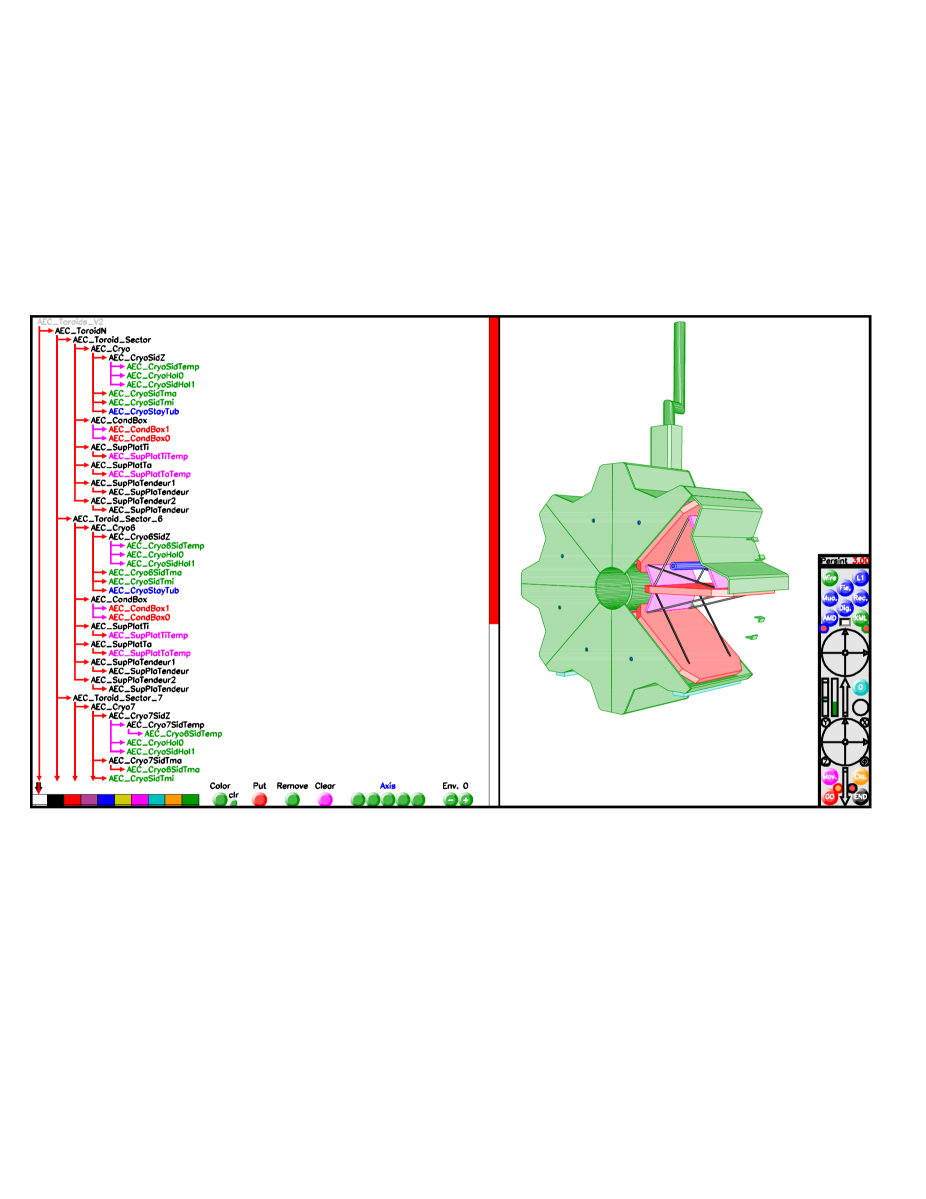
The Persint program benefits from an XML parser to interpret the corresponding geometrical description. The working of the interface to AGDD is based on the representation of a fully clickable tree-like structure allowing selection of the desired volumes for display. An operating example is given in Figure 7, showing both the XML structure and the corresponding volumes, in this case one of the ATLAS Endcap toroid.
The interface offers the representation of the volume tree in its full depth. The user can deploy or hide sub-structures by clicking Volume Tree Pointers appearing as arrows.
Conveniently, geometries can be visualized in parallel as they are being developped. After a possible modification, clicking on a a dedicated push button of the Navigator (see Figure 2) results in the reloading of the database.
V.2 Interface to AMDB
The ATLAS Muon Database is an object-oriented database for simulation and reconstruction 333see http://cern.ch/muondoc/software/Database/. It is extensively used in the detectors and physics performance studies conducted since the origin of ATLAS muontdr ; phystdr . In particular, it is used synchroneously by the DICE Geant3 simulation of the experiment dice and the muon reconstruction program Muonbox muonbox1 .
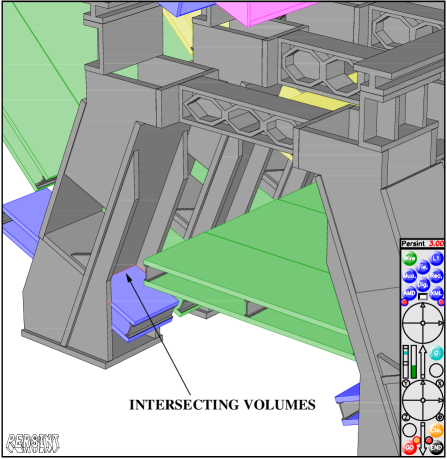
This database is heavily used to study the ongoing changes to the spectrometer layout crack . Such changes are caused by the need to take into account integration and access constraints. Also, the possible staging of ATLAS will lead to multiple geometrical configuration, to be optimized by simulation. In this context of evolving geometries, Persint provides a tool to carefully scrutinize and validate the geometrical databases. One of the important capabilities of Persint is to detect and highlight intersecting or clashing volumes. An illustration is given in Figure 8, where a conflict between a muon chamber and the feet of the detector is observed.
VI BOOLEAN OPERATIONS
Persint offers the rare feature of being able to compute fully and display volumes resulting from Boolean operations.
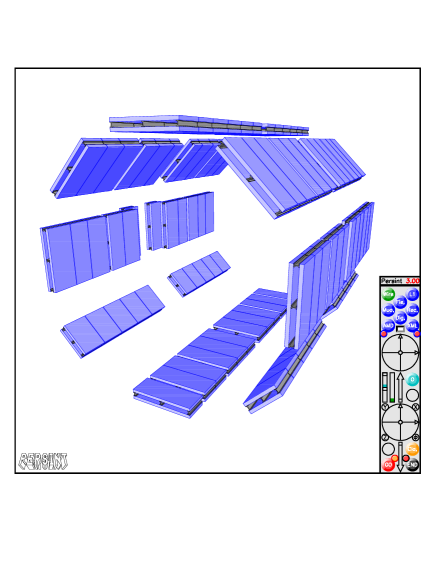
Being given two initial Supervolumes (a Supervolume is an ensemble of volumes), the program is able to perform the three basic operations (addition, subtraction, intersection) to generate a new Supervolume. This facility is independent of the complexity of the initial objects. An example is shown in Figure 9, which illustrates how the program can generate the voussoirs of the Barrel Toroid.
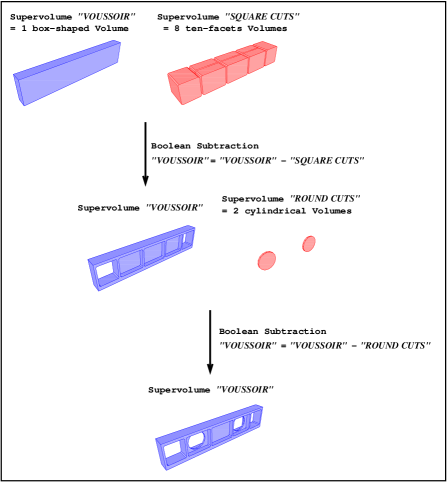
Using this feature of Persint, it is possible to generate complex-shaped volumes from very basic objects. The program provides, through the Command Mode, a set of instructions allowing to generate basic volumes and to perform Boolean operations.
VII OTHER APPLICATIONS
The Persint program is interfaced to a variety of application. They are all accessed through the Navigator (see Figure 2).
The Level 1 Interface is the application allowing the interactive access to the Level-1 Muon Trigger configuration datafiles and the visual representation of the variety of objects involved in the trigger decision chain. This interface is extensively described in L1persint .
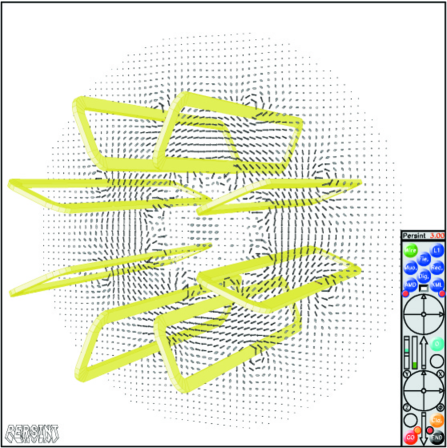
The Magnetic Field Interface provides a fully interactive 3D visualization of the Magnetic Field and the magnet elements. This application is coupled to the Bfielddtb set of subroutines that read the field database and compute the field at any given point 444see http://cern.ch/Atlas/GROUPS/MUON/magfield/. The field is visualized by means of arrows located at a series of lattice points. An example is shown in Figure 10. The direction and length of the arrow correspond to the direction and magnitude of the B-field. The lattice, either 2D or 3D, is customized by the user in terms of mesh and spatial limits, allowing to build the vector field either in very localized regions or over large distances.
The Muon Tracks Interface is used to generate and compute tracks of muons throughout the entire detector system. It is coupled to Muonbox, to the detector description and the magnetic field database, in order to compute the track’s trajectory, taking into account the deflections in the field, the multiple scattering, and the energy loss in matter.
VIII PERFORMANCES
Performances are difficult to estimate, as the visualization programs have too face many possible situations in terms of user demand, and number of volumes to display.
A test is performed here as follows : the display and navigation capability is estimated on a 2.8 GHz Pentium 4. It requires 0.65 s to compute and display the 2300 voulumes with 15000 facets of the Muon precision chambers system. The real-time displacements are fluid ( 10 views per second) for a number of volumes 400.
An event scan on testbeam data provides another performance measurement. In the exercise consisting in the display of events in loop with 6 chambers and typically 20 hits, it needs 0.02 s/event for bare EVD. This an order of magnitude less than the time needed to reconstruct the event : 0.20 s/event.
IX CONCLUSIONS AND PROSPECTS
The present design of the program has strong advantages. The user can download a single executable binary files. No special dynamic library loading, no fancy APIs need to be installed. The program is efficient even if operated remotely, e.g. on remote clusters from a X-terminal.
On the other side, the program has shortcomings. It uses a limited graphics interface (256 colors in the current version of HIGZ, possibly extended to 1024). It does not profit from the high performance capabilities of graphics cards when operated locally on PCs (Z-buffer).
In the developments under consideration, a migration to OpenGL is envisaged. However some of the features of the present design would be lost. For example, such technology based on Z-buffer doesn’t allow to delineate the volume edges. This property is crucial for HEP detectors.
It is considered to integrate parts of Persint in the ROOT data analysis framework. The graphics capabilities of ROOT would be enhanced by using the calculus of hidden faces and intersecting volumes. In parallel, the integration of Persint in the ATHENA Atlas software framework for reconstruction and analysis can be studied.
The utilization of Persint will continue as an event and geometry display for the ATLAS experiment. It will be used as online EVD in the H8-2003 Muon Testbeam, and in the H8-2004 ATLAS Combined Testbeam. It will have an important role to play in the commissioning of ATLAS, participating in the debug of the detector (cosmics run, calibration runs,…). Finally it is a candidate for the ATLAS Online EVD for monitoring of data-taking.
References
- (1) M. Virchaux, D. Pomarède, ATLAS Internal Note ATL-SOFT-2001-003 (2001).
- (2) ATLAS Technical Proposal, CERN/LHCC/94-43, LHCC/P2, 15 December 1994.
- (3) HIGZ High Level Interface to Graphics and Zebra User’s Guide, CERN Program Library Long Writeups Q120, Application Software Group, Computing and Networks Division, CERN, Geneva, Switzerland, june 1995.
- (4) M. Virchaux, et al., ATLAS Internal Note ATL-MUON-97-198 (1997).
- (5) CERNLIB (CERN Program Library) : short writeups, Application Software Group, CERN - Geneva, 1996.
- (6) A. Artamonov, et al., ATLAS Internal Note ATL-SOFT-2001-015 (2001).
- (7) ATLAS Muon Spectrometer Technical Design Report, CERN/LHCC/97-22 (1997).
- (8) ATLAS Detector and Physics Performance Technical Design Report, CERN/ LHCC/ 99-14 (1999).
- (9) D. Pomarède, M. Virchaux, ATLAS Internal Communication ATL-COM-MUON-2002-013 (2002).
- (10) T. Alexopoulos et al., ATLAS Internal Communication ATL-COM-MUON-2002-007 (2002).
- (11) S. Goldfarb, ATLAS Internal Note ATL-MUON-95-014 (1995).
- (12) D. Pomarède, et al., ATLAS Internal Note ATL-MUON-2000-023 (2000).
- (13) D. Pomarède, et al., ATLAS Internal Note ATL-DAQ-2002-001 (2002).