A Monitoring System for the BaBar INFN Computing Cluster
Abstract
Monitoring large clusters is a challenging problem. It is necessary to observe a large quantity of devices with a reasonably short delay between consecutive observations. The set of monitored devices may include PCs, network switches, tape libraries and other equipments. The monitoring activity should not impact the performances of the system. In this paper we present PerfMC, a monitoring system for large clusters. PerfMC is driven by an XML configuration file, and uses the Simple Network Management Protocol (SNMP) for data collection. SNMP is a standard protocol implemented by many networked equipments, so the tool can be used to monitor a wide range of devices. System administrators can display informations on the status of each device by connecting to a WEB server embedded in PerfMC. The WEB server can produce graphs showing the value of different monitored quantities as a function of time; it can also produce arbitrary XML pages by applying XSL Transformations to an internal XML representation of the cluster’s status. XSL Transformations may be used to produce HTML pages which can be displayed by ordinary WEB browsers. PerfMC aims at being relatively easy to configure and operate, and highly efficient. It is currently being used to monitor the Italian Reprocessing farm for the BaBar experiment, which is made of about 200 dual-CPU Linux machines.
I INTRODUCTION
Large clusters with hundreds or thousands of nodes are very difficult to manage due to their size and the complexity of the applications they run. Computing farms are routinely used in the current generation of High Energy Physics experiments, given the huge amount of data to be processed.
An efficient monitoring system can be very helpful for profiling all components of the cluster. A monitoring system is a hardware or software component able to observe the activity of a system (see Jain (1991)). A monitor can observe the performances of a system, record statistics, analyze the data and display the results. Monitors are useful for many reasons, such as analyzing the resource usage of an application or identifying performance bottlenecks or usage patterns suggesting better algorithms. Monitors can be used to characterize the workload of a system, or to find the parameters to be used on a simulation of a real system. Moreover, they can be used to check for, and report hardware problems such as crashed or unresponsive hosts or broken communication links.
Continuous monitoring of computing clusters is a challenging problem for different reasons. The size (number of components) of the system to be monitored is often beyond the scalability limit of many available tools. These tools are usually tailored for a particular application; they are often closed products, so the user can’t adapt them to any variation of the requirements. Moreover, they are usually hard to configure, and provide an inconvenient user interface.
In this paper we present PerfMC (Performance Monitoring for Clusters), a monitoring system for large computing clusters. PerfMC makes heavy use of XML technologies (see W3 Consortium (2000)), and uses the Simple Network Management Protocol (SNMP) (Stallings (1999)) to gather data from any device containing an SNMP agent. Since SNMP is a standard protocol, implemented by many networked equipments, the tool is very general and can be used to monitor a wide range of devices. PerfMC embeds a WEB server which is used to generate time-series graphs from the collected data. Also, the WEB server can produce arbitrary XML pages by applying transformations to an internal XML representation of the cluster’s status. In this way it is possible to produce HTML status pages which can be displayed by ordinary WEB browsers.
The paper is organized as follows. Section II presents some previous works related to the problem of monitoring computing clusters. In Section III the design goals of PerfMC are illustrated and discussed. Section IV describes the architecture and implementation of PerfMC, and a case study is presented in Section V. Finally, Section VI reports the conclusions and future works.
II RELATED WORKS
In recent years considerable attention has been devoted to the problem of monitoring the performances of clusters and distributed systems (see Ganglia Project ; Buyya (2000); Catania et al. (1996); King and Hunt (2000); Mansouri-Samani (1995); Saab et al. (2002); Subramanyan et al. (2000); Tierney et al. (2001); Uthayopas and Phatanapherom (2001); Wismüller et al. (1998)). In Tierney et al. (2001) the authors describe an agent-based monitor targeted primarily to GRID architectures (see Foster and Kesselman (1999)), which are wide area distributed systems where components can be connected to high-latency Wide Area Networks. The monitoring architecture is based on a producer-consumer paradigm, where individual monitors can subscribe for particular kinds of events, and receive notifications only when such events are generated by some producer.
It should be noted that a computational GRID is very different in size and complexity from a computing cluster, so implementing a monitoring system on them is different. A computational GRID is usually made of an heterogeneous collection of computing systems which are geographically distributed and connected through a WAN. A cluster is made of homogeneous machines, usually residing in the same room and connected together with a high speed LAN. These differences play an important role in defining the requirements for a monitoring system. For example, a monitor for a GRID should be built with security features, given that intrinsically insecure WAN links are used for communications. On the other hand, a cluster can be treated as a single, powerful machine. It should be protected with respect to the outside world, but communications among machines in the cluster can be unencrypted. If the monitoring infrastructure is built inside the cluster, there is no need to protect its control messages. Also, LANs are characterized by low latencies, high bandwidths and low packet loss rates. The size of a cluster is usually orders of magnitude smaller than that of a large GRID. For these reasons, monitoring systems developed for computational GRID environments, such as that described in Tierney et al. (2001), have been developed with very different requirements in mind with respect to a cluster monitor.
In Puliafito and Tomarchio (2000) it is proposed a monitoring and management architecture based on the use of mobile agents written in Java. Mobile agents allow management applications to be moved to the network devices, instead of moving the data provided by the network devices to the Management Stations. The approach based on Java mobile agents obviously requires the network devices to be equipped with a Java Virtual Machine, so that they are able to accept and execute code coming from the Management Stations. This is currently only possible when the monitored elements are general-purpose computers, as other devices are generally unable to run Java code (or any other user program).
The Ganglia monitoring system described in Ganglia Project is a distributed monitoring system for clusters. It requires each node on the cluster to run a dæmon called gmond. It collects values from the local machine and broadcasts these values to all the other gmond processes running on the cluster. To limit the network utilization, broadcasts happen only when the changes in the observed values exceed a given threshold. gmond processes can also communicate with generic Ganglia clients by sending an XML status file over a TCP connection. Ganglia dæmons do not provide any facility to log the recorded data themselves, but rely on external programs to collect statistics, perform management actions when particular events occur, and display the status of the system.
Most monitoring tools use their own data collection protocol over TCP/IP links. One exception is SIMONE Subramanyan et al. (2000), which uses the standard SNMP protocol to build a large-scale, distributed monitoring system. Hierarchical monitoring has been employed in other systems as well, such as the one described in Uthayopas and Phatanapherom (2001). Such hierarchical, tree-based monitoring systems are particularly effective when the user is mainly interested in getting aggregate informations on the cluster’s status, such as the average load of all the machines, or the least utilized node of the cluster. This is because the information can be aggregated at each intermediate node of the hierarchy, thus avoiding the possible bottleneck of a single node getting all the data from all hosts. Unfortunately, this strategy does not help when it is necessary to continuously record the values of some parameters for every single machine, for example for producing graphs showing the variation of interesting quantities over the time.
Supermon, described in Minnich and Reid (2001), is a centralized monitoring system, yet it allows efficient and frequent data collection from the nodes of a Linux cluster. The Linux kernel has to be patched for the addition of a new system call which provides status informations. A server program running on each machine collects these informations and can pass them to requesting applications using a telnet-based network protocol. A possible drawback of this approach is the necessity to use a modified kernel on the monitored machines, and the fact that it is necessary to modify the implementation of the system call if additional parameters need to be monitored.
III PerfMC DESIGN GOALS
The BaBar Italian reprocessing farm is in production since summer 2002. The farm, hosted at INFN Padova, is made of about 200 dual CPU Linux/Intel machines, and includes a tape library with a capacity of 70TB, and 24 TB of disk space. The farm is used to process data collected at SLAC by the BaBar detector.
We identified a number of requirements for the monitoring system of the cluster, which are now briefly discussed.
Intrusion-free. The monitor must be guaranteed not to have negative impact on the correctness of the monitored system’s results. It should be noted that this cannot be achieved if the monitored system strongly depends on hard real-time constraints to operate correctly. For such systems, even a small overhead induced by the monitoring activity could affect its results. The BaBar reprocessing farm does not have such constraints.
Low overhead. A desirable property of any monitor is that of imposing a minimal overhead on the observed system. PerfMC is a purely software monitor written in C. It uses a clean design in order to be as efficient as possible. The overhead on the network and on the monitored devices is extremely low; more details are given in Section V.
Batch operation. The monitoring system should be able to operate in batch mode, without any user interaction. At the same time, a suitable user interface should be provided. PerfMC uses a standard WEB interface to communicate with the user. This allows the user to inspect the monitor from remote locations using any WEB browser.
Generality. The monitor should be able to deal with a wide range of different networked devices, including network switches, tape libraries, uninterruptible power supplies and so on. The status of those devices needs to be monitored as well. We identified the Simple Network Management Protocol (SNMP) as a suitable candidate for the remote monitoring of a wide range of devices. More details on SNMP will be given in Section IV.1.
Easy Configuration. It was very important that the monitoring system could be configured easily using a standard, structured notation. We decided to use XML as the language in which the configuration file is written. There exist many tools able to generate, verify and transform XML documents. XML parsing can be done efficiently, as XML documents must obey strict syntactical rules (see W3 Consortium (2000) for details on XML). In Section IV.3 we will give more informations about the structure of the XML-based configuration file.
Reasonable scalability. The BaBar INFN reprocessing farm is expected to grow as the BaBar detector’s luminosity increases; this means that new machines will be added in the future to cope with the increased volume of data to be processed. The monitoring tool should be able to scale at least up to moderate cluster sizes (some hundred nodes).
IV PerfMC ARCHITECTURE AND IMPLEMENTATION
PerfMC is a tool for medium-grained, continuous monitoring of computing clusters. It is written using the C language and currently operates under the Linux Operating System, but should be easily portable on any Unix flavor. PerfMC can monitor any networked equipment implementing an SNMP agent.
PerfMC is made of two threads: a SNMP collector and a WEB server, as depicted in Figure 1.
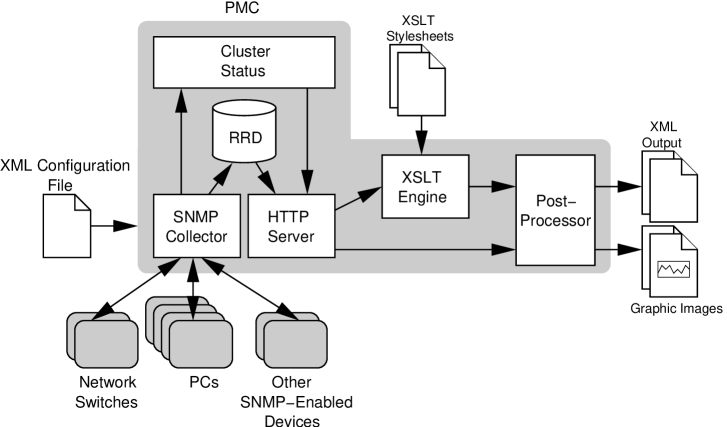
The SNMP collector thread periodically polls the monitored hosts using SNMP requests. The list of devices to monitor, and the list of SNMP variables to request for each one is contained in the XML configuration file. The collected data are stored on Round Robin Databases (see Oetiker (2003)) on the local disk; at the same time, an up-to-date “view” of the cluster is kept in memory. This view includes the status of each device (i.e., whether it is responding to SNMP queries), and the last value for each monitored variable. These informations are used by the web server thread to produce graphs and WEB pages. WEB pages are generated by applying user defined XSL Transformations to an internal XML representation of the cluster status. It is also possible to define an external postprocessor through which the generated pages (or graphs) are piped. The SNMP collector thread and the WEB server thread will be described in more detail in Sections IV.2 and IV.4 respectively. The format of the configuration file is described in Section IV.3.
IV.1 The Simple Network Management Protocol
The SNMP architecture has three components:
-
•
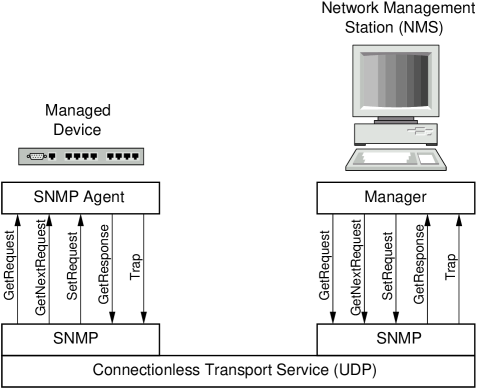
One or more Network Management Stations (NMS), which are responsible for monitoring and managing other devices;
-
•
Network Nodes, which may be computing nodes or other equipments; each node hosts a software component called SNMP-agent which collects local data and answers requests coming from the NMS;
-
•
A connectionless communication service; SNMP is usually implemented on top of UDP.
The SNMP agent running on each node manages a set of local variables; the management informations pertaining to a particular class of resources is defined in a Management Information Base (MIB). The NMS access the MIB by contacting the agent using SNMP primitives such as get or getnext to read values, and set to update values. Figure 2 illustrates the SNMP architecture.
The use of SNMP as a data collection protocol has some drawbacks. The protocol itself is very simple, and requires each NMS to periodically poll the other nodes. Polling introduces additional load on the network, due to the potentially large number of request/response packets. Also, SNMP agents have a simple structure and usually communicate only in response to get/getnext requests. They don’t perform management actions on their own, but require a NMS to take the decisions about what should be done.
However, SNMP has the advantage of being implemented in virtually every equipment having a network interface. This includes workstations, network switches/routers, tape libraries, printers and Uninterruptible Power Supplies. Many vendors only include SNMP agents on their devices, and no possibility is offered to use any custom code; SNMP is thus the only way to interact with these devices.
Recent versions of the SNMP protocol have additional features which solve some of the problems above. In particular, SNMPv2 implements bulk requests, which can significantly reduce the load on the network by packing several requests into a single datagram. In this way, the NMS access different MIB variables on the same host by using a single get request. The responses will be contained in a single packet as well. Our experience shows that the overhead put on the network by the SNMP request/response packets is very low. More details will be given in Section V.
PerfMC is being tested on a cluster composed of about 200 dual-processor Linux/Intel-based computing nodes, running the SNMP agent developed by the Net-SNMP (see Net-SNMP Project ).
IV.2 The Collector
The SNMP collector thread is responsible for periodically polling the various monitored devices. For each device, the user can specify the list of MIB variables to observe and the frequency of the observations.
In order to improve the efficiency of the collector, multiple hosts are polled in parallel using non-blocking SNMP requests. The maximum number of hosts polled in parallel can be defined by the user, the only limitation being the number of simultaneous opened file descriptors supported by the underlying Operating System.
The SNMP collector stores the observations into a set of Round Robin Databases (RRD). A RRD can store time-series data (such as CPU utilization, network load, machine room temperature) in a compact way. Data must be entered into a RRD with a certain frequency. Old data are compacted by means of a consolidation function (any of Average, Minimum, Maximum and Last), or discarded. For example, the user may decide to store the average network utilization for the last week with one observation every 10 seconds, and for the last month with one observation every minute. The RRDTool package takes care of compacting observations older than a week by storing the average of six observations. Data older than one month are discarded. Round Robin Databases have constant size, which is determined when they are created. The RRD library provides the capability to plot the collected data in various ways. See Oetiker (2003) for a complete description of the RRD package.
The SNMP collector records the status of each machine in the cluster while receiving the observations. Such informations are kept in memory. Status informations include, for each host:
-
•
the last observed value for every SNMP variable;
-
•
whether the machine is responding to SNMP requests;
-
•
the list of SNMP error messages generated by the machine.
In this way, the collector knows the operational status of each node in the cluster with a maximum delay equal to the time between consecutive polls. and can notify the system managers as soon as a problem arises.
IV.3 Configuration File Format
The configuration file for PerfMC is written in XML. XML documents can be created by hand using a generic text editor, or using a specialized XML editor, or automatically generated by an application. The Gnome XML Library described in libxml is used by PerfMC to parse, create and transform XML documents. The configuration file conforms to the structure declared in the monitor Document Type Declaration (DTD), reported in Figure 3. XML and DTD are described in detail in W3 Consortium (2000).
<!ELEMENT monitor ( host )+         >
<!ATTLIST monitor
    pmc-num-connections    CDATA #IMPLIED
    pmc-logfile            CDATA #IMPLIED
    pmc-verbosity          CDATA #IMPLIED
    pmc-rrd-dir            CDATA #IMPLIED
    pmc-xslt-dir           CDATA #IMPLIED
    http-html-dir          CDATA #IMPLIED
    http-port              CDATA #IMPLIED
    http-logfile           CDATA #IMPLIED
    http-filter            CDATA #IMPLIED
    http-filter-extensions CDATA #IMPLIED >

<!ELEMENT host (description?, mailto?, miblist, archives, graphs) >
<!ATTLIST host
    name                ID              #REQUIRED
    ip                  CDATA           #IMPLIED
    polldelay           CDATA           #REQUIRED
    tag                 NMTOKENS        #IMPLIED
    snmpversion         ( 1 | 2c )      "2c"     >

<!ELEMENT description  (#PCDATA)*   >
<!ELEMENT mailto       (#PCDATA)*   >
<!ELEMENT miblist      ( mib )*     >
<!ELEMENT mib          EMPTY        >
<!ATTLIST mib
    id        NMTOKEN                      #REQUIRED
    name      CDATA                        #REQUIRED
    type      ( GAUGE | DERIVE | COUNTER ) "GAUGE"
    community NMTOKEN                      #IMPLIED
    min       CDATA                        #IMPLIED
    max       CDATA                        #IMPLIED >

<!ELEMENT archives     ( rra )*   >
<!ELEMENT rra          EMPTY      >
<!ATTLIST rra
    cf          ( AVERAGE | MIN | MAX | LAST )  "AVERAGE"
    xff         CDATA                           #IMPLIED
    granularity CDATA                           #REQUIRED
    expire      CDATA                           #REQUIRED  >

<!ELEMENT graphs ( rrdgraph )* >

<!ELEMENT rrdgraph     ( line )+  >
<!ATTLIST rrdgraph
    id          ID     #REQUIRED
    width       CDATA  #IMPLIED
    height      CDATA  #IMPLIED
    seconds     CDATA  #IMPLIED
    title       CDATA  #REQUIRED  >

<!ELEMENT line         (#PCDATA)* >
The <monitor> tag is the root element of the XML configuration
file. The following optional attributes can be specified:
- pmc-num-connections
-
The maximum number of concurrent SNMP connections to use. If this value is set to , then hosts are polled in parallel. Default: 50.
- pmc-logfile
-
The log file containing messages generated by PerfMC. Default: do not write any log file.
- pmc-verbosity
-
The level of verbosity of PerfMC. Values range from 0 (high verbosity) to 3 (no verbosity). Default: 3 (no verbosity).
- pmc-rrd-dir
-
The directory containing the Round Robin Databases used to store the observations. Default: current directory.
- pmc-xslt-dir
-
The directory containing the XSL Transformation files. Default: current directory.
- http-html-dir
-
The directory containing the static HTML files served by the WEB server. Default: current directory.
- http-port
-
The port on which the WEB server listens to requests. Default: 8001.
- http-logfile
-
The file containing messages generated by the WEB server. Default: no log file.
- http-filter
-
The filter (postprocessor) applied to the pages generated by the WEB server. Default: no filter.
- http-filter-extensions
-
A space-separated list of file extensions; the filter defined by the http-filter attribute is applied to every file with a matching extension. Default: empty extensions list.
The configuration file consists of a sequence of
<host>...</host> blocks, each one containing informations
regarding a specific host to be monitored. The <host>
tag has the following attributes:
- name
-
The name of the device. Can be the host name, or any string used to uniquely identify it.
- ip
-
The IP address of the monitored device. If not given, the value of the name attribute is used as the host name of the device. Default: the value of the name attribute.
- polldelay
-
The delay in seconds between two consecutive observations of this device.
- tag
-
This attribute may contain any sequence of strings used to characterize this device. XSL transformations can perform selections based on the value of this attribute. Default: none.
- snmpversion
-
The version of the SNMP protocol supported by the device. Recognized values are “1” for SNMPv1, and “2c” for SNMPv2. Default: “2c”.
For each device, the user must provide the list of SNMP variables to
poll and the list of graphs which can be generated for that device,
along with the RRD library commands used to produce the graphs. SNMP
variables are described by <mib>...</mib> tags. The following
attributes can be specified:
- id
-
An identifier for the monitored quantity. The SNMP variables of a device needs to be uniquely identified by the value of this attribute. Variables belonging to different devices may have the same id.
- name
-
The name of the variable in dotted-decimal (e.g. “.1.3.2.4.3.5.4”) or dotted-string (e.g. “system.sysUpTime”) notation.
- type
-
Three different kind of SNMP variables are supported. “GAUGE” denotes a variable holding the absolute value of a quantity (e.g., a temperature). “DERIVE” denotes a variable holding a value over time (e.g., the number of bytes per second transmitted over a network interface). “COUNTER” denotes a variable having a value which never decreases (e.g., the total number of bytes send by a network interface). Default: “GAUGE”.
- community
-
The name of the SNMP community to which the variable belongs. Default: “public”.
- min
-
The minimum value the variable can assume. Default: none.
- max
-
The maximum value the variable can assume. Default: none.
PerfMC creates a RRD for each monitored device. The layout of the RRD
can be specified inside the <archives>...</archives>
block. Each RRD is made of a number of Round Robin Archives (RRA),
each described by a <rra>...</rra> tag. Details about the
various options can be found in Oetiker (2003). The attributes are:
- cf
-
The consolidation function to use. Default: “AVERAGE”.
- xff
-
The XForm factor, i.e., the fraction of values which must be inserted into an interval. Default: 0.8;
- granularity
-
The width in seconds of each interval.
- expire
-
The total length in seconds of the RRA. Data older than this value are discarded.
Finally, PerfMC is able to create graphs from the recorded data using
the functions provided by the RRDTool package. Each graph is defined
in a <rrdgraph>...</rrdgraph> block, and is characterized by
the following attributes:
- id
-
The unique identifier of the graph. Graphs from different devices can have the same id.
- width
-
The width in pixels of the graph. Default: 400.
- height
-
The height in pixels of the graph. Default: 180
- seconds
-
The starting point of the graph expressed in seconds from the current time, or using the more readable notation supported by the RRDTool package. Default: “-3h” (three hours ago).
- title
-
(none) The title of the graph.
The body of the graphs contain the list of instructions passed directly to the RRDTool library to produce the graph.
IV.4 The WEB Server
PerfMC provides a WEB interface through an embedded HTTP server, implemented using the SWILL library Lampoudi and Beazley (2002). The WEB server has access to the in-core status informations about the cluster, which is kept up to date by the SNMP collector thread. Also, the WEB server has read-only access to the Round Robin Databases containing the historical data collected from the cluster. Using the graphing capabilities provided by the RRD library, the WEB server is able to dynamically generate plots from the data.
The WEB server can also produce an XML page containing the status of the whole cluster. As described in Section IV.2, the status informations include whether each host is responding to SNMP polls, the last received values of every polled MIB variable and a list of error messages reported by the host. The status document includes also the names of graphs which can be generated for each host in the cluster. An example of XML status document is reported in Figure 4.
<?xml version="1.0"?>
<hosts>
  <host name="bbr-farm002" tag="farm1,client" status="OK">
    <mibs>
      <mib id="net2Out" lastUpdated="1018016032">534717280.000000</mib>
      <mib id="net1Out" lastUpdated="1018016032">13811037.000000</mib>
      <mib id="net2In" lastUpdated="1018016032">1741169408.000000</mib>
      <mib id="net1In" lastUpdated="1018016032">13811037.000000</mib>
      <mib id="availSwap" lastUpdated="1018016032">530104.000000</mib>
      <mib id="totalSwap" lastUpdated="1018016032">530104.000000</mib>
      <mib id="totalMem" lastUpdated="1018016032">261724.000000</mib>
      <mib id="cachedMem" lastUpdated="1018016032">35376.000000</mib>
      <mib id="bufferMem" lastUpdated="1018016032">14600.000000</mib>
      <mib id="sharedMem" lastUpdated="1018016032">0.000000</mib>
      <mib id="freeMem" lastUpdated="1018016032">97824.000000</mib>
    </mibs>
    <graphs>
      <graph id="hourly.png" title="Hourly data"/>
    </graphs>
    <notifications>
      <msg ts="1017937775.90771 18:29:35.090771" severity="CRITICAL">Timeout</msg>
    </notifications>
  </host>
<hosts>
The WEB server can apply to the XML status document XSL Transformations (XSLT) defined by the user. The resulting document is sent to the user. An XSL Transformation could produce, for example, an HTML page from the XML status file, so that WEB browsers can display it. The reader is referred to W3 Consortium (1999) for details about the XSLT language.
The user can define in the configuration file an optional postprocessor, through which every page generated by the WEB server will be filtered. The command to execute is specified with the http-filter attribute of the monitor element. The postprocessor can be any program which accepts input through its standard input and sends the result to standard output. The user can restrict the application of the postprocessor to pages with a certain extension (e.g., only pages with .html or .php extension). The list of file extensions can be specified with the http-filter-extensions attribute of the monitor element.
The WEB server recognizes the following types of Uniform Resource Identifiers (URI) specified in a HTTP GET request:
/hostname/graphname[?querystring] Returns the graph graphname for the machine whose identifier is hostname. It is possible to specify a query string for specifying some parameters of the generated graphs. Recognized query variables are: width, for the image width in pixels; height, for the image height in pixels; start, for the starting time of the data plotted on the graph, expressed in any notation recognized by the RRDTool. For those query variables which are not specified, the default value specified in the configuration file for that graph is assumed.
For example, the graph whose id is “cpu.png” for machine “localhost”, having width of 320 pixels, height of 200 pixels and showing data starting from 3 hours ago, can be requested with an URI like this: /localhost/cpu.png?width=320&height=200&start=-3h
/status.html?applyTransform=XSLT-file Applies the XSL Transformation specified in XSLT-file to the XML document describing the whole cluster status. The result is returned to the user;
/hostname/status.html? applyTransform = XSLTfile Applies the XSL Transformation specified in XSLT-file to the XML document describing the status of the single host hostname. Returns the result to the user.
Generating XML files by applying user-defined transformations to the status document is particularly useful. The user can customize the appearance of the generated HTML pages by writing a set of XSL Transformations. XSLT is a very powerful language and can be used to perform any transformations on the XML status document. Examples of HTML pages which can be produced are shown in the next section.
XML is a widely accepted standard, so it qualifies as a suitable mean for interchanging informations between PerfMC and other programs. XSL Transformations can be used to restructure and filter the data returned by PerfMC before passing them to an application.
V A CASE STUDY
PerfMC is currently being used to monitor a Linux cluster used for High Energy Physics applications. The cluster is hosted at INFN Padova, Italy and is used to process very high volumes of data using CPU-intensive batch applications. It is made of about 200 dual processor, Linux/Intel machines, partitioned in about 150 clients and 50 servers. Both classes of machines use 1.26 GHz Pentium III processors and have 1GB of RAM. Client machines have two fast Ethernet controllers (at the moment just one Ethernet board is used). Server machines have gigabit Ethernet controllers and 1TB of local disk space as EIDE Raid arrays. The cluster is interconnected using a high-performance network switch, and is attached to a tape library.
For each machine in the cluster, the value of the quantities listed in Table 1 are monitored every 30 seconds. Note that the stock Net-SNMP agent under Linux does not provide informations on disk I/O activity. We extended the agent to report these informations by accessing the /proc/stat file.
| Temp. of the MBoard | Temp. of the 1st CPU |
| Temp. of the 2nd CPU | Free Memory |
| Shared Memory | Buffered Memory |
| Cached Memory | Total Memory |
| Total Swap | Available Swap |
| Tot. Disk Blocks read | Tot. Disk Blocks written |
| Disk 1–5 Blocks read | Disk 1–6 Blocks written |
| Net 1–4 Bytes in | Net 1–4 Bytes out |
| /tmp space used | /tmp space avail |
| /var space used | /var space avail |
| /usr space used | /usr space avail |
| Load Average last minute | Load Average last 5 mins |
| Load Average last 10 mins | Host ID |
| Host Name | Host Location |
| Host Uptime |
Every quantity, with the exception of host ID, Name, Location and Uptime, is stored in a Round Robin Database. For each quantity, the average and maximum values are recorded in the RRD. Data for the previous week are kept with the granularity of one observation (average and maximum) every minute. Data for the previous month are kept with the granularity of one observation every hour. Data for the previous year are kept with the granularity of one observation every day. Finally, data more than one year old are discarded. The total size of each RRD is about 8 MB, and there is one RRD for each monitored host.
SNMP bulk get requests are used to get All the monitored variables for each machine. Network statistics collected with the tcpdump(8) utility show that the average size of an SNMP request is, in our case, about bytes, while the average size of an SNMP response is about bytes. This gives an average network utilization of approximately 11KB/s due to the monitoring activity. The CPU overhead on the machines caused by the monitoring is negligible. The machine on which PerfMC runs is a dual Pentium III running at 1.26 GHz with 1GB or RAM. PerfMC has a very low (less than 5%) CPU utilization.
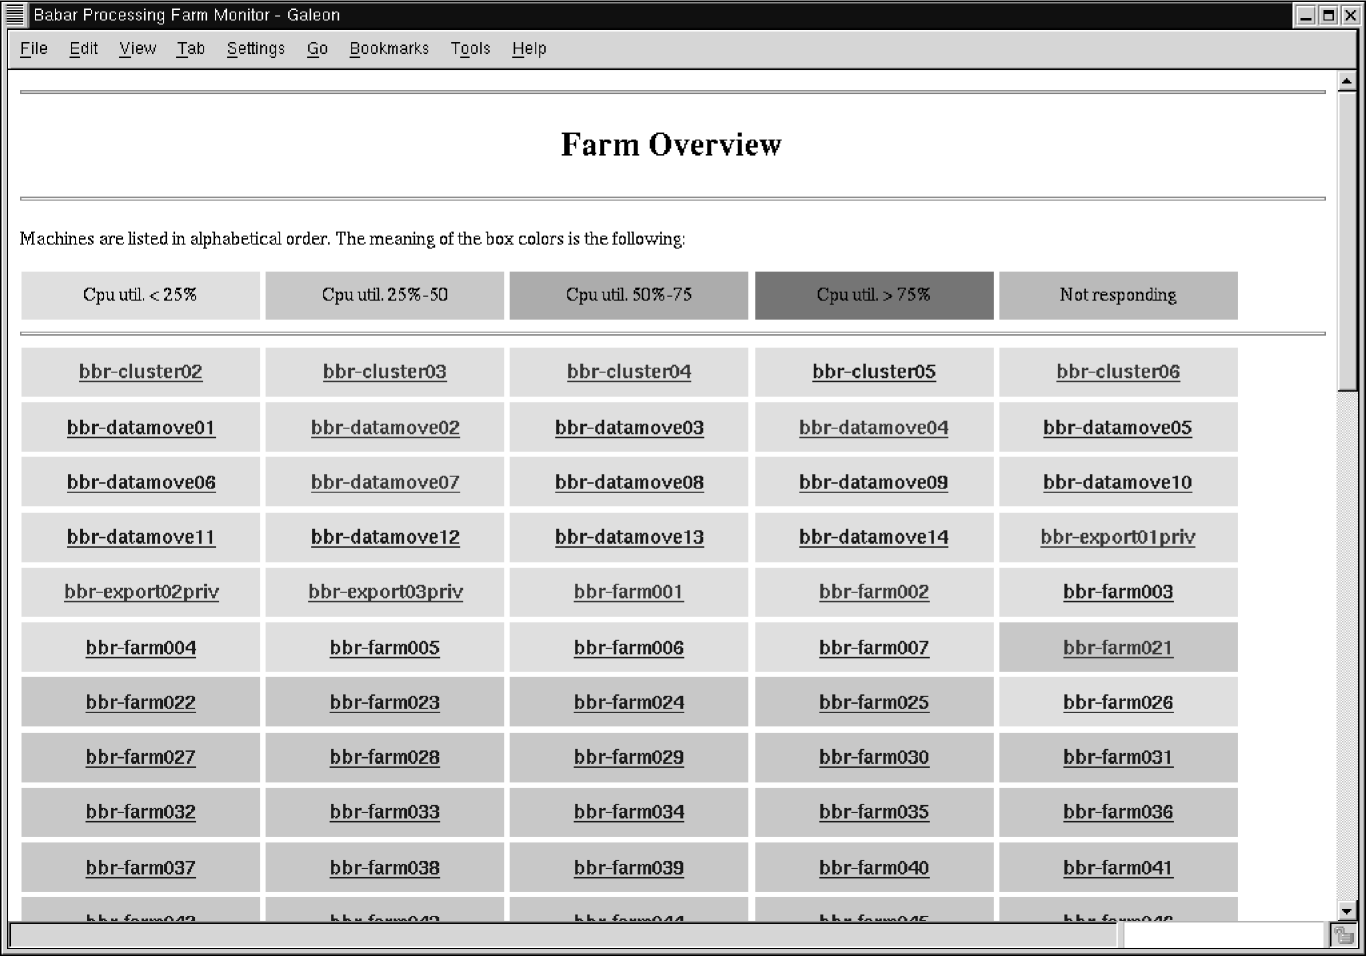
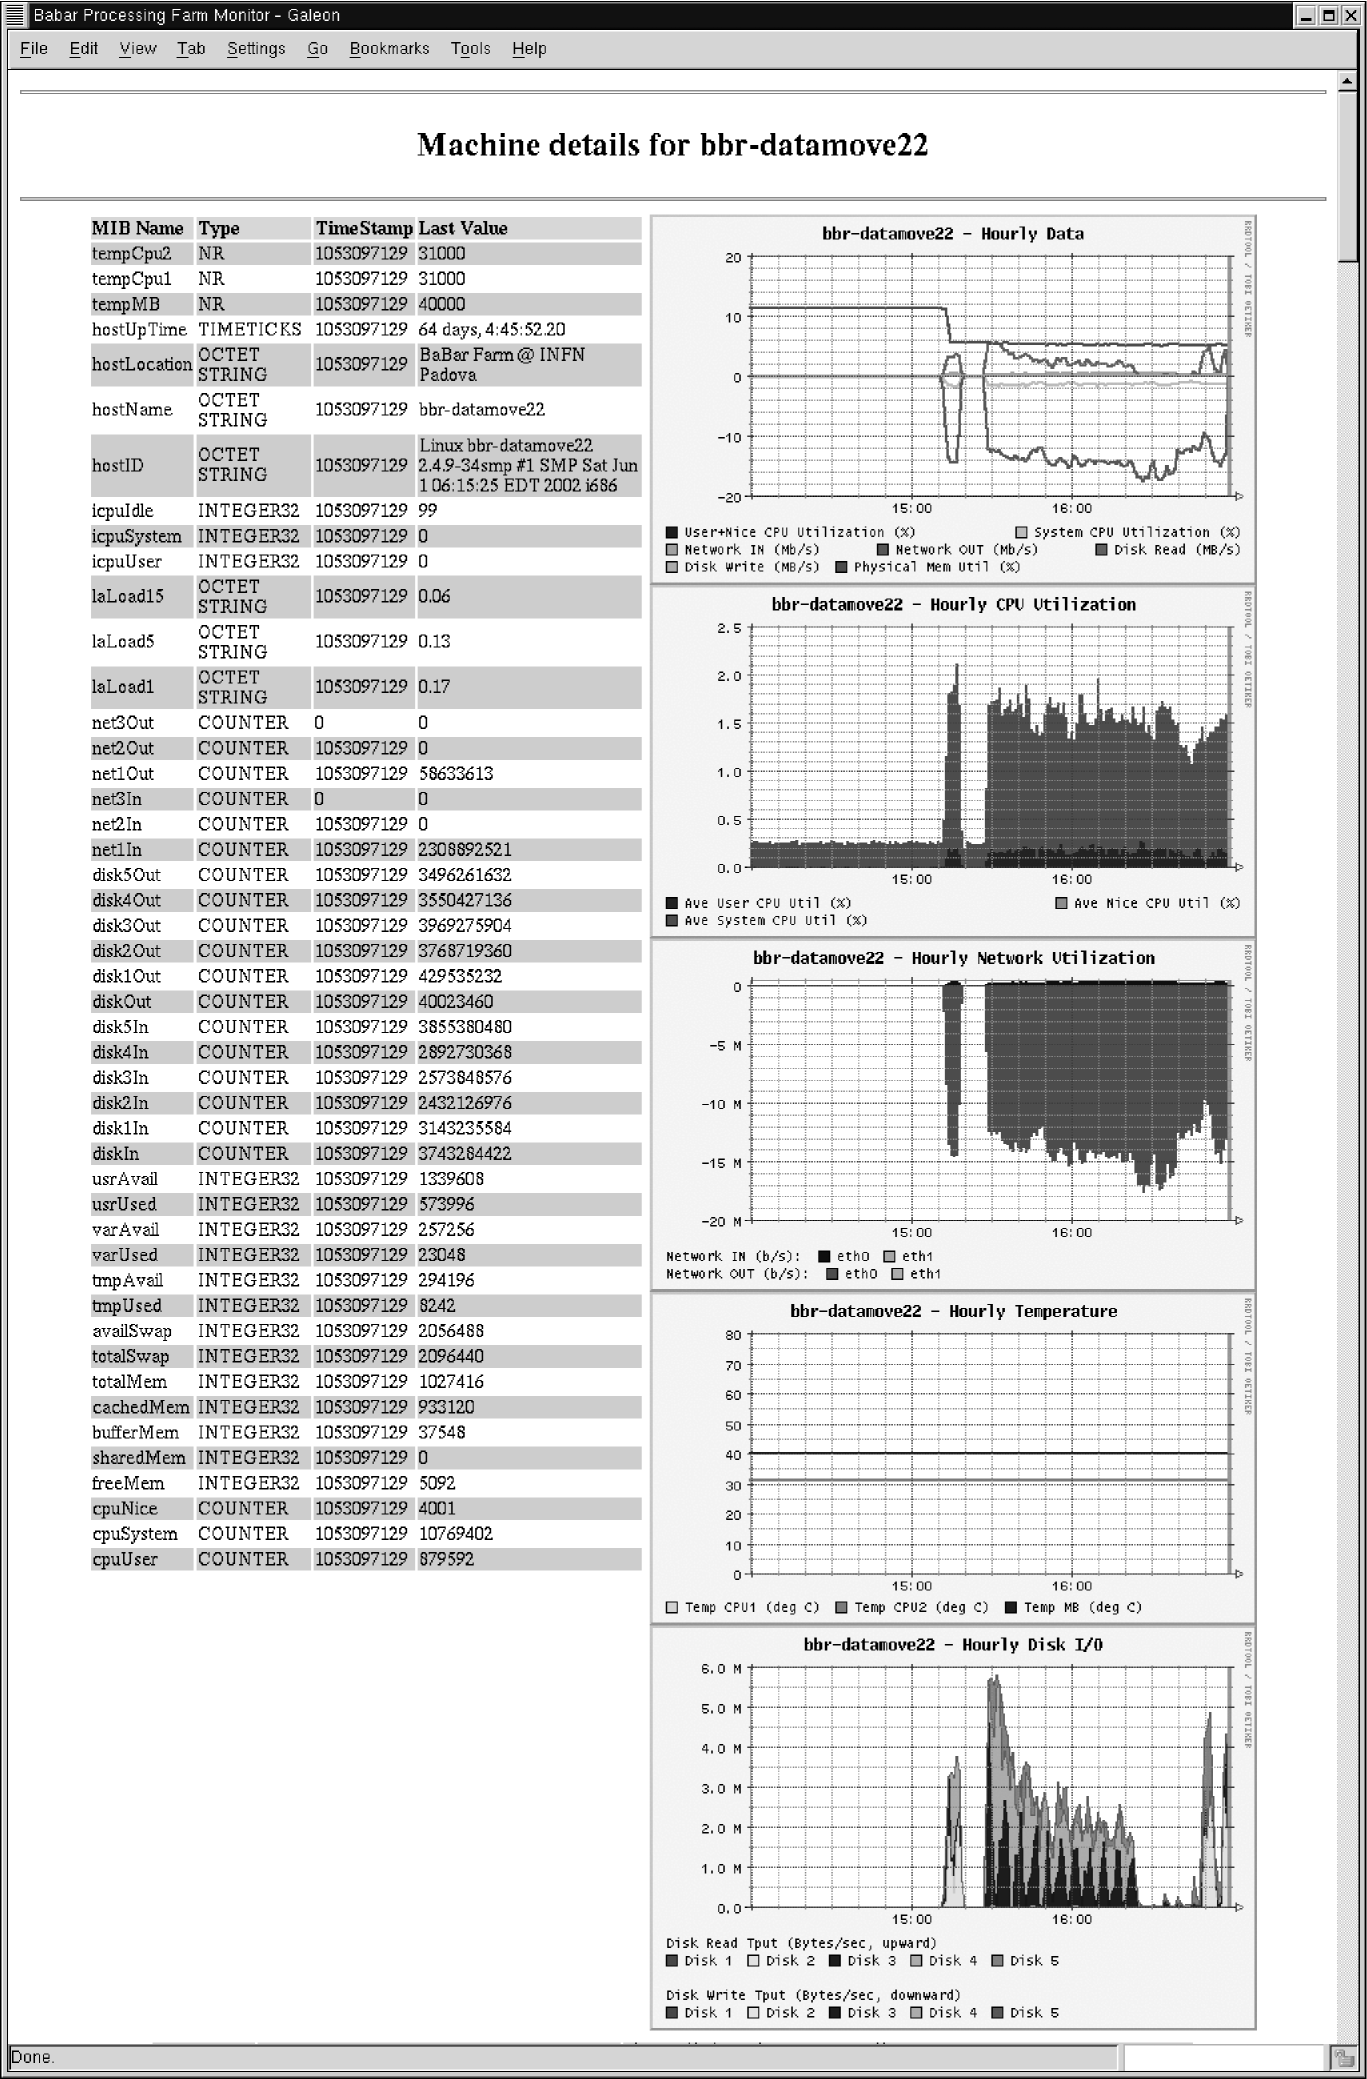
Figures 5 and 6 show two HTML pages generated by applying two different transformations to the same XML status document. Figure 5 shows a page containing part of the list of all machines in the BaBar INFN farm, with different colors indicating the CPU load of each machine. Figure 6 shows a more detailed view of a single machine, with the latest collected values of all the SNMP variables and some graphs.
VI CONCLUSIONS AND FUTURE WORK
In this paper we have illustrated the architecture of a monitoring system for large computing clusters. A prototype written using the C language, has been implemented and is being used to monitor a cluster with 200 dual-processor Linux/Intel machines. The monitoring system uses asynchronous (non-blocking) parallel SNMP bulk requests to collect status informations from a wide variety of networked devices, and incorporates a WEB server which can generate graphs from the collected data. The WEB server can also produce an XML encoding of the current cluster status, to which an XSL Transformation can optionally be applied.
We believe that the most essential goals among those stated in Section III have been satisfied. The system is not intrusive in that all it needs is an SNMP agent running on each monitored device. At low polling rates (one observation every seconds) the overhead on the network and on the observed devices is very low. We do not recommend the use of PerfMC if higher, sub-second polling rates are required; in those cases a more specialized profiling system such as Supermon, should be preferable.
The scalability of PerfMC has been obtained by a clean design and an efficient implementation. Polling many hosts in parallel is a very trivial idea which indeed helped very much. The use of SNMPv2 bulk operations allowed to get the values of many variables from a single machine with just a request/response pair of packet, reducing the load on the network. Also, SNMP is a standard protocol and is implemented in virtually every device. The freely available implementation by the Net-SNMP project allows the user to extend the list of standard SNMP MIBs without the need to modify the agent’s code. In this way it is possible to monitor everything one could be interested in. We are currently using this feature to monitor the status and progress informations from the processes running on our cluster.
Finally, the heavy use of XML as the format for the configuration file, and that of XSLT to transform the status informations in arbitrary ways proved to be a good idea. XSLT transformations are used at the moment to produce a set of HTML pages showing in different ways the status of our cluster.
At the moment the prototype does not implement the alarm system. An alarm system is obviously needed to notify the system administrators in case of failures, so we are currently working on it. The alarm system will likely be implemented by listing in the configuration file a set of thresholds for each MIB variable. If a threshold is crossed in the specified direction, an alarm will be triggered. An additional alarm will be associated with each machine, and will be triggered if the machine does not reply to SNMP queries. Such a threshold-based alarm system is exactly the same implemented by the RMON protocol Stallings (1999), so alarms can be triggered directly by SNMP agents implementing RMON specifications.
The prototype implementation is performing well on our cluster, and no scalability limit has been encountered so far. However, it is obvious that a centralized monitoring system, even the most efficient one, cannot scale forever. In particular, we identified the updating of the Round Robin Databases as the most likely candidate bottleneck. As a first solution, we are currently trying to identify possible sources of inefficiencies in the RRDTool package. As a more long-term fix, we are considering the idea of partitioning the whole cluster among different monitors, each one observing a subset of the system. This would alleviate the scalability problem, as arbitrarily large clusters can be monitored by simply adding more monitors running on different machines. On top of these monitors, it is possible to build a hierarchy of monitoring proxies which will be used to fetch and consolidate the informations collected from the nodes behind them. The top (root) node will present a global view of the system to the user, or redirect user’s requests to the monitor responsible for observing the requested resource. Fault-tolerance can be implemented by means of standard techniques, such as electing a substitute when one of the monitors crashes. The user interface based on HTTP and XML was developed because it could also be used to exchange informations among monitors. The current PerfMC implementation can be extended to cope with a hierarchical monitoring infrastructure. What is required is the addition of a suitable client HTTP interface which can be used to contact the WEB server embedded in other monitors. In the same way it is possible to add other kinds of interfaces, such as a Lightweight Directory Access Protocol (LDAP) interface, or a text-only user interface.
Acknowledgements.
This work has been partially supported by the Istituto Nazionale di Fisica Nucleare, Padova. The authors thank Marco Cappellini who contributed many improvements to PerfMC, especially related to the user interface, and Roberto Stroili for providing comments and suggestions.References
- Jain (1991) R. Jain, The Art of Computer Systems Performance Analysis: Techniques for Experimental Design, Measurement, Simulation, and Modeling (John Wiley & Sons, 1991).
- W3 Consortium (2000) W3 Consortium, Extensible markup language (XML) 1.0 (second edition), W3C Recommendation (2000).
- Stallings (1999) W. Stallings, SNMP, SNMPv2, SNMPv3, and RMON 1 and 2 (Addison-Wesley Pub. Co., 1999), 3rd ed.
- (4) Ganglia Project, GANGLIA project page (2003), http://ganglia.sourceforge.net/.
- Buyya (2000) R. Buyya, Software–Practice and Experience 30, 1 (2000).
- Catania et al. (1996) V. Catania, A. Puliafito, S. Riccobene, and L. Vita, Computer Communications 19, 788 (1996).
- King and Hunt (2000) A. King and R. Hunt, Computer Communications 23, 1558 (2000).
- Mansouri-Samani (1995) M. Mansouri-Samani, Phd thesis, Department of Computing, Imperial College, London (1995).
- Saab et al. (2002) C. B. Saab, X. Bonnaire, and B. Folliot, Cluster Computing 5, 75 (2002).
- Subramanyan et al. (2000) R. Subramanyan, J. Miguel-Alonso, and J. A. B. Fortes, in Proceedings Supercomputing 2000 (IEEE Computer Society,, Dallas, Texas, USA, 2000).
- Tierney et al. (2001) B. Tierney, B. Crowley, D. Gunter, J. Lee, and M. Thompson, Cluster Computing 4, 19 (2001).
- Uthayopas and Phatanapherom (2001) P. Uthayopas and S. Phatanapherom (2001), vol. 2131 of Lecture Notes in Computer Science.
- Wismüller et al. (1998) R. Wismüller, J. Trinitis, and T. Ludwig, in Proc. 2nd SIGMETRICS Symposium on Parallel and Distributed Tools SPDT’98 (ACM Press, Welches, OR, USA, 1998), pp. 1–9.
- Foster and Kesselman (1999) I. Foster and C. Kesselman, eds., The Grid: Blueprint for a New Computing Infrastructure (Morgan Kaufmann, 1999).
- Puliafito and Tomarchio (2000) A. Puliafito and O. Tomarchio, Computer Communications 23, 708 (2000).
- Minnich and Reid (2001) R. Minnich and K. Reid, in The Fifth Annual Linux Showcase and Conference (2001).
- Oetiker (2003) T. Oetiker, RRDtool home page (2003), http://people.ee.ethz.ch/ oetiker/webtools/rrdtool/.
- (18) Net-SNMP Project, Net-SNMP project page, http://net-snmp.sourceforge.net/.
- (19) libxml, libxml: The XML library for Gnome (2003), http://xmlsoft.org/.
- Lampoudi and Beazley (2002) S. Lampoudi and D. M. Beazley, in Proceedings of Freenix’02 (2002).
- W3 Consortium (1999) W3 Consortium, XSL transformations (XSLT) version 1.0, W3C Recommendation (1999).