Power Law Distributions in Class Relationships
Abstract
Power law distributions have been found in many natural and social phenomena, and more recently in the source code and run-time characteristics of Object-Oriented (OO) systems. A power law implies that small values are extremely common, whereas large values are extremely rare. In this paper, we identify twelve new power laws relating to the static graph structures of Java programs. The graph structures analyzed represented different forms of OO coupling, namely, inheritance, aggregation, interface, parameter type and return type. Identification of these new laws provide the basis for predicting likely features of classes in future developments. The research in this paper ties together work in object-based coupling and World Wide Web structures.
1 Introduction
Power law distributions have been found in many natural and social phenomena. A power law implies that small values are extremely common, whereas large values are extremely rare. For example, incomes, earthquake strengths, city sizes and word frequency all follow power law distributions - there are many small tremors, but only a few large earthquakes. The power law distribution is strongly connected with Zipfs-law and the Pareto distribution, often known as the 80:20 rule [1].
We would expect a power law to apply to the size of classes in object-oriented systems. Size in this sense is defined in terms of the number of methods, constructors and other class features. This hypothesis is partially supported by previous research into key classes [9].
The existence of a power law distribution in a network implies a scale-free behaviour. This means that the network lacks a “characteristic length scale” so that, like fractals, when suitably magnified, small bits of it resemble the whole. Whichever range of values is examined, the proportion of small to large values remains the same [1].
Recently, there has been a great deal of interest in the power laws visible in the structure of the World Wide Web [2]. These include the number pages on web sites, the number of links to a given website, the PageRank 111 The ranking metric used by Google [16] values of nodes and the frequency with which users visit pages [17, 2].
The indegrees and outdegrees of individual web pages are also subject to power law distibutions [8]. In a Web context, indegree refers to number of pages linking to a given page and outdegree refers to the number of pages referenced from a given page. During the development of our Autodoc system for assisted navigation of program documentation [21], we found that the pages in the Javadocs were subject to the same laws. We thus hypothesized that the relationships were due to power law distributions in the underlying code structure.
Our motivation for the research described in this paper is to discover patterns and relationships which can explain the structure of source code at a low level of abstraction. Identifying such patterns allows us to predict, by extrapolation, the consequences of developing larger and more complex software. For example, we could predict how many classes might contain greater than a hundred methods in a set of classes ten times larger than the Java Developers Kit (JDK). Alternatively, we could predict the maximum number of constructors of any class in that system. This may have implications for software maintenance and comprehensibility in terms of time spent and effort expended [14].
The identification of power law distributions in source code enables us to categorize the coupling graphs as belonging to a class of scale-free topologies. Similar topologies have been found in the Web [8], the Internet [10] and in some food webs [11]. Techniques to store, manipulate and describe such topologies may be re-applied to handle coupling graphs.
A further motivation is to enable models of code development that will allow developers to create synthetic code bases containing large numbers of computer-generated classes. For example, given an appropriate means of generating synthetic data, a developer could generate a data set of a much larger number of classes. This would enable them to test the consequences of developing a large system before development begins.
Finally, our work has implications for the graph traversal algorithms used in reachability analysis and garbage collection. Just as internet networks are robust against random removal of nodes [4], it is likely that random removal of classes will have little effect on the proportion of code which can be reached and thus executed.
The remainder of this paper is organized as follows. Section 2 describes related work in discovering power law distributions and scale-free characteristics of software. In Section 3 we describe our analysis techniques and present the results in Section 4. Section 5 gives our conclusions and ideas for future research.
2 Related Work
There has been substantial work on power law distributions in natural phenomena and over recent years, in the evolution of the web. Only recently has attention turned to the power law distributions found in program code and, in particular, those relating to Java software.
O’Donoghue et al. have performed a run-time analysis of Java bytecode sequences obtained using a customized version of the Kaffe JVM [15]. Their experiments showed that the frequencies with which consecutive pairs of instructions are interpreted by the virtual machine follows a power law.
Potanin et al. have conducted experiments using a query-based analysis tool called Fox, which is an enhanced version of Bill Foote’s Heap Analysis Tool (HAT). Their research has confirmed power laws in the indegree and outdegrees of the run-time object graphs of several programs [18, 19].
Valverde et al. have shown that the indegree and outdegrees of nodes in a network of class diagrams also follow power laws, leading to a scale-free network topology similar to that of the Web [20]. Since these diagrams have a one-to-one mapping with the source code structure, the implication is that these laws are a feature of object-oriented program code.
A major feature of the work in this paper is the analysis of different coupling types. A commonly-held view in software engineering is that there is a link between complexity in software and the understandability of that software. The more coupling in a system, the more complex the system. Too much coupling may be indicative of a poorly thought out design or of inadequate standards of maintenance. There is evidence to suggest that excessive coupling can lead to more fault-prone software [7, 12]. The large number of different ways of writing OO code means that accurately capturing, categorising and analyzing the different forms of coupling is a difficult task to undertake. A comprehensive framework for measuring coupling in OO systems is described by Briand et al [6].
Our research shows that even when the network of classes is decomposed by coupling type, power laws still prevail. This has lead to the identification of twelve distinct power law distributions.
3 Analysis Techniques
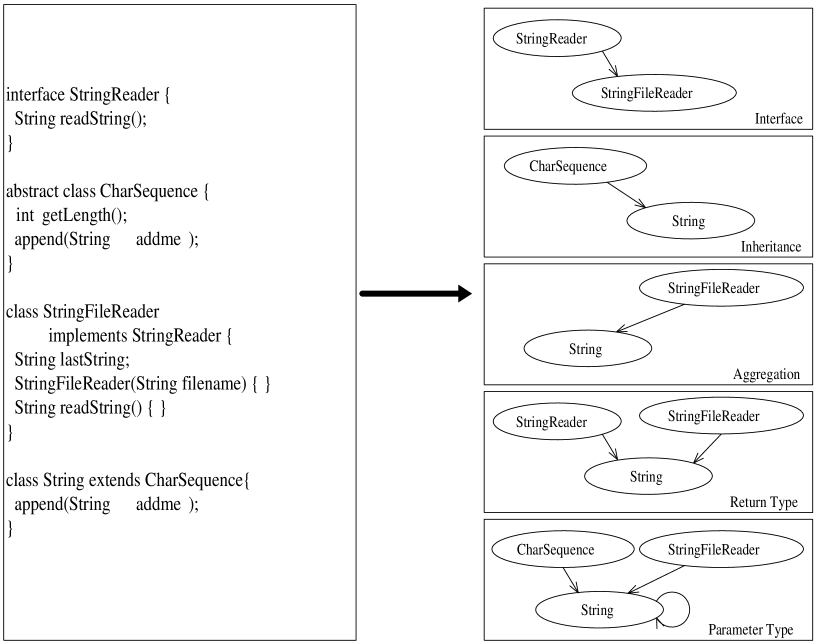
As part of this research, a system called AutoCode has been developed for indexing Java source code. AutoCode works by using a custom doclet which extends the Javadoc program and allows easy access to the code structure. We used the AutoCode system to generate graphs for each of five coupling types - Inheritance, Interface, Aggregation, Parameter Type and Return Type. An illustration of how these graphs can be derived from source code can be seen in Figure 1. To identify the power laws, we then performed statistical operations on these five graphs. With the exception of inheritance, we need to consider the relationships from two perspectives. For example, from the perspective of the interface and of the implementing class. We do not need to consider the number of superclasses because Java classes only ever have one superclass. The number of methods, constructors and fields in each class were also studied.
Data was collected from three large Java systems:
-
1.
The core Java class libraries shipped with the Java Developers Kit (JDK) provide implementations of common functions required for many programs. Version 1.4.1 of the JDK contains 1 400 000 lines of code spread over 6 000 classes.
-
2.
Apache Ant is a Java-based build tool. It behaves in a similar way to make but uses XML-based configuration files, which define various tasks to be executed. The source code for version 1.5.3 of Apache Ant contains 145 000 lines of code spread over 500 classes.
-
3.
Tomcat is the servlet container used in the official reference implementation for Java Servlets and JavaServer Pages. The source code for Jakarta Tomcat version 4.0 contains 150 000 lines spread over 370 classes.
To identify the power laws we perform linear regression on log-log data plots. The number of occurrences, , of a value of magnitude is given by the equation which implies that . Hence, the power law can easily be identified by a straight line with gradient on a log-log plot. Because of significant clustering of data points near the -axis, regression on these plots leads to skewed results. To prevent this, the values must be grouped into buckets of exponentially increasing size [2]. The logarithm of the frequency is plotted against the logarithm of the mid-point of each bucket. From the subsequent regression a more accurate exponent value, , can be obtained than if all the original data points are considered. It is this value which allows us to predict the likely features of future systems. A low value of the exponent signifies a tendency towards a less skewed distribution.
4 Results
4.1 Methods, Fields and Constructors
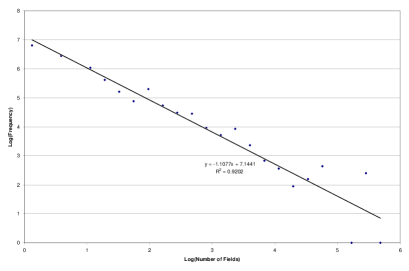
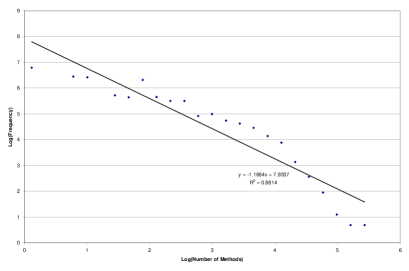
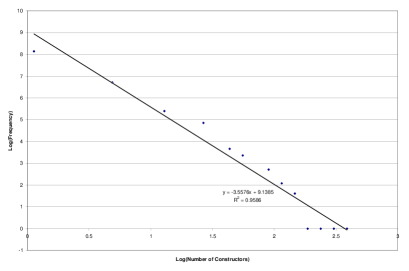
The majority of this study concerns coupling relationships between classes. However, three power laws were identified without type information. These relate to the fundamental building blocks of classes - the number of fields in each class, the number of methods in each class and the number of class constructors. Figure 2 shows log-log plots highlighting each of these relationships.
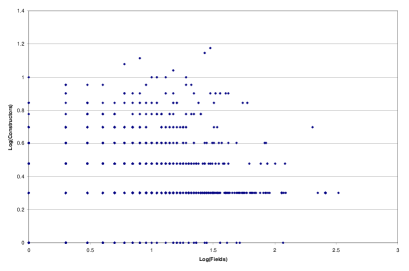
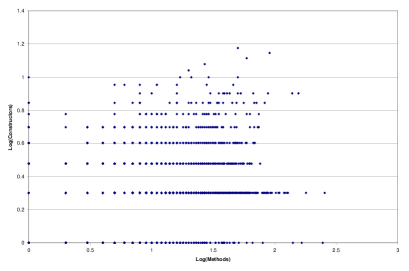
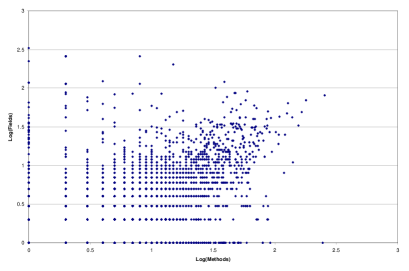
For the distribution of the number of methods, the exponents are 1.168, 1.104 and 0.734 for JDK, Ant and Tomcat, respectively. This implies that in the JDK there is a higher proportion of classes with very few methods when compared with the other two systems. This might imply fewer key classes in this system. For the distribution of the number of fields, the exponents are 1.108, 0.988 and 0.998 for JDK, Ant and Tomcat, respectively. The difference in the magnitude of the exponents would indicate no strong relationship between the number of methods and the number of fields. It could be imagined that a large number of fields implies a larger number of methods to operate on those fields. Based upon our obvservation, we hypothesize that it is infeasible to predict the number of methods from the number of fields and vice-versa. This hypothesis is supported by correlations between the number of methods, fields and constructors (Figure 3). The correlation matrix in Figure 4 shows that no strong correlation exists between any of these measures.
For the distribution of the number of constructors, the exponents are 3.560, 3.589 and 3.112 for JDK, Ant and Tomcat, respectively. This implies that classes with a large number of constructors are rarely found in systems of this scale. For example, the JDK system contains only three classes with more than ten constructors. Previous work into refactoring of constructors found similar evidence for five medium-sized Java systems [14]. Only one class was found to have ten constructors. This class was part of the Swing library.
 |
 |
| (a) Fields | (b) Methods |
 |
| (c) Constructors |
 |
 |
| (a) Fields vs. Constructors | (b) Methods vs. Constructors |
 |
| (c) Methods vs. Fields |
| Methods | Fields | Constructors | |
|---|---|---|---|
| Methods | 1 | ||
| Fields | 0.216 | 1 | |
| Constructors | 0.215 | 0.0827 | 1 |
4.2 Coupling Power-Laws
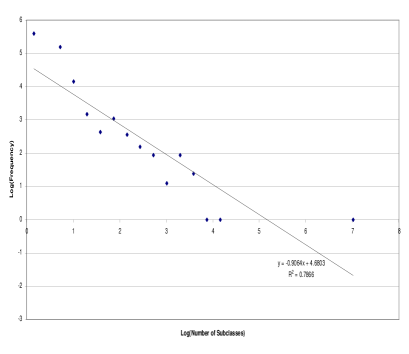
The frequency with which classes are used as superclasses to other classes can be calculated by examining the distribution of outlinks in the superclass-subclass graph. Figure 5 shows a bucketed log-log plot of the number of descendants of the classes in the JDK. The results show that the distribution follows a power law with exponent 0.906. The exponents for Apache Ant and Jakarta Tomcat are 0.810 and 1.310, respectively. The high value for Tomcat implies that more classes in that system have relatively few descendants, whilst a small number of classes are extended by many descendants. In other words, the functionality of the system is distributed more evenly than in the other two systems. In contrast, for the Ant system, much of the functionality is contained in subclasses of key classes such as Task and BaseParamFilterReader. Hence the functionality is more concentrated in fewer classes in this system.
By using the same techniques we can show that the distribution of the number of classes implementing an interface follows a power law, with exponents 1.130, 1.118 and 1.636 for JDK, Ant and Tomcat, respectively. This makes sense if we consider the use of interfaces as a surrogate for multiple inheritance. We would expect a similar distribution for interface implementations as for subclasses.
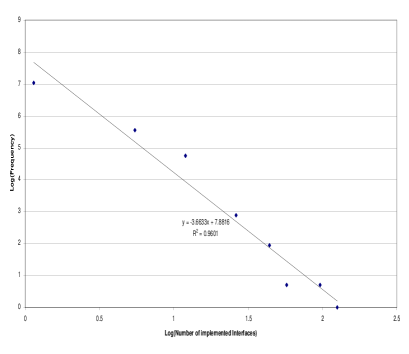
The distribution in the number of interfaces implemented by a class also follows a power law, with a much higher exponent of 3.663, as can be seen from Figure 6. This exponent was calculated for the JDK. Insufficient data was available to calculate the exponents for the other two systems. This result can be explained by virtue of very few classes implementing a large number of interfaces. Those that do implement a large number of interfaces tend to delegate the responsibility for the methods of these interfaces to members of the same interface.
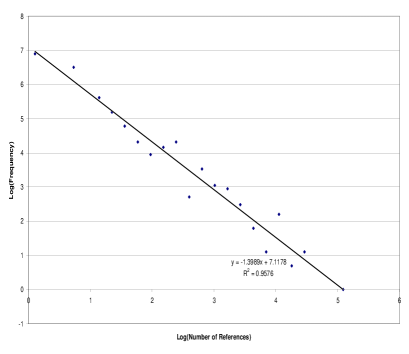
Two further power law distributions can be seen in the relationship between classes as member variables. The first, a power law distribution in the number of other classes referenced as member variables within a given class. For example, in Figure 1, StringFileReader references one class, String, via the field lastString. The exponents of the distributions are 1.051, 1.386 and 1.493 for JDK, Ant and Tomcat, respectively. The low value for JDK reflects a comparatively uniform distribution of coupling via aggregation in this system. One explanation for the low JDK value may be that the roles of various packages in the system do not overlap and hence there are multiple focal points for aggregation, as opposed to a centralized structure.
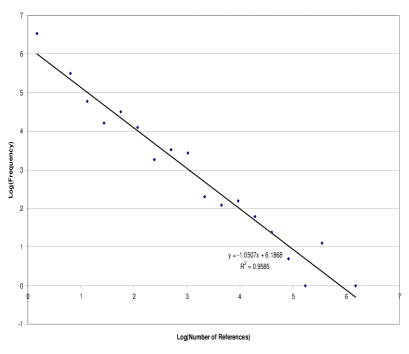
The second distribution is in the number of classes which reference a given class as a member variable. For example, in Figure 1, String is referenced by one class, StringFileReader. The exponents of these distributions are 1.399, 2.295 and 1.991 for JDK, Ant and Tomcat, respectively. Interestingly the JDK again has the lowest exponent value supporting the previous hypothesis about multiple focal points for aggregation.
Both of these power-laws can be seen from the plots in Figure 7. It is noticable that the values for the first distribution are lower than the corresponding values for the second. This can be explained by the tendency in object-oriented code for many classes to be grouped together as members of another class. In contrast, it is comparatively rare for a class to be referenced as a member in many classes.
 |
 |
| (a) Field members | (b) Containing classes |
Four more class features were analyzed for power law distributions, namely the indegrees and outdegrees induced by parameter types and return types for each of the three systems. All showed scale-free topology. The Ant system has comparatively high values for all the exponents in these relationships. Inspection of the classes in this system and subsequent analysis revealed no strong correlation between usage of return types and parameters. This could be considered a suprising result, since we might expect parameters and return types to be linked. No obvious explanation could be found for the differences in exponents between the systems.
The exponent values for all three systems can be found in figures 8, 9 and 10. The values denote Pearson product-moment correlation. The high values for JDK reflect the larger number of classes in this system. As a result, we would expect more consistency in the data. The values are relatively low but still support the theory.
5 Conclusions and Future Work
In this paper we have illustrated that power-law distributions exist in object-oriented class relationships. In particular, those related to coupling. Twelve new power-laws have been identified. The exponents of these power laws are given for the JDK (Figure 8), Tomcat (Figure 9) and Ant (Figure 10). One conclusion from this work is the belief that these regularities are common across all non-trivial object-oriented programs.
Another conclusion is that the different types of coupling examined are independent. This finding contradicts the hypothesis that high usage in one form of coupling can be used to predict high usage in another form.
The implications of these findings are that we can use the data to predict the dimensions of future systems. This will allow us to estimate the complexity of developing and maintaining those systems.
It is interesting to note that the exponents for Ant and Tomcat rarely fall within the 95% confidence intervals of the JDK. We believe that these exponents are due to deeper properties of the collections. The conclusion is that whilst there are common properties between these systems, each individual system has its own unique characteristics.
Bieman and Murdock have already shown that there is a large body of freely accessible source code available on the Web [5]. In terms of future work, it would be interesting to verify these results using a large crawl of such data. Assuming that these results hold, a number of techniques can be brought to bear to explain the phenomena.
In order to explain the power law in World Wide Web graphs, new models for its growth and evolution have emerged. The key to these models is a process known as preferential attachment [3] in which pages which have a high indegree are more likely to be referred to by new links. This can be explained by considering a page with higher indegree as being more popular, more important and better connected. It is thus more likely to be visited by a user who may then also choose to link to that page. Research is ongoing to find methods to improve the model - for example, by combining preferential and non-preferential attachment [13]. Other future work will investigate the accuracy with which these models can predict the structure of program code.
| Relationship | Exponent | Lower 95% | Upper 95% | |
|---|---|---|---|---|
| Number of Methods | 1.168 | 0.968 | 1.369 | 0.881 |
| Number of Fields | 1.108 | 0.956 | 1.260 | 0.920 |
| Number of Constructors | 3.560 | 3.067 | 4.048 | 0.959 |
| Subclasses | 0.906 | 0.623 | 1.189 | 0.787 |
| Implemented Interfaces | 3.663 | 2.918 | 4.409 | 0.960 |
| Interface Implementations | 1.130 | 0.933 | 1.329 | 0.907 |
| References to class as a member | 1.051 | 0.935 | 1.167 | 0.959 |
| Members of class type | 1.399 | 1.253 | 1.455 | 0.958 |
| References to class as a parameter | 0.802 | 0.712 | 0.892 | 0.949 |
| Parameter-type class references | 1.130 | 1.011 | 1.250 | 0.954 |
| References to class as return type | 0.914 | 0.789 | 1.039 | 0.938 |
| Methods returning classes | 1.491 | 1.293 | 1.689 | 0.937 |
| Relationship | Exponent | Lower 95% | Upper 95% | |
|---|---|---|---|---|
| Number of Methods | 0.734 | 0.522 | 0.965 | 0.734 |
| Number of Fields | 0.998 | 0.775 | 1.222 | 0.858 |
| Number of Constructors | 3.112 | 2.654 | 3.570 | 0.994 |
| Subclasses | 1.310 | 0.714 | 1.906 | 0.828 |
| Interface Implementations | 1.636 | 0.865 | 2.407 | 0.856 |
| References to class as a member | 1.493 | 1.049 | 1.937 | 0.849 |
| Members of class type | 1.991 | 1.433 | 2.550 | 0.910 |
| References to class as a parameter | 0.684 | 0.368 | 1.000 | 0.569 |
| Parameter-type class references | 1.126 | 0.788 | 1.464 | 0.771 |
| References to class as return type | 1.119 | 0.879 | 1.358 | 0.896 |
| Methods returning classes | 1.400 | 0.933 | 1.866 | 0.799 |
| Relationship | Exponent | Lower 95% | Upper 95% | |
|---|---|---|---|---|
| Number of Methods | 1.104 | 0.862 | 1.345 | 0.828 |
| Number of Fields | 0.988 | 0.833 | 1.143 | 0.920 |
| Number of Constructors | 3.589 | 2.722 | 4.456 | 0.958 |
| Subclasses | 0.810 | 0.452 | 1.169 | 0.667 |
| Interface Implementations | 1.118 | 0.585 | 1.652 | 0.814 |
| References to class as a member | 1.386 | 0.869 | 1.903 | 0.803 |
| Members of class type | 2.295 | 1.951 | 2.639 | 0.967 |
| References to class as a parameter | 1.034 | 0.678 | 1.389 | 0.752 |
| Parameter-type class references | 1.456 | 1.021 | 1.892 | 0.800 |
| References to class as return type | 1.001 | 0.538 | 1.463 | 0.699 |
| Methods returning classes | 1.850 | 1.360 | 2.340 | 0.919 |
References
- [1] Lada A. Adamic. Zipf, power-laws, and pareto - a ranking tutorial. Technical report, Internet Ecologies Area, Xerox Palo Alto Research Center, 3333 Coyote Hill Rd., Palo Alto, CA 94304, 2000.
- [2] Lada A. Adamic. Network Dynamics: The World Wide Web. PhD thesis, Stanford, 2002.
- [3] Reka Albert, Albert-László Barabási, and Hawoong Jeong. Scale-free characteristics of random networks: the topology of the world-wide web. Physica A, 281:69–77, 2000.
- [4] Reka Albert, Hawoong Jeong, and Albert-László Barabási. Error and attack tolerance of complex networks. Nature, (406), July 2000.
- [5] J. Bieman and V. Murdock. Finding code on the world wide web: a preliminary investigation. In Proceedings of the First International Workshop on Source Code Analysis and Manipulation (SCAM), Florence, Italy, November 2001.
- [6] L Briand, J Daly, and J Wust. A unified framework for coupling measurement in object-oriented systems. IEEE Transactions on Software Engineering, 25(1):91–121, 1999.
- [7] L Briand, P Devanbu, and W Melo. An investigation into coupling measures for C++. In Proceedings of the 19th International Conference on Software Engineering (ICSE’97), pages 412–421, Boston, USA, 1997.
- [8] A. Broder, R. Kumar, F. Maghoul, P. Raghavan, A. Rajagopalan, R. Stata, A. Tomkins, and J. Wiener. Graph structure in the web. In Proceedings of the 9th World Wide Web Conference, pages 309–320, Amsterdam, May 2000.
- [9] S Counsell, P Newson, and E Mendes. Architectural level hypothesis testing through reverse engineering of object-oriented software. In Proceedings of the 8th International Workshop on Program Comprehension (IWPC’2000), Limerick, Ireland, pages 60–66, 2000.
- [10] M. Faloutsos, P. Faloutsos, and C. Faloutsos. On power-law relationships of the internet topology. In Proceedings of SIGCOMM Conference on Applications, Technologies, Architectures, and Protocols for Computer Communication, pages 251–262, Cambridge, Ma., 1999.
- [11] Diego Garlaschelli, Guido Caldarelli, and Luciano Pietronero. Universal scaling relations in food webs. Nature, (423):165–168, May 2003.
- [12] R Harrison, S J Counsell, and R Nithi. Coupling metrics for OO design. In IEEE International Symposium on Software Metrics, pages 150–157, Bethesda, Maryland, US, 1998.
- [13] Mark Levene, Trevor I. Fenner, George Loizou, and Richard Wheeldon. A stochastic model for the evolution of the web. Computer Networks and ISDN Systems, 39:277–287, 2002.
- [14] R Najjar, S Counsell, G Loizou, and K Mannock. The role of constructors in the context of refactoring object-oriented systems. In Proceedings of the 7th European Conference on Software Maintenance and Reengineering, pages 111–120, Benevento, Italy, March 2003.
- [15] Diarmuid O’Donoghue, Aine Leddy, James Power, and John Waldron. Bi-gram analysis of java bytecode sequences. In Principles and Practice of Programming in Java, Trinity College Dublin, June 2002.
- [16] Lawrence Page, Sergey Brin, Rajeev Motwani, and Terry Winograd. The pagerank citation ranking: Bringing order to the web. Working paper, Department of Computer Science, Stanford University, 1998.
- [17] Gopal Pandurangan, Prabhakar Raghavan, and Eli Upfal. Using pagerank to characterize web structure. In Proceedings of the 8th Annual International Computing and Combinatorics Conference (COCOON), 2002.
- [18] Alex Potanin. The fox - a tool for object graph analysis. Technical report, Victoria University of Wellington, 2002. BSc. Honours report.
- [19] Alex Potanin, James Noble, Marcus R. Frean, and Robert Biddle. Scale-free geometry in object-oriented programs. Submitted to CACM, 2003.
- [20] S. Valverde, R. Ferrer-Cancho, and R. V. Sole. Scale-free networks from optimal design. Condensed Matter Archive, cond-mat/0204344, April 2002. Submitted to Europhysics Letters.
- [21] Richard Wheeldon, Mark Levene, and Nadav Zin. Autodoc: A search and navigation tool for web-based program documentation. In Poster Proceedings of International World Wide Web Conference, Honolulu, HI, 2002.