Monitoring and Debugging
Concurrent and Distributed
Object-Oriented Systems
Abstract
A major part of debugging, testing, and analyzing a complex software system is understanding what is happening within the system at run-time. Some developers advocate running within a debugger to better understand the system at this level. Others embed logging statements, even in the form of hard-coded calls to print functions, throughout the code. These techniques are all general, rough forms of what we call system monitoring, and, while they have limited usefulness in simple, sequential systems, they are nearly useless in complex, concurrent ones. We propose a set of new mechanisms, collectively known as a monitoring system, for understanding such complex systems, and we describe an example implementation of such a system, called IDebug, for the Java programming language.
category:
D.2 Software Software Engineeringcategory:
D.2.5 Software Software Engineeringkeywords:
Testing and Debugging1 Introduction
Modern application development is extremely complicated. Today’s developers, as members of large teams, are building desktop applications with millions of lines of code. Large-scale applications must be built by judicious use of existing code and ideas: code and design reuse, compositional architectures, patterns, and other similar models are the modern tools of our trade.
1.1 Modern Methods, Dark Ages
But how do most developers do development and testing? While the majority of developers use advanced integrated modeling and development environments, they also use a smattering of low-tech print statements for system monitoring and debugging.
What is wrong with this scenario?
-
1.
It is an undisciplined development methodology: there is little or no relationship between application requirements and monitoring, debugging, and test code.
-
2.
There is no relationship between a component’s specification and the component test code.
-
3.
Test code is manually embedded in the code that is sometimes shipped, leaving a host of deployment issues to deal with at delivery-time.
-
4.
Output is unstructured and often unparseable. Finally, there is no easy way to redirect or log test output to any destination other than a pipe or a file.
While “archaic” languages like C and Fortran have an assertion mechanism, surprisingly, some modern popular languages are designed without regard for system debugging and some do not support even simplistic debugging constructs like assertions.
1.2 A Specific Example: Debugging in Java
For example, the Java programming language provides very few built-in constructs for debugging classes, components, and systems.
Typically, a Java programmer relies upon language features and development tools for debugging. Java provides array bounds checking, static type checking, variable initialization testing, and exceptions to assist in code debugging. While programming environments provide sophisticated source-code debuggers, most developers seem fixated on using primitive println’s to debug their code.
Java is missing several traditional core debugging constructs as well, the most critical of which is assertions111With the release of JDK 1.4 we now have an assert keyword, nearly seven years after the initial version of Java.. Typically, if an assertion is violated, a program is aborted. In modern object-oriented systems we often need to have options other than halting the program execution (e.g, throwing an exception).
1.3 Filling the Holes
IDebug has been designed to “fill the holes in Java”. It is a monitoring framework composed of a set of components that provide fundamental monitoring and debugging constructs like assertions, error messages, logging, and more. Applications and/or components using IDebug have a unified, manageable, flexible and extensible interface for monitoring and debugging.
The point of this paper is not to describe IDebug in full detail. Instead, our primary focus is to discuss what we believe are the fundamental aspects of such a monitoring and debugging subsystem, particular for concurrent or distributed systems. We hope to convince the reader that the complex applications and components being developed today necessitate a new view on monitoring, debugging, and testing frameworks. In particular, with the range of application domains assaulting the average developer (everything from embedded to distributed systems), a comprehensive and flexible monitoring, debugging, and testing subsystem is essential.
2 Background
Programming technologies have evolved rapidly over the years. New programming models have emerged, new languages have gained popularity, new tools have been adopted, and yet, several core monitoring and debugging constructs have changed very little.
The primary constructs for monitoring and debugging are the call stack, the logging message, and the assertion. A call stack is the sequence of nested function or method calls of a specific execution context. The logging message is a structured message that logs special events (errors, warnings, etc.). They are usually time-stamped, have priority levels, and are organized according to some taxonomy. Finally, an assertion is a boolean predicate that, if false, indicates an error in program code.
Since IDebug is an object-oriented monitoring and debugging framework, a review of object-oriented debugging and frameworks is in order.
2.1 Object-Oriented Debugging
Debugging object-oriented programs is not the same as debugging procedural or functional programs. Because most object models enforce modularity and encapsulation, one must test the implementation and the interface of a class or module.
A specification of an interface is called a contract [1, 2, 3, 10]. A class’s contract specifies the externally visible behavior that a class guarantees. Contracts are typically specified via three constructs: pre-conditions, post-conditions, and invariants. Using these three constructs, many of the safety properties of a class can be specified222Progress conditions can also be specified in contracts but we only focus on safety conditions here..
2.2 Frameworks
A framework is a collection of programming constructs (e.g., classes, components, interfaces, etc.) that provides a unified model and interface to a specific set of functionality. Frameworks are integrated into a system via inheritance and client relationships.
A framework in Java is typically implemented as a collection of classes organized into one or more packages. IDebug is just such a framework since it is implemented as a set of JavaBeans and other classes collected into the package idebug. These classes are used either (a) as “normal” classes with standard manual debugging techniques, or (b) as components within visual JavaBean programming tools.
3 Constructs
The core set of monitoring and debugging constructs: the assertion, call stack, and logging message, are provided by simple language constructs.
Assertions are simply provided via method calls. When an assertion fails, one of the following takes place: a specific exception is thrown, the current thread is stopped, the current context is halted (e.g., an applet or servlet is stopped), or the system is halted.
Call stack introspection is provided as part of the Java language specification. The call stack is used in several ways by the functionality introduced in the next few sections.
Logging messages are simple formatted text strings that are sent to one of several output channels. An output channel is simply any data channel through which we can send logging messages. Examples include the Java console, a StringBuffer, a file, etc.
This basic set of constructs is only the beginning of the story. They are generally only sufficient for simple, sequential, non-distributed systems. We augment this set by several new constructs specifically for concurrent and distributed systems based upon requirements imposed by development (how software is written) and system (how software is executed) contexts.
3.1 Functionality for Complex Systems
The development of complex systems often involves dozens to hundreds of developers located at several sites. This situation necessitates a decomposition of responsibilities in the development process.
Collaboration between teams and individuals working on different parts of the system is often ad hoc and opportunistic. Thus, a system-wide, regimented, fixed monitoring, debugging, and testing process is out of the question.
As a result, development groups define their own terminology and priority structure specific to their problem domain. The definition of such structure is accomplished with levels and categories in contexts.
3.1.1 Levels
Priority structures are realized by levels that let a developer assign a priority to actions. Levels organize debug information into a totally ordered set. The default levels range from 1 to 9 with well-defined increments: NOTICE (1), WARNING (3), ERROR (5), CRITICAL (7), and FAILURE (9). Localized error messages are associated with these standardized levels for regular logging output. The range of levels, like all other customization, is refined on a per-context basis (see below). For example, for a more complex system with subtle failure modes, perhaps a range of 1 to 100 is more appropriate.
3.1.2 Categories
Terminology is realized by an ontology of categories, strings like "NETWORK" and "GARBAGE_COLLECTOR" that denote the subsystem correlated with a specific debugging action. Each category has a level associated with it as well for filtering purposes.
At runtime, both categories and levels are used to prune information according to the demands of the current execution. This mechanism is discussed in detail in the next section since it interplays with the concurrency constructs.
3.1.3 Context
Additionally, subgroups of large development teams often have independent process and practices. But, especially during integration testing and system maintenance, they often need to understand, share, and utilize a codification of these practices. To satisfy this need we introduce the first-class notion of a context.
A context is an object that captures the full monitoring, debugging, and testing context of a subsystem. Independent ontologies (set of categories), level sets, filtering (see the next section), and more are bound to a context. This context is saved and restored as needed and is exchanged among teams like any other development artifact.
3.1.4 Statistics
Finally, a major challenge after constructing a complex system is understanding what it is actually doing as it runs. This understanding goes a long way toward helping with system evolution, maintenance, and optimization.
We introduce a statistic construct to assist with exactly this problem. Each statistic has a unique identifier and a description. It also has a unit (e.g., meters, frames per second, etc.), a scaling factor, initial values, and default increment and decrement values. We can also arbitrarily manipulate (reset, set, increment and decrement) a statistic. Finally, each statistic has report generation facilities specific to its domain.
For example, suppose we needed to gather statistics on a message passing system. We define a statistic called MsgPerSecond whose units are "messages per second", scale is 1000, default value is 0, and default increment and decrement are both 0.001. This means that this statistic is initialized to zero and each time the statistic is incremented it gains 0.001 * 1000 = 1 message per second. The information on units is used when generating statistics reports.
3.2 Functionality for Concurrent Systems
Monitoring and debugging concurrent systems necessitates the introduction of new concepts specific to concurrent environments.
Concurrent systems have multiple threads of control. Typically, each thread of control accomplishes some specific task: it transfers data, refreshes a GUI, etc. Thus, each thread is potentially the jurisdiction of a different development team.
Also, concurrent systems often have a hierarchical arrangement for threads of control. Java’s thread groups are one example. Threads are collected into named groups for security, management, and control purposes.
Therefore, we “tune” functionality on both a per-execution thread and a per-thread group basis. Each thread and each thread group has a context. These contexts are exactly the same as the contexts discussed earlier except they are bound to a single thread of execution or a thread group of such threads.
Contexts can be manipulated in a concurrency-safe fashion at runtime to dynamically change the monitoring behavior of an application. The primary manipulations of such contexts are changes in their filter specifications.
3.2.1 Tuning
Contexts can be tuned in several ways. Monitoring is tuneable on a:
-
1.
global basis by turning monitoring on or off as a whole, independent of any other settings.
-
2.
per-class basis. Individual classes can be identified as being important or unimportant to monitoring.
-
3.
threshold basis using monitoring levels. A current monitoring level can be set, after which time all monitoring code that is annotated with at least this level is evaluated.
-
4.
per-category basis. Specific categories can be identified as being important or unimportant to monitoring.
For all of the above functionality, the monitoring system uses the call stack to support runtime-configurable filters for logging messages based upon the current execution context of a thread.

Consider Figure 1. If a thread specifies that it is interested in a class but not a second class , then monitoring statements in will be executed when is inside of , but monitoring statements in will be ignored. These contexts are saved to persistent storage, thus “named” special-purpose contexts are created for reuse across a development team to help support and enforce a monitoring process.
Additionally, these concurrent contexts can be shared across threads and thread groups. A shared context that is tuned immediately impacts all execution constructs to which it is bound.
3.3 Functionality for Distributed Systems
The framework supports several extensions for monitoring distributed systems.

One problem typical of monitoring distributed systems is a loss of execution context when communication between two non-local entities takes place.
Consider the top-half of Figure 2. When object invokes a method on object , the thread within does not have access to the call stack from the calling thread in . The IDebug package supports what we call call stack currying to solve this problem. Information such as source object identity, calling thread call stack, and more is available to the monitoring framework on both sides of a communication. Such information is curried across arbitrary communication media (sockets, RMI, etc.), as seen in the bottom-half of the figure.
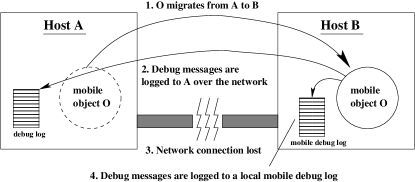
The IDebug package also supports the monitoring of mobile agent systems.
Mobile agent architectures often support disconnected computing. For example, in Figure 3, (1) an object migrates from machine to machine . For some time (2), can log debug information back to host , but then (3) might become disconnected from the network. Since can no longer communicate with , and printing monitoring information on ’s display is not useful, or perhaps even possible, must log monitoring information for later inspection (4).
To support this functionality, the IDebug package provides serializable debug logs. These logs are carried around by a mobile object and inspected later, perhaps when the object migrates back to its original host.
4 Impact on System Design and
Development
The impact of a monitoring framework like IDebug to systems design and development is extensive.
-
•
Analysis. The assumption of the availability of a flexible and comprehensive monitoring framework results in a conscientious domain analysis from a monitoring, debugging, and testing perspective.
Normally, this type of analysis either (a) never happens or (b) is rolled in late to system design or development. An example of such analysis is highlighted in Section 5.3.
-
•
Design. Design schedules are shorter than otherwise because the monitoring subsystem does not have to be designed by scratch as an afterthought, as is typical in many design efforts. Likewise, a new focus is found with respect to design integration of monitoring, debugging, testing, deployment, and management. Standardized methodologies and semantics for monitoring are considered early in system design.
-
•
Process. With the availability of such a monitoring framework, especially when coupled with complementary tools like JPP [8] and the CDL parser [5], the development process becomes much more focused on specification and rigorous testing. Likewise, component and system documentation is more organized, uniform, and complete.
-
•
Testing. In our experience, components and systems built with such a framework are much more robust. More thought has been put into monitoring, debugging, and testing because of the process imposed by the use of such tools.
-
•
Deployment. Since monitoring functionality is tuneable at runtime, some debug code can be shipped with product at no loss in performance, though at the cost of slightly larger executable size. System monitoring, debugging, and testing in the field is straightforward, empowering end-users’ contributions to the process, and potentially lowering support costs.
5 Requirements
In this section we will briefly present our project analysis, including our project concept dictionary, a review of our requirements for the monitoring package, and our goals.
5.1 Project Dictionary
At the beginning of the project analysis phase, a dictionary of concepts was developed so that all designers, developers, and users would have a clear and common language. The dictionary of terms is available in the full, high-level EBON specification of the system included with the package and available \htmladdnormallinkfootonlinehttp://www.kindsoftware.com/products/opensource/IDebug/docs/BON/.
5.2 Core Requirements
We require that the IDebug framework support the following requirements. The framework must:
-
1.
Provide an assertion mechanism. Assertions are the core construct of any debugging system. Assertions are inserted in program code either manually or automatically, and, if an assertion is violated, an error message is logged and/or a runtime exception is thrown and the program (potentially) halts.
-
2.
Support the output of logging messages. Printing miscellaneous monitoring messages, perhaps outside the context of the primary interface of a component, is essential in a good monitoring suite.
-
3.
Support multiple monitoring levels. Different types of errors, messages, and situations require different levels of response. An adequate monitoring framework should not only support levels, but the set should be ordered so that user- or developer-tuneable filtering of debug output can take place333An external filtering mechanism like grep could be used instead, though is usually more tedious for the tester..
-
4.
Complement the standard Java exception mechanism. Since this is a monitoring framework built for the Java language, it should work with, not against, the built-in exception mechanisms. In particular, prudent use of exception types (Exception verses Error) is necessary so that the framework is not overly intrusive to the developer444For example, if all exceptions were runtime exceptions, the developer would have to bracket nearly all code with try-catch blocks..
-
5.
Work with all development environments. IDebug must work with everything from the most flashy IDE to the lowly CLI runtime. This means that IDebug must be implemented as “100% Pure Java”; no proprietary extensions or native code may be used.
5.3 Application Requirements
Because our group builds a wide range of Java applications and components, we needed IDebug to support monitoring with all types of Java programs. This means that the framework must provide debug functionality that complements the following application types. Each type of application listed below is followed by a (non-unique) implication of that particular application assumption. In other words, each different domain implies the necessity of new piece of functionality.
-
1.
Console-based applications. Sometimes we want to send logging messages to an output stream different from our system’s stdout or stderr streams.
-
2.
Graphical user interface applications. Occasionally, we want to send logging messages to independent windows or message sub-frames within a larger application.
-
3.
Console-less applications. If there is no output channel, logging messages for later analysis is a reasonable course of action.
-
4.
Independent components such as beans, servlets, doclets, etc. Independent components should be able to maintain independent semantics and contexts. Conversely, sometimes it is useful to have a compositional application share a debug context among its components.
-
5.
Mobile agent/object applications. If an application has mobile sub-components, their debug contexts need to be mobile as well. Additionally, logging message output and/or storage should be location-independent and location-aware.
-
6.
Distributed applications. Distributed applications imply (at least) distributed control, distributed context, and distributed logging.
5.4 Innovative Requirements
Finally, we wish to support a set of (what we consider) “innovative” capabilities. While most of these goals are independent of the target language, they are facilitated by many of Java’s more advanced features. The list of innovative requirements includes support for:
-
1.
Categorized monitoring. Monitoring messages, errors, warnings, etc. should not only have a value (the debug level), but should have a category (a classification or taxonomy).
-
2.
Per-class tuning. A developer should be able to selectively turn monitoring on or off at a per-class level.
-
3.
A configurable runtime. We should not force developers to adopt our monitoring semantics. New semantics (ranges, base categories, etc.) should be configurable at design- and run-time.
-
4.
Multiple output interfaces. All logging messages need not be sent to the same output channel. Consider messages generated by UNIX’s syslog facility. Some messages are sent to the console, some are logged in a file, and some are sent directly to the system administrator via email.
-
5.
Concurrent monitoring. Each thread and thread group within a runtime should be able to construct its own context. More precisely, most of the above configurable options (categories, classes, semantics, output interface, and level) should be configurable on a per-thread and per-thread group basis. Additionally, these options should be configurable at runtime.
-
6.
Persistent contexts. Once a context is created, it should be possible to save it to storage for later access. This way, contexts can not only be shared across sets of components, but they can be shared across groups of developers.
-
7.
Statistics gathering. Gathering information about key system aspects over a long time-frame helps us understand critical bottlenecks and hot-spots in our systems. This information can also help the system self-tune, changing resource utilization or operating practices at run-time depending upon the current situation.
Now that we have a common vocabulary and understand the problem domain and the design goals, we will consider IDebug’s design.
6 Design
Due to space restrictions, we will only briefly cover the design of IDebug in this section. We will describe IDebug’s organization, its primary subsystems, and give an example of its use. Readers interested in more information should see the IDebug home page, available via \htmladdnormallinkfootKindSoftwarehttp://www.kindsoftware.com/products/opensource/IDebug/.
Several group members helped with IDebug’s initial analysis and design in a whiteboard-brainstorming session. Design refactoring first was done “by-hand”, then was moved to the Java design tool \htmladdnormallinkfootTogether/Jhttp://www.togetherj.com/.
6.1 Framework Structure
IDebug’s primary interfaces are called DebugOutput and DebugConstants.
- DebugOutput.
-
This is the interface to output methods that are used to send logging messages to various output channels. Features include methods like printMsg, print, and println.
- DebugConstants.
-
This is the interface that collects the semantics of the package including monitoring level ranges, standard logging messages, etc. It can be extended to change these values for specific monitoring sub-packages, applications, etc. An example of such a subtype is included as idebug.examples.FrenchConstants. A set of default categories are specified in the specification of this interface, as discussed in Section 3.1.1.
The primary classes of note are Debug, Assert, and Context.
- Debug.
-
Debug is the core class of IDebug’s monitoring facilities. The Debug class is used to configure monitoring for a component. Debug has methods for configuring the following options:
-
•
global, per-thread, and per-thread group monitoring activation (i.e., whether any debugging predicates are checked or monitoring commands are executed),
-
•
global debug output interface, debug semantics, and debug levels,
-
•
categories and class-level tuning at the global, per-thread, and per-thread group level,
-
•
configure contexts (see Context below) on a per-thread and per-thread group basis.
-
•
- Assert.
-
The class used to make assertions. A reference to an Assert object is obtained by calling the getAssert method of the Debug class. Assertions are made in program code by calling the Assert.assert method which has several polymorphic forms. The class also provides a static interface to making assertions.
- Context.
-
This class is the data structure that contains the information relevant to monitoring on a per-thread and a per-thread group basis. Output interface, semantics, categories, class-level tuning, and current level are all configured with this class.
Example extension classes and blackbox test code are provided with IDebug; they are collected in the idebug.examples package. In particular, the FrenchConstants interface implements the DebugConstants interface and is an example set of alternative debug semantics where error messages are in French and debug ranges are integers ranging from 1 to 100. The DebugTests class is the main class for all test code; TestSuiteThread contains the actual blackbox test code.
6.2 Framework Behavioral Description
The full behavioral specification of IDebug is included with the package as (a) a set of UML state, collaboration, and sequence diagrams, and (b) a full Extended BON (EBON) specification [6]. We will not provide these diagrams here due to space restrictions. Instead, we will summarize how one interacts with the IDebug framework from a developer’s point of view.
Readers should refer to Appendix A for example code using IDebug. Line numbers referenced below refer to the lines labeled in this example code. These code examples are from \htmladdnormallinkfootJikihttp://www.jiki.org/, an open source collaborative web architecture based on distributed components, thus the feature naming conventions. Note that almost all comments have been removed from the example code and it has been edited for relevant content.
6.2.1 Usage Overview
idebug.Debug is the core class of the IDebug monitoring facilities. The Debug class is used as the central facility for configuring monitoring for a component or application (lines 3, 12, 13, 15). All logging commands, on the other hand, are handled in the DebugOutput classes (lines 5, 14, 15, 25-26). Finally, all assertions are handled in the Assertion class (lines 4, 13, 23-24).
Core Configuration and Global Options.
The Debug class is non-static555See Section 6.3 below for a discussion of this design choice.. The first step a component or application must take is the construction a new instance of a Debug object (line 12). If an alternate implementation of monitoring semantics (i.e., categories, levels, error messages, etc.) is needed, the implementation is passed a DebugConstants interface via a constructor of Debug (lines 11-12).
Per-Thread and Per-Thread Group Contexts.
Each thread needs to construct a debugging context to detail its specific debugging needs. After creating a valid debugging context, encapsulated in the Context object, this object is passed to the instance of Debug via the addContext method so that the debugging runtime system has a record of the thread’s context.
Note that the debug runtime keeps a reference to the passed Context object, it does not make a copy of it. Thus, you can modify the Context (change debugging levels, add new thread-specific categories, etc.) after the context is installed and changes will be noted immediately by the debug runtime666A discussion of this design choice is detailed below. Note also that our code sample uses the global debug context, configured implicitly in lines 12, 15, and 16..
Debug Output Configuration.
Finally, the output medium of the debugging runtime has to configured. This is accomplished by constructing an implementation of the DebugOutput interface, e.g., ConsoleOutput. This object is then passed to the Debug object via the Debug.setOutputInterface method (lines 14-15).
Usage.
The IDebug framework is now fully configured. A call to debug.getAssert at any time returns a reference to the debug run-time’s Assert object (line 13). If a non-default implementation of DebugConstants interface is not installed, a call to debug.getDebugConstants returns a reference to these debug constants. Our code sample installed its own version of this interface, thus this call is unnecessary.
Finally, one calls the various methods of Assert and DebugOutput. The assert method of the Assert object is used to make code assertions (lines 23-24; note the mapping between the specification of the doGet method in lines 19-20 and the corresponding assertion). The print, println, and printMsg methods of the DebugOutput instance are used to output logging messages (lines 25-26). Additionally, methods like Utilities.dumpStack can be used to perform full stack dumps.
6.3 Design Decisions
Several non-trivial decisions were made during the design and implementation of IDebug. Some of these decisions are summarized below.
6.3.1 Static Verses Dynamic Interface
The original implementation of IDebug had a Debug class that was completely static. Meaning, all methods of Debug were declared static so that it behaved more like the interface to a library than an object in a framework. Since an instance of Debug didn’t have to be constructed, a reference to the object did not need to be handed around to various subsystems of the larger system being monitored.
We found that there were several drawbacks to this approach. First, changes to the interface of Debug necessitated a potentially large set of changes to program code. Second, most systems have a shared debugging context across subcomponents, so even though a reference to an instance of Debug didn’t have to be shared across components, an instance of Context often did. This restriction destroyed the whole reason for making Debug static in the first place.
Since moving to a non-static design, we have come across a few restricted situations where a static interface would be useful. Thus, the next release of IDebug will likely support both methodologies.
6.3.2 Persistence
The Context class is the only class in the IDebug package that implements the Serializable interface. We decided that centralizing IDebug’s configurability in a single class would facilitate configuration reuse. These contexts can be saved to storage and reused across application executions, project teams, or different component design and development efforts to standardize the design and execution of the testing process.
6.3.3 Runtime Configurability
As mentioned previously, changes to the state of an installed Context object has instant effect on the debug runtime. Thus, we provide a clone method so that multiple identical base contexts can be used across a set of threads or thread-groups for independent configurability. Note that if a single context is installed for many threads, changes to its state instantly affect all related thread’s debug contexts.
6.3.4 Extensibility
To simplify framework extension we designed two orthogonal interfaces for extensibility: DebugOutput and DebugConstants.
If a new output interface for logging messages and assertions is needed, a developer simply implements DebugOutput. See Section 9.1 for ideas about such extensions. New semantics can be configured by implementing the DebugConstants interface. See the next section for details on how semantics are refined.
6.3.5 Class-Specific Debugging
A decision was made to make all class-specific debugging configuration additive and reductive. One can either remove all classes from the debugging table then add classes one by one, or one can add all potential classes then remove them one by one. Meaning, when one adds “*” (a wildcard indicating that all classes should be added to the debug context), one is not adding all classes currently defined in this VM; one is adding all classes currently defined and all classes that might ever be defined in this VM. See Section 9.1 for a discussion of future work along these lines.
6.3.6 Context Configurability
As mentioned previously, debugging options should be configurable on a per-thread or per-thread group basis. On further consideration, we decided that two configurable settings should not be switchable at runtime: debug semantics and output interface.
The reason for this decision might not be immediately obvious, but consider the following two points:
-
•
Debugging output might be queued due to the temporary unavailability of an output channel or user, and
-
•
Source code that uses a debugging package makes explicit assumptions about the semantics of the package. Meaning, while debugging semantics might be switchable at runtime by the framework, it is not (usually) switchable at runtime for the application using the framework.
Due to these factors, the configuration of debugging semantics and output interface is immutable. Meaning, once these options are set for a debugging context, they cannot be changed.
Note that a new context can be created and installed. All the other flexibility mentioned in Section 5.4 is fully configurable at runtime on a per-thread and per-thread group basis.
6.4 Framework Extensibility
The IDebug framework is extensible in two dimensions: debug semantics and output interfaces.
6.4.1 Framework Semantics
The semantics of the package can be changed by implementing new versions of DebugConstants. An example of such an extension is provided in the form of the FrenchConstants class in the idebug.examples package. This class provides an implementation of DebugConstants that differs from the default implementation (DefaultDebugConstants) in two ways:
-
1.
Debug levels range from 1 to 100 instead of 1 to 10,
-
2.
Default debugging levels have been adjusted for this new granularity of debug levels, and
-
3.
Default logging messages, categories, and documentation are provided in French.
6.4.2 Output Interfaces
New implementations of DebugOutput can be designed to support sending logging messages to alternative output media/channels. The framework comes with several implementations: ConsoleOutput, which sends messages to the console of a Java runtime; WriterOutput, which sends messages to a Writer which can be used as part of a normal java.io compositional data stream; WindowOutput, which sends messages to a Swing window; and ServletLogOutput which sends messages to a servlet logging interface.
Now, we’ll briefly discuss the implementation of the IDebug framework.
7 Implementation
As mentioned previously, IDebug is implemented as a collection of Java classes organized into two packages. IDebug is shipped as either a Jar or Zip file with full documentation, formal specification (UML and EBON), user’s guide, and more.
7.1 Size and Performance
7.1.1 Implementation Size
| Implementation Summary | |
|---|---|
| (with test and example code) | |
| Total Number of Packages | 3 |
| Total Number of Classes | 20 |
| Total Number of KB of Java | 187.7KB |
| (includes code, documentation, | |
| and whitespace) | |
| Total Number of KB of classfiles | |
| Independent class files | 58KB |
| Jar (compressed) format | 32.1KB |
| Total Number of Lines of Code | 3808 |
| Total Number of Lines of Comments | 2639 |
| Comments/Code | 69% |
The implementation size of IDebug is summarized in Table 1. It is clear that, since the whole of IDebug is around 32KB of bytecode, it will not adversely impact the deployment size of all but the smallest applications or components.
The relatively large comment/code ratio is due to two reasons. First, we use semantic properties for program specification [7]. Thus, this system witnesses a full formal specification using both code-external documents, written in the EBON specification language, as well as in-code, using semantic properties in Javadoc-style comments. The other reason for the large numbers of comments is that we used Jass for contract specification and run-time testing [4].
7.1.2 Implementation Variations
We actually provide two versions of IDebug; one for rigorous testing and one for shipped code.
The first version is the standard package that is ready for delivery. It has all assertions turned off, no contracts enabled, etc. This is the version that we reported on above with respect to code size. This version is assembled in the idebug package.
The second, called IDebug High-Confidence, is a version of the framework where we have used Jass to generate generate test code for all contracts. This means that the resulting source code, collected in the idebughc package, as well as the compiled class files, are significantly larger that the non-augmented version. In fact, it is nearly twice the size of the idebug package and is significantly slower because of the high overhead of all of Jass’s run-time assertion analysis.
7.1.3 Implementation Performance
Performance characteristics of the IDebug framework are entirely based upon the speed of the Java run-time’s Throwable.printStackTrace method and Hashtable and StringBuffer implementations, since these classes are at the core of the exception and assertion-handling mechanisms in IDebug.
The Throwable.printStackTrace method is important to performance because, each time a message or assertion guard is triggered, the IDebug runtime has to determine if it should, in fact, execute the corresponding output code. It has to determine which class is currently in scope, which thread is currently running, etc. All of this information is gleaned by parsing the results of a printStackTrace method call777We realize that the information in such a stack trace is not guaranteed by the Java VM specification, but it is the best-effort data source that we have currently available..
Admittedly, a profile analysis of IDebug could reveal performance weaknesses. In general, any performance tuning would mean replacing data structures rather than changing core algorithms, since the algorithms are highly optimized in the current version.
In general, we believe that performance is not a high-priority issue in debugging complex systems, especially distributed or object-oriented ones. We make this claim for two reasons:
-
1.
The debugging phase of an implementation should be part of an ordered and reasoned test suite, and thus the use of the debugging framework should also be logical and methodical. In other words, rarely will it be the case that all threads within a complex application will have all their debugging options turned on simultaneously.
-
2.
We believe that debugging statements should not be written by hand or statically inserted into program code. Debug code should be “tuneable” at compile time, not just runtime888And thus the reason for our development of JPP. See Section 7.2 for more information., and thus debug framework performance should only matter for critical debug paths, of which there should be few.
7.2 Complementary Tools
Static debugging statements can clutter source code, increase object code size, and reduce execution speed. We have developed a application called JPP, the Java Parsing Pre-Processor, that helps avoid this problem by automatically transforming semantic property-based specifications into test code [8]. In short, JPP performs transformations of embedded program specification, in the form of Design by Contract-like [11] predicates in documentation comments, into IDebug test code at compile time.
We are also looking into extended other similar Open Source tools so that they can optionally use an IDebug-based interface. Such tools include iContract, Jass, and the JML tools [9]. Of course, our own EBON tool suite will also support such functionality.
8 Related Work
While several feature-full commercial Java development environments are on the market, none that we have reviewed come with an integrated debugging framework like IDebug. Several have single classes that provide some kind of logging interface, but the configurability and extensibility of IDebug are absent.
-
•
Jakarta’s \htmladdnormallinkfootLog4Jhttp://jakarta.apache.org/log4j/ package is the most popular similar framework for system logging. It supports notions of categories and logging messages to a small number of output channels, but provides no support for concurrent or distributed systems.
-
•
JDK 1.4 comes with a logging interface, as specified in \htmladdnormallinkfootJSR 47http://jcp.org/aboutJava/communityprocess/review/jsr047/. It too is quite immature when compared to IDebug, with support similar to that of Log4J, with handlers used for output interfaces, runtime configuration, and functional areas for categories. It, too, has no support for concurrent or distributed systems monitoring.
-
•
Several articles in industry magazines such as Java Developer’s Journal and Java Report have discussed Java debugging frameworks. All support assertions and integrate into the Java exception model, but none support even the most basic features of IDebug.
-
•
Microsoft’s Visual J++ comes with a com.ms.cfc.util.Debug class that provides a simple interface to message logging and assertions. The supplied implementation is not extensible, does not support concurrency nor any of the other advanced features of IDebug, but does support conditional compilation and a system to switch messages on and off at runtime. Debugging output simply goes to the console or to a dialog box.
9 Conclusion
IDebug is one of the most advanced debugging frameworks available today for Java. It is extremely configurable, supports a wide range of application types, and, because it is an open system, is extensible by the developer.
This work was originally accomplished in 1997, prior to any other logging system being available. We have since used it in several major complex systems, both in academia and industry. In a non-concurrent or distributed context, it is equivalent to the popular Log4J and the new java.util.logging package in JDK 1.4. But because neither supports complex concurrent or distributed systems, we hope that their developers, or developers of non-Java complex systems, will learn from our experience and incorporate some of the ideas from this system into their future work.
9.1 Future Work
We encourage developers to extend IDebug. In particular, we are interested in alternative implementations of the DebugOutput and DebugConstants interfaces. Below, we list a series of possibilities for output interfaces.
-
•
DebugOutputDB — used to log messages to a database via JDBC.
-
•
DebugOutputEventSource — send messages to arbitrary listeners within a Java virtual machine, perhaps as part of a compositional JavaBeans-based application.
-
•
DebugOutputFrame — to send messages to an arbitrary (Swing/AWT) frame within a larger GUI.
-
•
DebugOutputLog — to persistently log messages for off-line debugging.
-
•
DebugOutputMessager — send messages via a JMS-conformant messaging infrastructure.
-
•
DebugOutputRemoteEventSource — to provide messages as distributed events, perhaps as part of a Jini [13] application.
-
•
DebugOutputSpace — store debugging events in a JavaSpace [12].
9.1.1 Other Planned Development
We also plan on extending the logging subsystem to provide the developer with the ability to customize the format of log messages. In particular, we think that the addition of a time-stamp and thread identification would be particularly useful. This extension will be added via DebugContext, thus will be configurable at all levels.
Adding support for the use of arbitrary regular expressions to denote per-class and per-package monitoring is also of interest. In general, we have found the current design adequate, but can see the potential scalability problems for extremely large-scale applications.
We believe that a debugging GUI that supports both design-time and runtime customization of DebugContext would be useful. This functionality would likely be accomplished via a new BeanInfo subsystem. Such a GUI would integrate nicely with existing graphical IDEs, could be used for tutorials, and would be beneficial to non-expert developers.
Finally, we are investigating integrating IDebug with the ÜberNet distributed messaging infrastructure [14]. Our primary goal is to support the currying of call stacks across execution contexts. This would mean that assertions and exceptions on remote (receiver) machines would have access to the call stack of the sending thread. Currying across other networking layers, especially RMI, is also of interest to us.
9.2 Thanks
The author would like to thank the Infospheres Group for help with the initial problem analysis and early IDebug design. In particular, the comments of Mani Chandy, Dan Zimmerman, Wesley Tanaka, and Adam Rifkin were invaluable. Also, Nelson Minar used the first version of IDebug as part of his thesis work; his comments were very helpful. Matt Hanna helped review a previous version of this paper.
References
- [1] Graham Hamilton, Michael L. Powell, and James G. Mitchell. Subcontract: A flexible base for distributed programming. In Proceeings of the 14th Symposium on Operating Systems Principles. Sun Microsystems, Inc., December 1993.
- [2] Richard Helm, Ian M. Holland, and Dipayan Gangopadhyay. Contracts: Specifying behavioral compositions in object-oriented systems. In European Conference on Object-Oriented Programming/ACM Conference on Object-Oriented Programming Systems, Languages, and Applications, volume 25/10 of ACM SIGPLAN Notices, pages 169–180. ACM SIGPLAN: Programming Languages, ACM Press and Addison-Wesley Publishing Company, October 1990.
- [3] Ian M. Holland. Specifying reusable components using contracts. In ACM Conference on Object-Oriented Programming Systems, Languages, and Applications, pages 287–308. ACM SIGPLAN: Programming Languages, ACM Press and Addison-Wesley Publishing Company, 1992.
- [4] The Jass homepage, 2001. Available via http://semantik.informatik.uni-oldenburg.de/jass/.
- [5] Joseph R. Kiniry. CDL: A component description language. In Proceedings of the COOTS ’99 Advanced Topics Workshop on Validating the Composition/Execution of Component-Based Systems, 1999.
- [6] Joseph R. Kiniry. The Extended BON tool suite. http://ebon.sourceforge.net/, 2001.
- [7] Joseph R. Kiniry. Semantic properties for lightweight specification in knowledgeable development environments. Submitted for publication, 2002.
- [8] Joseph R. Kiniry and Elaine Cheong. JPP: A Java pre-processor. Technical Report CS-TR-98-15, Department of Computer Science,California Institute of Technology, November 1998.
- [9] Gary T. Leavens, K. Rustan M. Leino, Erik Poll, Clyde Ruby, and Bart Jacobs. JML: Notations and tools supporting detailed design in Java. Technical Report 00-15, Department of Computer Science, Iowa State University, August 2000.
- [10] Bertrand Meyer. Object-Oriented Software Construction. Prentice-Hall, Inc., second edition, 1988.
- [11] Bertrand Meyer. Advances in Object-Oriented Software Engineering, chapter Design by Contract. Prentice-Hall, Inc., 1992.
- [12] Sun Microsystems, Inc. JavaSpaces Specification. Sun Microsystems, Inc., revision 1.0 beta edition, July 1998.
- [13] Jim Waldo. Jini Architecture Overview. Sun Microsystems, Inc., 1998.
- [14] Daniel M. Zimmerman. ÜberNet: The Infospheres Network Layer User Guide, 1.0a1 edition, February 1998.
Appendix A Example Code
        (1)     public abstract class JikiComponent extends HttpServlet
        (2)       implements Servlet
                {
        (3)       public static Debug debug;
        (4)       public static Assert assert;
        (5)       public static DebugOutput debugOutput;
        (6)       public static JikiIDebugConstants debugConstants;
                  ...etc...
                }

        (7)     public class DummyComponent extends JikiComponent
        (8)       implements Servlet
                {
                  ...etc...
        (9)       public DummyComponent()
                  {
        (10)        if (debug == null)
                    {
        (11)          debugConstants = new JikiIDebugConstants();
        (12)          debug = new Debug(debugConstants);
        (13)          assert = debug.getAssert();
        (14)          debugOutput = new ConsoleOutput(debug);
        (15)          debug.setOutputInterface(debugOutput);

                      // turn on debugging if appropriate
        (16)          checkDebugging(debug);
                    }
                  }
                  ...etc...
                }

        (17)    public class Dispatcher extends JikiComponent
        (18)      implements Servlet
                {
                  ...etc...
                   *
        (19)       * @precondition ((req != null) && (resp != null))
        (20)       * Parameters must be non-null.
                   */

        (21)      protected void doGet(HttpServletRequest req,
        (22)                           HttpServletResponse resp)
                  {
        (23)        assert.assert(((req != null) && (resp != null)),
        (24)                      "Parameters must be non-null");

        (25)        debugOutput.println(debugConstants.TRANSACTION,
        (26)                            "Dispatcher GET: " + req);
                    ...etc...
                  }
                  ...etc...
                }