Analysis of Network Traffic in Switched Ethernet Systems
Abstract
A 100 Mbps Ethernet link between a college campus and the outside world was monitored with a dedicated PC and the measured data analysed for its statistical properties. Similar measurements were taken at an internal node of the network. The networks in both cases are a full-duplex switched Ethernet. Inter-event interval histograms and power spectra of the throughput aggregated for 10ms bins were used to analyse the measured traffic. For most investigated cases both methods reveal that the traffic behaves according to a power law. The results will be used in later studies to parameterise models for network traffic.
keywords:
Switched Ethernet, Network traffic, Traffic model, MMPP, noise1 Introduction
The rapid growth of Internet technologies has created an urgent need for predictive models of performance. To this end, it has become imperative to obtain a good abstraction of the diverse types of network traffic: partly in its own right so that usage patterns can be studied, but mainly to provide input to performance models.
The work described in this paper is part of an ongoing research project which seeks to develop accurate performance models of large-scale, high-performance IP networks comprising hundreds or thousands of switched Ethernet routers. Networks of this scale are becoming commonplace and seem likely to grow significantly in number (and probably also size) in the foreseeable future. Understanding the performance of these networks is of increasing importance, particularly given the trend for guaranteed quality of service in private networks and between internet service providers (ISP). How, for example, is service quality affected by a failure in a router or link and how can a network be engineered to maintain service guarantees in the presence of failures? Future proposals for Internet charging, e.g. [1], also raise interesting new challenges that cannot be properly addressed without some model of network performance.
This paper focuses on one aspect of this exercise, namely that of monitoring with a view to modelling. We focus on IP traffic which has been measured by monitoring a real network using a high-performance trace capture facility capable of monitoring network links up to 100Mbps. Fitting the measured IP traffic is complicated by the fact that the data typically is correlated. IP traffic streams cannot therefore be described accurately by pure Poisson models [2, 3], with the unfortunate consequence that well-known analytic models are no longer adequate to predict and analyse performance. Most realistic models put forward turn out to be mathematically and/or numerically intractable for analytic solution. The Markov Modulated Poisson Process (MMPP)[4], however, does have non-zero autocorrelation between inter-arrival times and can often be used to describe effectively the type of traffic observed in networks, sometimes seen as self-similar. However, we consider self-similarity synonymously with a time series having a heavy-tail distribution (typically polynomial) or shows time-scale invariance. Self-similarity is defined rigorously in terms of the latter property.
The paper makes the following contributions:
-
•
We describe a monitoring scheme using conventional hardware and software that is capable of capturing a trace of switched Ethernet traffic on links of up to 100Mbps.
-
•
We present results of significant behavioural observations made using the monitoring scheme at different parts of a university department network.
-
•
We show findings of preliminary statistical analyses of traces made for a range of different traffic types at several points in that network at different times. For some traffic types we find noise, whilst others appear to be uncorrelated.
The rest of the paper is organised as follows. In section 2 the network under study is described along with the monitoring techniques used to collect traffic data. Section 3.1 describes the statistical methods used to abstract the critical features of the traffic in a quantitative way. Sections 3.2, 3.3 and 3.4 present the raw numerical data and the results of the statistical analysis. The paper concludes with a discussion of future research plans and directions. Ultimately we would like incorporate our findings appropriately in queuing models.
2 Network architecture and monitoring
The network monitoring work was carried out on the Department of Computing’s network at Imperial College in London. This comprises a network of full-duplex switched Ethernet hubs. Each node (a workstation or PC) is connected via a 100Mbps link to either a 24-way or 48-way switched Ethernet router (Extreme ‘Summit-24’ or ‘Summit-48’ routers). These are connected in turn to a central hub (a ’Black Diamond’) 111In the following we will also refer to this part of the network synonymously as the central hub or core router to distinguish it from the smaller hubs. The distinction between hubs, bridges and routers is slightly blurred as the department is connected to the campus via an Ethernet and the smaller hubs are switched. whose current configuration can support up to 24 1Gbps links and several 100Mbs links [5]. Various file and CPU servers also hang off the central hub. In general every node is only one hop away from the central hub although there are a few exceptions. The sketch in (fig. 1) illustrates the basic topology of the network.
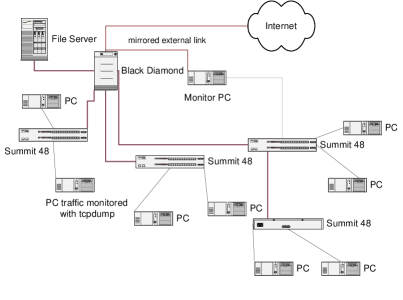
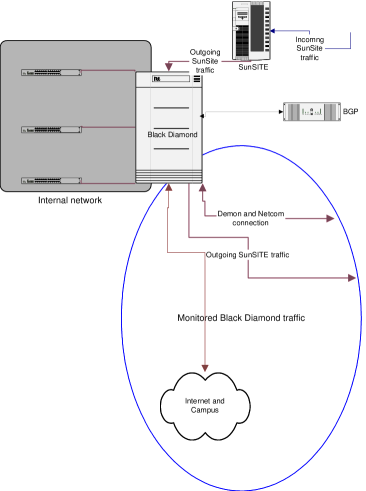
The core router is used for the internal and external network traffic. Internally it used when nodes from different switches exchange data over the network. Externally it is used for the in and outgoing traffic to nodes in the department (PCs, web-server, mail-server, news-server etc.) and also for the outgoing traffic of the SunSITE [6] ftp server. Additionally there are 2 connections to ISPs, Demon and Netcom.222The mirrored ports we monitor do not include the internal departmental traffic. The latter has to be excluded due to the suspected high volume. Also, the internal traffic is handled on a different level by the Black Diamond as it simply forwards Ethernet frames based on media access control (MAC) addresses. For the external traffic, routing tables have to be consulted. This is illustrated in (fig. 2).
An important distinction between this network and many others previously studied is the Ethernet connection regime. Unlike conventional Ethernet, the switched Ethernet used in the department is collision-free. A conventional Ethernet is a single shared resource (collision domain) which can only be used by one node at a time. Attached nodes contend for the Ethernet and, once claimed, hold it for the duration of a data transfer. Access to the Ethernet is managed by the CSMA/CD protocol which essentially implements a collision detection and back-off algorithm.
By contrast, in a full-duplex switched Ethernet all nodes have a separate network connection for inward- and outward-bound traffic. Each hub contains a switch, which is a multiplexer that connects two switch ports. Contention for a switch output is resolved by queueing, in contrast to collisions in a conventional Ethernet. Essentially, the collision domain has been broken down into a number of separate collision domains between each node and its switch. Routing decisions may be taken directly by the switch or may be referred to a table look-up prior to switching. At this stage we are not interested in modelling the activities within a router so the distinction is not important. For a good introduction to the details of Ethernet technology see [7].
2.1 Monitoring
To monitor a conventional shared Ethernet one simply needs to switch one network interface card (NIC) into promiscuous mode in which the interface “listens” to all packets sent along the carrier. This option is not available for switched networks as each node only sees the data that is destined for itself. This benefits security, but makes it necessary to use different methods for monitoring. One option is the simple network monitoring protocol Snmp [8] but this suffers from lax security which makes it relatively easy to attack, essentially by remotely reprogramming the switches.
SNMP has therefore been disabled and the monitoring
problem has been resolved by arranging for
the traffic on one port to be mirrored to another. Data is
captured from this mirrored port using tcpdump [9]
which generates
a summary of each Ethernet frame passing through the port in either
direction.333Only the first 150 bytes of each packet are captured. This
is sufficient to gather information about source, destination, size
and type of the frame.
The 100Mbps links can be trace-captured in this way using a PC of modest
power444A Celeron 400MHz, 128 Mb RAM with four fast SCSI disks, in our
case running Linux.
Here, we report results for traffic to and from the
outside world through the Black Diamond router
and a single PC using the same (mirroring)
technique (100Mbps links in both cases). This enables the individual
traffic streams to and from
individual nodes to be compared with the aggregate traffic seen
between switches.
Analysis of data from tcpdump reveals information about higher level
protocols that use Ethernet frames to transmit their packets.
This is mainly IP (used by TCP and UDP). tcpdump actually
reports on all Ethernet frames that pass the NIC. So the name
is slightly misleading. We have used the program to get
-
•
A timestamp indicating when the kernel has “seen” the packet
-
•
Source and destination IP address and port number
-
•
The size of the frame (only the user data is reported, the headers for various protocol layers have to be added on to recover the actual size of the frame)
-
•
The traffic type (tcp, udp, icmp, etc.)
for every frame that is transmitted.
2.2 Measurement errors
We gained some idea of the size of the error in our measurements by looking at the reported inter-arrival times. Given the time stamp and size of the previous packet one can determine the time the Ethernet has been busy and therefore when the next arrival can possibly have happened. We noticed that the reported times were up to 100 sec too early in a number of cases. This is due to several factors
-
•
The network interface card introduces errors by buffering data unreliably
-
•
tcpdumpruns as a user-level process and hence can simply miss CPU cycles if the machine is under a heavy load -
•
PC-based hardware is less reliable than, for instance, SPARC hardware when it comes to small timings [10].
The only way to get better timings is to spend more money on
equipment. We assume that our measurement error is around 50
sec. In general tcpdump seems to be a fairly reliable
program as has been pointed out by [11]. Another reason for the
seemingly implausible inter-arrival times may be the fact that we
monitor a full-duplex connection which is able to send and receive
simultaneously. However, the kernel of the monitoring OS can only deal
with one packet at a time and will hence introduce errors if sending
and receiving happens closely together.
3 Traffic Analysis
Two of the first investigations of the statistical nature of network traffic were [2, 3]. The authors found evidence that the observed traffic did not conform with the assumption that inter-arrival times of frames were uncorrelated and could be modelled by Poisson arrivals. They used methods that had been developed earlier by Hurst who was investigating the “ideal” size of reservoirs (a good summary of Hurst’s work is given in [12, 13]). In particular Hurst introduced the rescaled range statistic which gives an idea of the self-similarity or long-range dependence of a time series. Many other statistics, which are all proved or conjectured to be related to the Hurst parameter, have since been introduced. A good review of the estimators and their relationships can be found in [14, 15, 16]. The next section is based on the material found in those papers. In this investigation we will use the power spectrum to analyse the correlation of the monitored data and inter-event interval histograms to analyse the inter arrival time distribution.
Other methods to investigate the correlation of the data are the rescaled range statistic, the log-variance plot, detrended fluctuation analysis, the Fano factor and the Allan factor. For details of these methods we refer to [12, 13, 14, 15, 16, 17].
3.1 Statistical Methods
3.1.1 Inter-event interval histograms
The time series resulting from our measurements describe point processes. One way to characterise the behaviour of such a process is to compute the distribution of inter arrival times of the events. To do this, we plot the inter-event interval histograms (IIH). Of course, we need to keep in mind that our inter-arrival times may show significant inaccuracies if the time between events is less than 50 sec (see section 2.2).
The plots we show are all double-logarithmic plots. The bins grow exponentially in size, i.e. cover intervals of 0 to 2 seconds followed by [2,4) [4,8) , …. The y-axis of the plot is the number of inter arrival times falling into a given bin divided by the size of the bin (to approximate a density function and make sure that bigger bins do not get a bigger weight) and also divided by the total number of arrivals (so that we can compare different observation periods).
For most plots we find that a large part of the resulting graph can be fitted to straight line. This implies that there is a power law behaviour of the probability density function
This is a characteristic behaviour for heavy tail distributions like Pareto, Lévy, Cauchy, Zipf etc. We have not attempted to fit any particular distribution because we want to investigate in future work how universal this behaviour is and what its causes are.
Most importantly we can say that none of the histograms would suggest an exponential distribution similar to the plot for an MMPP in (fig. 14), although this is not clearly contradicted for some cases.
Note that the error bars in the histograms have been calculated by averaging the histograms of several different observation periods and correspond simply to their standard deviation.
3.1.2 Power Spectrum
To gather information about the correlation of the point process observed, one can go down many avenues. For a time series of length the auto-correlation function at lag is defined as
where is the mean and the variance. In fact it is usually easier to work with the Fourier transform of the auto-correlation function. By the Wiener-Khintchine theorem [18], under certain assumptions, this is the same as the power spectrum (density) of the time series signal 555We should note that this is not a very rigorous way of defining the power spectrum, as the time series has to fulfil certain criteria for the integral to be well defined, for instance.
Since the actual point process tends to be rather sparse it is best to turn the time series into an aggregate time series of counts. In our investigation we have used 10ms bins for the aggregation in line with previous research [2, 3]. Again one is looking for power laws where the power spectrum behaves like where is the frequency. The exponent turns out to be 0 for white noise and 2 for a Brownian motion. From the relation of the power spectrum to the auto-correlation function it also follows that an exponent close to but smaller than 1 corresponds to long time correlations
If a times series exhibits scaling laws, i.e. if for some function , it has to exhibit power law behaviour as and is the only non-trivial solution to the above functional equation. This behaviour is then of course related to what is known as self-similarity. In fact, the exponent is related to the Hurst factor. Also, there are many more measures, like the Fano factor which can be used to characterised the time series.
The power spectra were computed using standard methods published in the Numerical Recipes in C with overlapping windows [19].
3.2 Measurements taken at the core router
3.2.1 Overall traffic
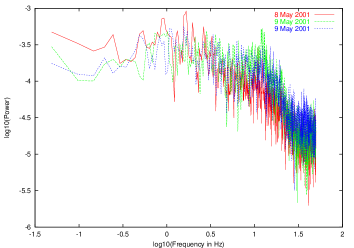
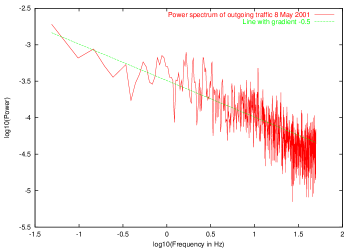
The first set of plots (fig. 3-5) shows some results from the measurements taken at the core router666This is the machine labeled “Black Diamond” in figures 1and 2. We looked at the traffic that was observed for 18 days between 12.30 and 12.35. We neglected Fridays, Saturdays and Sundays as they may well have slightly different characteristics as users may go home earlier or stay at home in the first place.
The
traffic is dominated by the ftp traffic of SunSite which
explains why the in and outbound graphs (fig. 4 and
5) for the histograms look very
different to the graph in (fig. 3), as they do not
include the SunSITE traffic. The graphs
(fig. 3-5) suggest
that the distribution of the inter arrival
times might follow a power law. We suspect that the left-hand side
of the graphs are mainly shaped by measurement errors. However this is
difficult to say for sure without more accurate measurements. It is
interesting to note that the power spectrum of the entire traffic
(fig. 3)
seems to fall into two distinct parts and looks very different from
the traffic that does not include the ftp traffic
(fig. 3-5). Also, it
seems difficult to claim that it would follow a power law.
The plot of the power spectrum actually shows three different days
and since all of them
show the same behaviour in the power spectrum in
(fig. 3), this seems to be not
a singular observation.

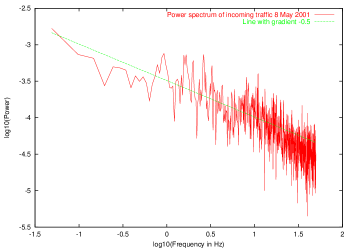
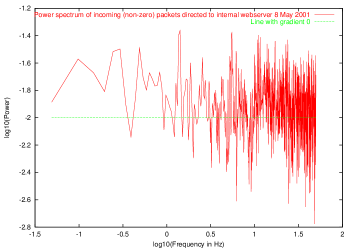
The power spectrum for the incoming traffic suggests a behaviour that can be well approximated by a power law.

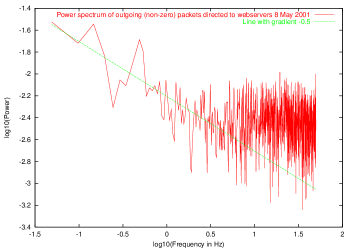
Similarly, the outgoing traffic shows fairly well power law characteristics that indicate some long-term correlation. In all graphs there appears to be a strong contribution at the lowest frequencies.

Further investigation is necessary to understand the power spectrum of the overall traffic better. One reason for its surprising nature may be the fact that we only monitor one half of the traffic (see fig. 2). However, if this was the case one would expect the other power spectrum to have similar features. Another reason could be the fact that the traffic is mainly ftp traffic and this application causes the feature.
All histograms plotted so far have shown behaviour for the bins under 0.1 milliseconds that is not consistent with a power law. Due to our limitation in the accuracy of the timestamp we cannot say whether this is a feature of the traffic or an artifact of our measurements. We have neglected the very large bins for most fits as well because the number of events for these is very small compared with other bins.
We can, however, say with some confidence that the network traffic does indicate the existence of correlation and that the assumption of exponential inter-arrival time is not in line with our measurements. Rather we seem to have an inter-arrival time distribution that follows a power law.
3.2.2 Web traffic: an example for a single traffic class
We also looked at traffic that is likely to be caused by web related use. The way we identified this traffic in our traces was to look for a server with port number 80, hence the cautious statement as there is no obligation to run only web servers on that port. For these plots we also filtered out packets that were exactly 64 Bytes. The reason behind this is that these packets are likely to be caused by opening and closing TCP connections and also by acknowledgements of data.
The first graph (fig. 6) shows the inter-arrival time distribution of frames that come from the outside for a server on port 80, hence (usually) requests to one of the web servers running in the department. The inter-arrival time distribution is well described by a power law. The power spectrum has hardly any gradient at all which means that it may be nothing but white noise and therefore has no long-range dependence. Therefore is may be possible to model this particular stream of traffic as Poisson arrivals.

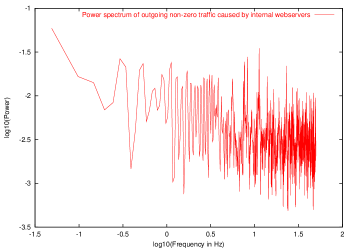
The second set (fig. 7) shows the replies from the internal web servers. The IIH does not seem to follow a power law in an obvious way, although one could fit a straight line for the bins between 2.5 and 5 along the x-axis. Partly this plot looks “worse” due to a slightly different scale of the y-axis compared to the other plots. The power spectrum shows little correlation. One would expect the replies to be uncorrelated as the requests already were (see fig. 6).

The last set of plots (fig. 8) for the core router shows the traffic created by users inside the department that can be interpreted as requests for documents from an external server. Note that the slope of the power spectrum is similar to that of the overall outgoing traffic, which seems sensible as the web-traffic is a dominant part of the outgoing traffic. In contrast the slope of the IIH is very different. This is not caused by the neglect of small packets as they tend to contribute to the left-most parts of histograms.

So, the most interesting observation is that the incoming and outgoing traffic for the internal web-servers appears to be uncorrelated. However, the inter-arrival time distribution still follows a power law. We need to check this result by, for instance, looking at log files of the web-server.
3.3 Individual Node Traffic
In this section we analyse traffic that we have monitored to and from a single node in the student labs.

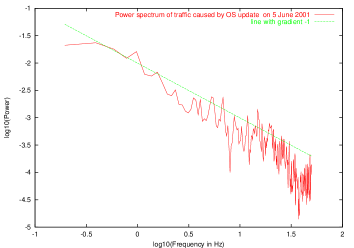
Every morning the OS on the LINUX machines in the student labs gets updated by automatic scripts. These scripts update parts of the OS of the target machine by pushing new packages (rpms) to all LINUX machines in the department. When we analysed the inter arrival time distribution of all packets during that time we found that the distribution still follows a power law (fig. 9). One reason for this could be the well-established fact that the distribution of file sizes in UNIX systems follows a power law [20]. Measurements taken for the node under investigation are shown in figure (10) 777The graphs taken in figure (10) show that this is true for the machine we monitored. The results are compiled with a slightly modified script from [20].. On a local homogeneous network the transmission speed is constant, say 100 Mbps or 12.5 Mbytes/sec. Therefore we can measure the size of a file in units of time: 1 Byte corresponds to roughly seconds. Assuming a program pushes a large number of files over a local network as fast as possible and the file size distribution is heavy-tailed, one would expect the delivery time of files to be following a heavy-tailed distribution also. This still seems to be reflected in the inter-arrival times of frames, where a file corresponds to a number of frames, as the maximum size of an Ethernet frame is about 1500 Bytes. Also, the distribution in figure (10) is static in the sense that all files of the OS are included no matter whether they are ever used or not. This is something to keep in mind when web-servers are investigated: The distribution of the set of files comprising the web-server may be very different to that of files requested from the web-server. The total set might well include a large number of unpopular or “dead” files.
We checked that the file size distributions on a number of our UNIX/LINUX machines that include the node monitored do follow a power law extremely well. Most surprisingly, we found that the distribution for Solaris seems to follow exactly the same pattern as that of a LINUX machine.

Still we fail to see how the distribution of the delivery times of files can produce the picture we see for the inter-arrival times of frames on the Ethernet. Also, the slopes of distribution are different. However this may provide a clue to the understanding of the cause of the distribution. An interesting experiment would be to monitor the transmission of a collection of files that is known to have a geometric size distribution. In this case one would expect the delivery time distribution to be Poisson.
We also looked at the traffic behaviour caused by web-surfing (fig. 11 - 13). Our criteria for web-related traffic is the same as in the previous section. First we had a look at all frames sent to and received from the node, i.e. not just the web-related traffic. Both the histogram and the power spectrum suggest power laws.

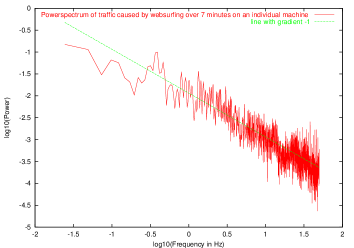
So the situation for traffic of a single type is different to that of the core router where the entire traffic caused a power spectrum without power law behaviour. Also, the slopes of the fitted lines do not coincide with those fitted for the core router. This seems to indicate a non-trivial aggregation process of the traffic, if one assumes that internal nodes are fairly uniform888Of course the data for the internal web-servers already seems to suggest that nodes are not necessarily equal..
For the received traffic, we again filtered out the zero packets (fig. 12). The power spectrum of the incoming traffic appears to follow a power law describing noise. The power spectrum seems to suggest a very strong long range correlation as the exponent is very close to 1.

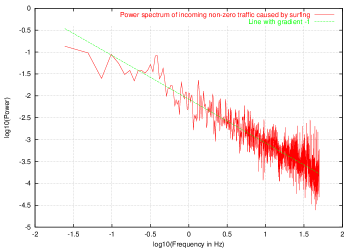
From the relationship between the power spectrum and the autocorrelation function it can be shown that, a gradient of the power spectrum slightly smaller than 1 implies long-range dependency in the time series.
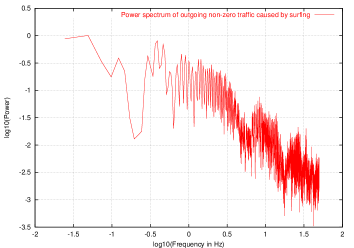
The outgoing traffic looks less exciting but still seems to follow power laws (fig. 13). In fact the observed exponent is close to that estimated in aggregate traffic at the core router (fig. 8). However the exponent of the IIH is very different, which may be related to the problem that this plot is based on a few hundred frames only in the observed time period. Therefore one should be careful in generalising the results.

Earlier research into the behaviour of the inter-arrival time distribution of modem connections made to an ISP has shown that the distribution is essentially exponential, i.e. the traffic is Poisson [21]. Filtering for packets that are non-zero and heading towards a server gives us every frame related to a “GET/POST” command, when we look at the outgoing web-requests. So, we do not observe the time between mouse-clicks users make when surfing with their web browser, as e.g. in-lined images and cascaded style sheets will spoil our data by triggering extra requests. Still this data should a close approximation of the time between successive mouse-clicks Assuming that the web-surfing behaviour of our users is no different to those dialling in via an ISP, this emphasises the need to model network behaviour differently at different levels. While the connection creation my follow an exponential behaviour [21] the actual data transfer during the connection does not.
3.4 Traffic generated by an MMPP
There have been various papers claiming a successful modelling of network traffic using Markov modulated Poisson processes [22]. This work was inspired by earlier work that successfully showed that MMPPs can exhibit a Hurst coefficient for a limited range of time scales [23]. Also, there are ways to fit given data to an MMPP using various methods [24].
We have begun preliminary studies of using MMPPs to model the network traffic we have observed. We ran simulations of a 2 state MMPP with realistic choices for the arrival rates and packet sizes (though their distribution is not bi-modal). The resulting histograms differ clearly from the ones we have shown for the real traffic. None of the examples we looked at showed a suitable IIH. But one should keep in mind that this hope is very unrealistic as the IIH is simply the combination of two Poisson processes, which will not exhibit a power law. However, the power spectrum can be made to look realistic (14). This casts doubts on the ability to use

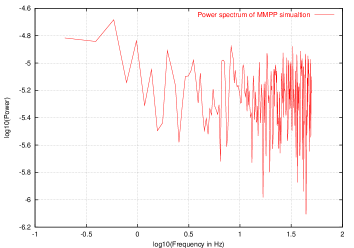
MMPPs for realistic modelling of network traffic, as it should certainly capture the features shown for the inter-arrival time distribution. It may be possible to achieve better results with the use of more states. The interpretation of the number of states may, however, be difficult. Ideally, one would have hoped to be able to have a correspondence between states and types of traffic. However, the results from the filtered web-traffic show that even for one particular traffic type, the inter arrival time distribution is more complicated than a simple exponential. Also, more subtle extensions to the idea of MMPPs may be more successful in capturing the statistical features exhibited by the network traffic [25]. One possibility is that MMCPPs, which include (compound) arrivals and departures of geometric size, show a more realistic behaviour. Any MMPP must give exponential tails in the inter-arrival time density function, being a (varying) mixture of Poisson processes. Consequently there is no chance of representing a polynomial tail. However, a given arrival process might be approximated “up to the polynomial tail”, the point at which the approximation becomes poor pushed sufficiently to the right by suitable parameter selection. This work is still very much in progress.
4 Conclusions, work in progress and future directions
We have shown that different types of network traffic show power law behaviour in both the IIH and their power spectra. The correlation of the traffic as indicated by the power spectrum can be very low (outgoing web traffic for a single node) to very high (incoming traffic for a single node).
Recently, there have been claims that self-similarity seen in network traffic are caused by the CSMA/CD algorithm used in shared Ethernets [26]. Since our network is full-duplex the automatic update of the Linux machines should not experience any collisions. Still the power spectrum seems to indicate that the traffic has some long-range dependence. We need to investigate further whether this could be caused by some hidden parts of the network topology. Otherwise the results would suggest that self-similarity of network traffic can occur without collisions. The automatic traffic may be a good starting point for a further investigation as we do not have the added problem of indeterminate user behaviour, but rather the demand is caused by a simple script. It remains to be seen though how these results could be used to explain the behaviour of router as they tend to handle multiple sources of traffic.
Soon, the departmental connection will be upgraded to a 1Gbps link. We
would like to extend our monitoring capabilities to that link. One
problem we will face is that the 1 sec resolution of
tcpdump running on a PC will no longer be sufficient to distinguish
between packet arrivals when the link is fully utilised. However,
other reports seem confident that tcpdump can still be useful for
monitoring faster links [27].
Another aim is to automate the way power spectra and IIHs are generated to enable us to observe the results for a long period of time and see whether we can use the results to generalise the traffic behaviour we have observed so far.
Our initial hope had been to use the results of the analysis to fit a fairly simple MMPP. As this has proved elusive, we will investigate whether there is a time regime in which MMPPs or MMCPPs are adequate to model the network traffic. If this is the case, it may be possible to treat the remaining traffic on a longer time scale causing the network traffic to change from one phase to another, for example. We will have to determine that time scale. In such a two-time-scale model, the main issues will be
-
1.
to find the equilibrium between events on the longer time scale (e.g. router rebooting)
-
2.
to find the time constant for a new equilibrium to be reached after each type of event
-
3.
to investigate the transient behaviour immediately after each type of event.
A possible interpretation of noise is the notion of self-organised criticality (SOC) [28, 29]. The word criticality is borrowed from physics where a critical state of a system is related to an infinite correlation length and the system going through a phase transition. There are many areas in science where has been seen: see for instance [29] for a good overview of the topic. We would like to investigate whether the systems we have been monitoring are really exhibiting noise and if this can tell us, similar to the noise observed in heart beats of humans, whether the network is in a “healthy” or “sick” state.
Recently the analysis of time series in the context of financial data has seen a great deal of interest. We need to investigate how we can utilise those results for our purpose, as the behaviour of the data and aims of its analysis seem similar [30]. The same is true for models of car traffic on roads. There have been great advances in the modelling and prediction of car traffic using, for instance, cellular automata. Models capture the critical behaviour of real car traffic, like phantom traffic jams [31]. Indeed the models are good enough to be used for the prediction of city and motorway traffic. So, how does the traffic seen in Etherland correspond to real car traffic? Well, in the state of Full-Duplex the rules on a 100Mbps line are simple and resemble that of a winding country road:
-
1.
There is no overtaking.
-
2.
There is a universal speed limit, and all participants drive up to the limit (100Mbps MBps) .
-
3.
The participants in the traffic are safety conscious and keep a distance to the packet ahead, the interframe gap (IFG). This is the length of 12 Bytes or approximately 1sec.
There are however some significant differences:
-
1.
Associating the length of cars and lorries with that of packet sizes in Bytes, one finds that the ratio of small to big packets is about 23, so Etherland lorries are huge. For road traffic this ratio will be close to between 4 or 8.
-
2.
Assuming we monitor the traffic as it passes through a point in the network, it takes a small packet about 5sec to go past. In real traffic assuming a speed limit of 80km/h (50mph) a 5m long car takes about 1/4 second to cover its own length. This difference has an interesting effect on the observed data. To observe as many events in road traffic as one does in, say, 5 minutes of network traffic one has to observe road traffic for several hours.
-
3.
Though there are conservation laws for cars, data can be annihilated without trace at any time in any place of the system. In models of car traffic one can make assumptions that cars that are being driven to work in the morning are most likely to return to their garages in the evening. For data traffic this is not necessarily the case.
-
4.
Another curious feature, if one wants to associate a “car” with a data packet, is that data packets never see other traffic whilst on the road; only in buffers is it possible for them to “see” the surrounding traffic.
For a recent publication dealing with a model for TCP traffic using cellular automata, see [32].
Acknowledgements
The authors would like to thank the Computer Support Group and in particular Stuart McGregor and David Wragg in helping with the data capture. We would also like to thank Maya Paczuski and Jörn Davidsen of the Maths Department of IC for fruitful discussions on self-similarity and criticality, and Will Knottenbelt and David Thornley for stimulating conversations.
The data used for the investigation can be made available on request, though we will have to anonymise it due to data protection issues. Similarly, the scripts used to perform the actual data monitoring are available.
The research was funded by EPSRC (grant QUAINT).
References
- [1] C. Paschalidis and J. N. Tsitsiklis, Congestion–dependent pricing of network services IEEE/ACM Transactions on Networking 8, vol.2, p. 171-184, (2000) ; Hal Varian and Jeff MacKie-Mason, Pricing the Internet Presented at ”Public Access to the Internet”, JFK School of Government, May 26-27, 1993.
- [2] Will E. Leland, Murad Taqqu, Walter Willinger Daniel Wilson, On the Self-Similar Nature of Ethernet Traffic (Extended Version), IEEE/ACM Transactions on Networking, Vol. 2, No. 1, February 1994
- [3] Ashok Eramilli, Onuttom Narayan and Walter Willinger, Experimental Queueing Analysis with Long-Range Dependent Packet Traffic, IEEE/ACM Transactions on Networking, Vol. 4, No. 2, April 1996
- [4] W. Fisher and K.S. Meier-Hellstern, The (Markov Modulated Poisson Process) MMPP Cookbook, Performance Evaluation, No.18, pp.149-171 (1996)
-
[5]
ExtremeNetworks documentation for Summit48 and Black
Diamond,
http://www.extremenetworks.com/ -
[6]
http://sunsite.doc.ic.ac.uk/ -
[7]
Charles E.
Spurgeon, Ethernet the definitive guide,
O’Reilly 2000, ISBN 1-56592-660-9.
The Ethernet Frequently Asked Questions can be found athttp://www.NetworkUptime.com/faqs/ethernet;
The Ethernet RFC 1180 A TCP/IP tutorial,http://www.ietf.org/rfc/rfc1180.txt - [8] William Stalling, SNMP, SNMPV2, SNMPV3, and RMON 1and 2 3rd ed., Addison Wesley 1999, ISBN 0201485346
-
[9]
Tcpdump website
http://www.tcpdump.org/ - [10] W. R. Stevens, TCP/IP illustrated vol. 1, Addison-Wesley 1996, ISBN 0 201 63346 9
- [11] Stanislav Belenki and Sven Tafvelin, Analysis of Errors in Network Load Measurements, ACM SIGCOMM Computer Communication Review, vol. 30, no. 1, January 2000
- [12] Benoit Mandelbrot, The Fractal Geometry of Nature,W. H. Freeman, 1982
- [13] Jens Feder, Fractals, Plenum 1988
- [14] B. Pilgram and D.T. Kaplan, A comparison of estimators of noise, Physica D 114 pp. 108-122, (1998)
- [15] M.S. Taqqu, V. Teverovski and W. Willinger,Estimators for long-range dependence: an empirical study, Fractals 3 No. 4 pp. 785-798, (1995)
- [16] S. Thurner et al., Analysis, synthesis, and estimation of fractal-rate stochastic point processes, Fractals 5 No. 4 (, pp. 565-595, 1997)
- [17] J. Beran, Statistics for Long-Memory Processes, Chapman & Hall 1994, ISBN 0 412 04901 5
- [18] N. Wiener, Generalized harmonic analysis, Acta Mathematica, 55, p. 117, (1930); A. Khintchine, em Korrelationtheorie der stationären Prozesse, Mathematische Annalen, 109, p.604, (1934)
- [19] Numerical Recipes in C, W. Press, CUP 2nd edition (January 1993)
-
[20]
Unix File Size Survey
http://www.base.com/gordoni/ufs93.html, we used a slightly modified version of the shell script published on this web-site - [21] A. Feldmann, A.C Gilbert, W. Willinger and T.G.Kurtz, The Changing Nature of Network Traffic: Scaling Phenomena
- [22] Sandrine Vaton, ’Fractal’ versus ’Markov’ models of traffic and Near completely decomposable Markov models of traffic, ATM & IP workshop 2000 at Ilkley
- [23] Stephan Robert and Jean-Yves Le Boudec, A Markov modulated process for self-similar traffic Saarbrucken, Schloss Dagstuhl, Germany, October 25-29, 1995 ; Stephan Robert and Jean-Yves Le Boudec, New models for Pseudo Self-Similar Traffic, Performance Evaluation 30, vol. 1-2, p. 57-68 (1997)
- [24] K.S. Meier-Hellstern, A fitting algorithm for Markov-modulated Poisson processes having two arrival rates, European Journal of Operational Research 29 370-377, (1987); Madhu D.K. Bhabuta and Peter G. Harrison, Analysis and modelling of ATM (AAL5) traffic traces
- [25] P.G. Harrison and R. Chakka, The MM CPP/GE/c/L G-Queue at equilibrium, Proceedings of P&QNet 2000, Nagoya, Japan, 2000; P.G. Harrison and R. Chakka, A Markov modulated multi-server queue with negative customers - MM CPP/GE/c/L G-Queue to appear in Acta Informatica 37 (2001)
- [26] Kensuke Fukuda, Hideki Takayasu and Misako Takayasu, Origin of Critical Behavior in Ethernet Traffic, cond-mat/0007435
- [27] Kenjiro Cho, Koushirou Mitsuya and Akira Kato, Traffic Data Repository at the WIDE Project USENIX 2000 FREENIX Track, San Diego, CA, June 2000.
- [28] P.Bak, C. Tang and K. Wiesenfeld, Self organised criticality: an explanation of 1/f noise, Physical Review Letters, 59, p. 381, (1987)
- [29] H. J. Jensen, Self-Organised Criticality, CUP 1998
- [30] R. N. Mantegna and H.E. Stanley, An Introduction to Econophysics, CUP 2000, ISBN 0 521 62008 2 and J. Voit, The Statistical Mechanics of Financial Markets, Springer 2001, ISBN 3 540 41409 6
- [31] D. Helbing, Traffic and Related Self-Driven Many-Particle Systems cond-mat/0012229
- [32] T. Huisinga et al., A Microscopic Model for Packet Transport in the Internet, cond-mat/0102516