Non-intrusive on-the-fly data race detection using execution replay.111In M. Ducassé (ed), proceedings of the Fourth International Workshop on Automated Debugging (AADEBUG 2000), August 2000, Munich. COmputer Research Repository (http://www.acm.org/corr/), cs.SE/0011005; whole proceedings: cs.SE/0010035.
Abstract
This paper presents a practical solution for detecting data races in parallel programs. The solution consists of a combination of execution replay (RecPlay) with automatic on-the-fly data race detection. This combination enables us to perform the data race detection on an unaltered execution (almost no probe effect). Furthermore, the usage of multilevel bitmaps and snooped matrix clocks limits the amount of memory used. As the record phase of RecPlay is highly efficient, there is no need to switch it off, hereby eliminating the possibility of Heisenbugs because tracing can be left on all the time.
1 Introduction
The never ending urge for faster and more robust computers, combined with the existence of cheap processors causes a proliferation of inexpensive multiprocessor machines. Multithreaded applications are needed to exploit the full processing power of these machines, causing a widespread use of parallel applications. Even most contemporary applications that are not CPU-intensive are multithreaded because the multithreaded paradigm makes it easier to develop servers, applications with an MDI (multiple document interface) such as Windows programs, etc.
However, developing multithreaded programs for these machines is not easy as it is harder to get a good view on the state of a parallel program. This is caused by the fact that there are a number of threads222In this paper we will consider an execution of a parallel program as being a process consisting of threads executing on a machine with processors. running simultaneously. Moreover, the very fact that the computation is split into simultaneous parts can introduce errors that do not exist in sequential programs. These synchronisation errors show up because parallel programs are developed in order to let a number of threads work on the same problem, hence they will share data. It is of paramount importance that the accesses performed by the different threads are properly synchronised. Too much synchronisation will deadlock the program, while a lack of synchronisation will lead to race conditions. Such a race condition occurs when two or more concurrently executing threads access the same shared memory location in an unsynchronised way, and at least one of the threads modifies the contents of the location.
#include <pthread.h>

unsigned global=5;

thread1(){
  global=global+6;
}

thread2(){
  global=global+7;
}

main(){
  pthread_t t1, t2;

  pthread_create(&t1, NULL, thread1, NULL);
  pthread_create(&t2, NULL, thread2, NULL);

  pthread_join(t1, NULL);
  pthread_join(t2, NULL);
}
The program depicted in Figure 1 is an example of a program containing a race condition. The program uses a shared global variable (global), initialised with value 5. The first thread (main) starts two additional threads, t1 and t2, executing respectively the functions thread1 and thread2. Both threads change the global variable. As the threads do not synchronise, the final value of global will be 18, 11 or 12. The latter two are the result of one of the threads overwriting the new value written by the other thread.
As race conditions are (most of the time) considered bugs, they should be removed. Unfortunately, race conditions are difficult to find because their occurrence depends on small timing variations. Although it is possible to detect race conditions using a static approach (using source code analysis, as done by [28]) this is not feasible for nontrivial programs (it has been shown that detecting race conditions statically is an NP complete problem for programs that use synchronisation that is powerful enough to implement mutual exclusion [12, 18]). Therefore, most race detection tools detect race conditions dynamically during an actual program execution.
In this paper, we present and describe RecPlay[24], a tool that detects data races (data races are harmful race conditions; see next section) dynamically. RecPlay was implemented for the Solaris operating system running on Sun multiprocessors with SPARC processors. During the test phase of RecPlay, we have found data races in several programs we tested (including the SPLASH-2 suite [29], and the Athapascan system [4]). All of the races that were reported were genuine data races that had stayed undetected until then.
In the next section, we start with a few definitions about race conditions followed by a description of data race detection techniques. The section ends with an overview of our method. The next section describes our implementation. This part is followed by an evaluation section containing performance data. The paper is concluded with an overview of related work.
2 Data races
2.1 Definitions
A race condition occurs when two threads access the same shared location in an unsynchronised way and at least one access modifies the value at the location. We distinguish two types of race conditions: race conditions that are used to make a program intentionally nondeterministic: synchronisation races, and race conditions that were not intended by the programmer (data races).
We need synchronisation races to allow for competition between threads to enter a critical section, to lock a semaphore, or to implement load balancing. Removing synchronisation races makes a program completely deterministic. Therefore, in this paper, we do not consider synchronisation races a programming error, but a functional and useful characteristic of a parallel program.
Data races are not intended by the programmer, and are most of the time the result of improper synchronisation. By changing the synchronisation, data races can (and should) always be removed333There are a few applications that use data races intentionally, e.g. relaxation algorithms..
It is important to notice that the distinction between a data race and a synchronisation race is actually a pure matter of abstraction. At the implementation level of the synchronisation operations, a synchronisation race is caused by a genuine data race (e.g., spin locks, polling, etc.) on a synchronisation variable.
If the programmer creates his/her own synchronisation operations, we also have to make a distinction between feasible races and apparent races. The difference between them can be intuitively understood from the following example.
| thread1 | thread2 |
|---|---|
| result=x; | while (done==FALSE); |
| done=TRUE; | y=result; |
Technically speaking, in this fragment, there are no explicit synchronisation operations, and therefore, a naive race detection will detect two races: one on result and one on done. However, after taking the semantics of the program fragment into account, there is only one data race that can actually occur, namely on done because the data race on result cannot occur, provided that done was set to FALSE before the two threads were created.444This is true if the computer has a memory model that guarantees at least processor consistency. Modern processors with weaker memory models require some kind of serialisation instruction (e.g. a STBAR instruction on a SPARC) between the two store operations performed by the first thread to make this work correctly. This example only serves to explain the concept. We say that his program fragment contains two apparent data races, but only one data race is feasible.555All synchronisation races should be feasible races. A synchronisation race that is apparent but not feasible is an indication that the synchronisation is superfluous.
2.2 Detecting data races dynamically
As mentioned before, a dynamic data race detector finds data races that occur during a particular execution. In order to detect the conflicting memory operations, one should collect all memory operations executed during a particular execution and information about their concurrency. The concurrency depends on the (order of the) executed synchronisation operations. By analysing the traced information one can find the data races that occurred during that particular execution. However, this type of post-mortem approach is not feasible due to the very large trace files that have to be generated. However, by carefully examining the requirements for data race detection it is possible to limit the information that has to be traced without sacrificing the efficiency of the detection.
There exists basically two (dual) methods for detecting data races using collected memory and concurrency information:
-
•
for each access to a global variable, the access is compared against previous accesses by other threads to the same variable. This requires us to collect, for each global variable, information about past accesses666It suffices to collect information about the last load and store operation of each thread.. It is obvious that this will lead to a huge memory consumption, especially if each memory location is a potential global variable with life time equal to that of the program itself, as is the case for e.g. programs written in the language.
-
•
for all parallel pieces of code, the memory operations are collected and compared. This method consolidates the fact that all memory operations between two successive synchronisation operations (called segments from now on) satisfy the same concurrency relation: they are either all concurrent or not concurrent with a given operation.
Given the sets and containing the addresses used by the load and store operations in segment , the concurrent segments and contain racing operations if and only if
Therefore, data race detection basically boils down to collecting the sets and for all segments executed and comparing parallel segments.
It is clear that the second method is better suited for programming languages with unconstrained life time of and access to shared variables. However, two problems remain:
-
1.
treating all memory accesses the same way prevents us from making a distinction between the synchronisation (due to the memory accesses performed by the synchronisation operations) and the data races;
-
2.
collecting all memory operation introduces a huge overhead, both in time and space. The unavoidable intrusion gives rise to the probe effect[8], possibly causing Heisenbugs.
The last problem is a dramatic problem, as it seems unsolvable. Indeed, we cannot circumvent the tracing of all memory operations if one wants to detect data races. However, it is possible to alleviate the problem by tracing an application in two phases.
2.3 Data race detection using two phases
Data race detection using two phases detects data race in a programn execution using two ‘equivalent’ executions:
-
1.
synchronisation races are dealt with during the first phase. During this record phase a limited amount of information about the execution is traced;
-
2.
during the second phase, all the information needed to detect data races is traced, and the information traced during the first phase is used in order to guide the second execution. This execution is guided in order to enforce the execution to be equivalent (two executions are said to be equivalent if they yield the same internal program flow) with the first execution.
In order to be able to force an execution to be equivalent with another execution, information about the ‘decisions’ that (could) have an impact on the program flow of the first execution should be traced. This information is:
-
•
input received from sources outside the process such as reading from disk, system calls such as gettimeofday(), random(), …This paper will assume that all input can be fed back during a replayed execution, either because the input is on stable disk or is replayed, e.g. by intercepting system calls;
-
•
‘input’ received from other threads that are part of the same process777In this paper, we only deal with parallel threads belonging to one process. Different processes exchanging data (e.g. using mmap()) are not considered.. Indeed, as each load operation possibly reads a value written by another thread this should be considered input. Note that these are the race conditions mentioned before.
It seems that this does not solve our problem: we have to trace all memory operations in order to get a faithful re-execution, making it impossible to get a trace of an execution that is not perturbed. However, tracing all race conditions is not necessary. If we only trace the synchronisation races, a correct re-execution is only possible in the absence of data races. If the execution contains one or more data races, the re-execution will (possibly) fail after the data race starts having an effect on the execution. As the point at which the data race starts effecting the execution occurs after the occurrence of the data race itself, it is possible to detect the data race during the guided re-execution.
Using two phases has a number of benefits:
-
•
the overhead introduced during the record phase will be small as:
-
–
the number of synchronisation operations is usually much smaller than the total number of memory operations,
-
–
we can trace a synchronisation operation as being a single operation, although the synchronisation operation will typically perform (e.g. in a spinning loop) a number of memory operations,
-
–
making a distinction from the beginning between synchronisation races and data races makes it easier to detect only the data races during the replay phase,
-
–
-
•
it is easy to trace the synchronisation operations as they are usually implemented in a dynamically linked library, making it possible to intercept them by interposing an instrumented library.
This solution allows us to perform an intrusive data race detection during a ‘normal’ re-execution. The price we have to pay is that we need two executions in order to collect all the information.
Although this solves part of our problem (the intrusion is limited), this is not a viable solution as we still need to collect a lot of information during the replayed execution. However, it is possible to limit the amount of information we need to collect in other to find data races.
2.4 Limiting the amount of traced information
A naive tool could perform the data race detection post-mortem, forcing us to collect all information in memory or on disk. However, if an execution contains a data race, there is no need to keep looking for other data races. Indeed, due to the so-called avalanche effect, the first data race should be removed before the others. Moreover, as soon as (the effects of) a data race occurs, the replayed execution is no longer guaranteed to be correct. On-the-fly detection is therefore a viable alternative: data race detection is performed during the execution, and as soon as a data race is found, information about it is displayed. This method will use less memory if a data race shows up near the start of the program. However, a program execution with a data race near the end, or with no data race at all, will still use a huge amount of memory as this approach keeps on adding and sets to memory. It is therefore important to remove them as soon as it is clear that there are no more segments that will need them for future comparison. A segment can be removed if all other threads have progressed beyond the point in logical time when the segment did terminate. After that point in time, there can be no more segments started that possibly cause a data race.
If a program execution contains a data race, the programmer is interested in the racing instructions and the variable they race on. Therefore, we have to collect the address of the instruction and the address of the variable used for every memory operation contained in a segment. However, as this amounts to a huge memory consumption, RecPlay only stores the addresses used and no information about the instructions themselves. This information is sufficient to detect data races, but not the offending instructions. A third execution (identification phase) is needed to locate these instructions. During this execution, the knowledge about the data race (address of the variable, identities of the threads, the identity of the segment and type of operation (load or store)) is sufficient to locate the actual racing instructions.
The online data race detection is therefore performed by RecPlay using three phases:
-
1.
record phase: trace all synchronisation operations,
-
2.
replay & detect phase:
-
•
for each executed memory instruction: trace the address used,
-
•
for each synchronisation operation executed:
-
–
make sure it is executed at the right moment: between the same two synchronisation operations as during the recorded execution,
-
–
compare the traced memory operations of the ended segment with previously executed parallel segments. If a data race is found: end the program,
-
–
add the collected information ( and ) to the list of segments,
-
–
remove obsolete segments from the list,
-
–
-
•
-
3.
if a data race was found: identification phase.
In the next section, the techniques used to implement RecPlay are discussed.
3 Implementation
As mentioned in the introduction, our method has been implemented for Solaris. Our tool RecPlay will detect the first feasible data race in an execution as long as the application under test only uses the Solaris (or POSIX) synchronisation operations. This still applies if one builds own synchronisation operations (or uses a third party library) on top of the Solaris or POSIX variants.
Data races detected in user programs that also use their own synchronization operations can also be apparent data races that are not feasible. However, at least one of the apparent data races must be a feasible data race [18] that is used to synchronize the other memory references (and hence is a synchronization race). By replacing user defined synchronization operations by Solaris synchronization operations, or by putting the new synchronization operations in a separate library that is flagged as synchronization library, we can prevent RecPlay from detecting such synchronization races during subsequent runs.
3.1 Instrumentation
In order to collect the memory reference information and to record/replay the synchronisation operations, RecPlay intercepts these operations using JiTI (Just in Time Instrumentation, [23]). JiTI was developed for RecPlay but is a general instrumentation technique able to deal with hard to instrument features such as code in data, data in code and self modifying code.
The two major difficulties when inserting code into binaries are (i) correctly distinguishing between code and data (especially when code is located in data, when data is located in code, or when self-modifying code is used) and (ii) correctly relocating the code and data after inserting instrumentation code.
In existing systems, these two difficulties can only be solved by applying a sophisticated analysis (disassembling the program into basic blocks and control flow graphs) of the binary. Hereby, assumptions have to be made about the origin of the code. Most systems can be broken by offering hand-written machine code to it. A careful analysis for large programs can take a inordinate amount of resources (both in time and space).
JiTI solves these problems (i) by creating two versions of the process: one for the data accesses and one for the code accesses and (ii) by not inserting instrumentation code in the process, but by replacing instructions by calls to instrumentation code. By cloning a process and by executing the code from an (instrumented) copy, and using the data from the other copy, we get rid of the need to distinguish between code and data.
Given the size of the original process, a clone is created at address () (up to address ). Since we do not insert instructions, but only replace instructions, the instrumented version of the instruction at address will reside at address .
We now have access to two copies: one copy that is entirely considered as data, and another copy that is entirely considered as code. In order to make sure that data is taken from one copy, and the code from the other copy, we will have to modify addresses that do not point to the right copy (by increasing or decreasing them with ). It turns out that addresses used to access data are mostly absolute data addresses, while, on contemporary microprocessors, code addresses are mostly relative addresses (position independent code). Since relative addresses do not require relocation when moved to another location in memory, the best choice is to fetch the code from the clone, and the data from the original copy of the process. This means that the relocation effort can be limited to the rare –especially on a SPARC processor– absolute code addresses (to make sure that the execution will never jump back to the non-instrumented version of the process888Some instructions that are known to make use of correct absolute addresses (such as returns), do not need to be instrumented.) and to the rare code-relative data addresses that might be used in the code (e.g., for data that is located in the code, such as address tables).
In these cases where the relocation cannot be done at clone time (e.g. for memory operations, where it is impossible to distinguish the memory operations that use relative addresses from those that use absolute addresses), it suffices to check the addresses on-the-fly by instrumenting the instructions that make use of them. The instrumentation of the clone can be performed before the program starts or during the execution (by filling the clone with trapping instructions and by instrumenting an instruction (or a whole page) whenever an instruction is executed for the first time). It is even possible to have different clones (for parallel programs) with different instrumentation for different threads. It is also possible to change the instrumentation during the execution. This can be used to deal with self-modifying code: store instructions are instrumented to write the data to the original and a trap instruction to the clone. If the trap instruction is ever executed, JiTI intercepts the trap and instruments the instruction (if necessary). By having the instrumentation code do further instrumentation, the instrumentation can modify itself dynamically.
JiTI is also able to intercept dynamically linked library calls, and does not instrument the memory operations in these libraries. This is ideal for making a distinction between synchronisation and data races: all Solaris synchronisation operation are contained in a dynamically linkable library.999The library has no static variant, as is the case for most of the system libraries. As such, the many memory operations that are used by the synchronisation operations are not seen.
RecPlay and JiTI have been implemented for Sun multiprocessors running Solaris 7. The implementation uses the dynamic linking and loading facilities of the operating system. A number of dynamic loadable libraries have been created: one records the order of the synchronisation operations, another one detects data races during a replayed execution, and the last library identifies the offending references while replaying a previously recorded run. Using an environment variable, the Solaris program loader is forced to load one of these libraries each time it loads a user program. The libraries contain the necessary routines to perform initialisation before the actual program starts. Neither the user program nor the thread library needs to be modified as the RecPlay library inserts itself automatically between the user program and the thread library. This is because we want to keep the RecPlay operation (record, replay, race detection, reference identification) a feature of an execution, rather than a feature of a program.
3.2 Tracing and replaying the order of the synchronisation operations
In previous work, we have developed ROLT (Reconstruction of Lamport Timestamps), an ordering-based record/replay method, where only the partial order of synchronisation operations is traced by means of (scalar) Lamport clocks attached to these operations. To get a faithful replay, it is sufficient to stall each synchronisation operation until all synchronisation operations with a smaller timestamp have been executed. The execution traces consist of a sequence of timestamps, one trace per thread. The method [10, 21] has the advantage that it produces small trace files (it is not necessary to log all timestamps) and that it is less intrusive than other existing methods [17]. Moreover, the method allows for the use of a simple compression scheme [22] which can further reduce the trace files.
3.3 Collecting and comparing the addresses of the memory operations
As mentioned before, two lists of addresses are used for every segment : the load operations are collected in and the store operations in .
These addresses are collected in a bitmap (one for each list). Such a bitmap contains a on place if address was used. As a linear bitmap would require MB, a multilevel bitmap is used (see Figure 2).
The multilevel bitmap uses three levels: two levels containing page tables and one level containing the actual bitmaps. The highest level is addressed using the 9 highest bits of the addresses. This level contains pointers to page tables at the second level. These page tables are indexed using the next 9 bits and contain pointers to the actual bitmaps. The actual bitmaps are indexed using the remaining 14 bits of the address. Indexing the multilevel bitmaps using a 9/9/14 scheme results in page tables and bitmaps of 2kB. This makes the frequent allocating/deallocating of these data structures simple enough to implement it ourselves without reverting to malloc()/free(). Measurements show that this speeds up an execution with about .
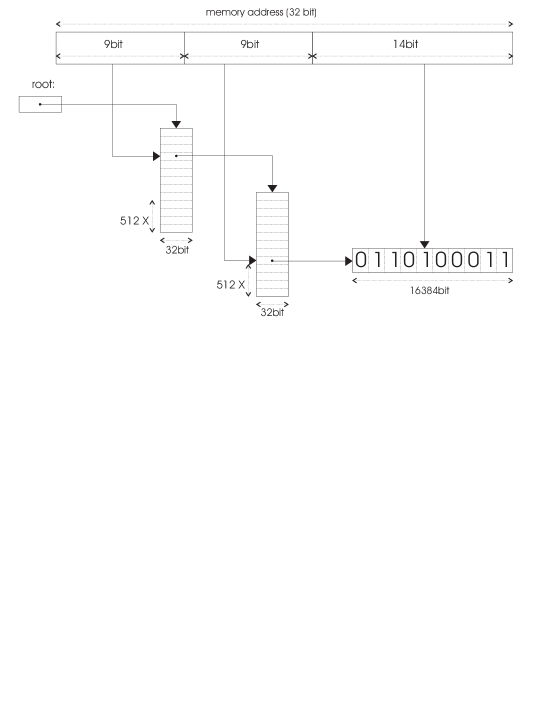
Although the use of a bitmap means that some information is lost – two or more accesses of the same address are counted as one – this is not a problem for data race detection. Indeed, if one of these accesses is involved in a race, the subsequent accesses are also involved in a data race. The use of multilevel bitmaps makes it possible to compare the segments in an efficient way.
3.4 Detecting and comparing parallel segments
In our race detection tool, we use a classical logical vector clock [13, 7] to detect concurrent segments (left part of Figure 3). Updating vector clocks is time-consuming, but this is not an issue during replay. As vector clocks are able to represent the happened-before [9] relation (they are strongly consistent), two vector clocks that are not ordered must belong to concurrent segments. This gives us an easy way to detect concurrent segments.
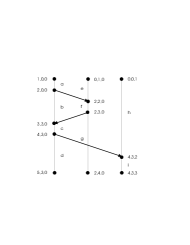
3.5 Detecting Obsolete Segments
Logical matrix clocks [20] are traditionally used to discard information in a distributed environment: the componentwise minimum of the columns yields the maximum number of segments per thread that can be discarded (right part of Figure 3) [30, 25].
However, in practice we can discard more information than is indicated by logical matrix clocks as logical clocks capture causality, which is one of the weakest forms of event ordering. In a particular execution, all events are executed is some order (not specified by the program), even if they do not have a causal relationship. Classical logical clocks are not able to capture this kind of additional execution-specific ordering.
Our data race detection method uses clock snooping [6]. Instead of maintaining matrix clocks, a snooped matrix clock is built each time a segment ends, using the latest vector clock of the processors. All segments that have a vector clock smaller than the componentwise minimum of the snooped matrix clock can be discarded as they will not be needed in the future anymore.
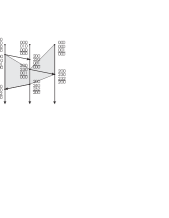
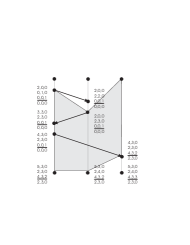
In Figure 4, we show the information we obtain by the two brands of matrix clocks. It is clear that a snooped clock allows to discard more segments than a classical logical clock. Figure 5 compares the behaviour of logical and snooped matrix clocks.

3.6 Identification Phase
Once a data race is found using the scheme described above we know the address of the location and the segments containing the offending instructions, but not the instructions themselves. Detecting these instructions requires another (deterministic) replay of the program. This operation is completely automatic however and incurs no large overhead. The replayed execution runs at full speed up to the segments that contain the data race and from then on the instrumentation is switched on and the offending instruction is searched for. We are always guaranteed to find the first data race on a particular variable.
4 Experimental evaluation
| program | normal | record | replay+detect | ||
|---|---|---|---|---|---|
| runtime | runtime | slowdown | runtime | slowdown | |
| cholesky | 8.67 | 8.88 | 1.024 | 721.4 | 83.2 |
| fft | 8.76 | 8.83 | 1.008 | 72.8 | 8.3 |
| LU | 6.36 | 6.40 | 1.006 | 144.5 | 22.7 |
| radix | 6.03 | 6.20 | 1.028 | 182.8 | 30.3 |
| ocean | 4.96 | 5.06 | 1.020 | 107.7 | 21.7 |
| raytrace | 9.89 | 10.19 | 1.030 | 675.9 | 68.3 |
| water-Nsq. | 9.46 | 9.71 | 1.026 | 321.5 | 34.0 |
| water-spat. | 8.12 | 8.33 | 1.026 | 258.8 | 31.9 |
| radiosity | 21.13 | 21.50 | 1.018 | data race found | |
| geometric average | 1.021 | 30.6 | |||
Tables 1-3 give an idea of the overhead caused by RecPlay during the record and the detection phase for programs from the SPLASH-2 benchmark suite. The experiments were performed on a Sun multiprocessor with 4 processors. The average overhead during the record phase is limited to 2.1% which is small enough to keep it switched on all the time. The automatic race detection is however very slow: it slows down the program execution about 30 times. Remember that the intrusion caused by this huge overhead does not alter the execution, as this is a replayed execution.
| program | segments with memory accesses | memory accesses | |||
|---|---|---|---|---|---|
| created | max. stored | compared | number | number/s | |
| cholesky | 13 983 | 1 915 (13.7%) | 968 154 | 121 316 077 | 168 168 |
| fft | 181 | 37 (20.5%) | 2 347 | 26 463 490 | 363 509 |
| LU | 1 285 | 42 (3.3%) | 18 891 | 56 068 996 | 388 020 |
| radix | 303 | 36 (11.9%) | 4 601 | 60 138 828 | 328 987 |
| ocean | 14 150 | 47 (0.3%) | 272 037 | 29 559 125 | 274 458 |
| raytrace | 97 598 | 62 (0.1%) | 337 743 | 48 711 612 | 72 069 |
| water-Nsq. | 637 | 48 (7.5%) | 7 717 | 80 262 966 | 249 652 |
| water-spat. | 639 | 45 (7.0%) | 7 962 | 80 726 645 | 311 927 |
| radiosity | 438 763 | 8 634 (2.0%) | 188 323 337 | 275 291 372 | 347 425 |
The cause of this huge overhead is explained in Table 2 where the number of segments and memory accesses is shown. Apparently, for most of the test programs, the execution of the instrumented memory operations is the critical speed factor. For these benchmarks, this is about 350 000 memory operations per second. Cholesky, raytrace and ocean do not reach that number, caused by the fact that a lot of segments are compared during the race detection. With regard to the number of segments stored, we see that the matrix clock algorithm indeed succeeds in substantially reducing the number of segments that have to be stored, limiting the memory consumption of the race detector.
| program | number of | size of | bandwidth | |
|---|---|---|---|---|
| sync. op. | trace file (b) | bytes/s | bits/op. | |
| cholesky | 13 857 | 1 132 | 127.5 | 0.65 |
| fft | 177 | 65 | 7.4 | 2.94 |
| LU | 1 275 | 134 | 20.9 | 0.84 |
| radix | 273 | 108 | 17.4 | 3.16 |
| ocean | 22 981 | 6 458 | 1 276.3 | 2.25 |
| raytrace | 150 960 | 41 416 | 4 064.4 | 2.19 |
| water-Nsq. | 631 | 336 | 34.6 | 4.26 |
| water-spat. | 625 | 332 | 39.9 | 4.25 |
| radiosity | 524 667 | 24 578 | 1 143.2 | 0.37 |
| average | 748.0 | 2.30 | ||
Table 3 shows why the overhead of recording an execution is limited to about 2%. This is because ROLT effectively succeeds in creating small trace files. The disk bandwidth needed to store the trace is never bigger than 4 kB/s, which is very low on modern machines. On the average, we only need to store about 2.3 bits per synchronisation operation.
5 Related Work
Although much theoretical work has been done in the field of data race detection [1, 15, 2, 27] few implementations for general systems have been proposed. Tools proposed in the past had limited capabilities: they were targeted at programs using one semaphore [11], programs using only post/wait synchronisation [16] or programs with nested fork-join parallelism [2, 14]. The tools that come closest to our data race detection mechanism, apart from [3] for a proprietary system, is an on-the-fly data race detection mechanism for the CVM (Concurrent Virtual Machine) system [19]. The tool only instruments the memory references to distributed shared data (about 1% of all references) and is unable to perform reference identification: it will return the variable that was involved in a data race, but not the instructions that are responsible for the reference.
Race Frontier [5] describes a similar technique as the one proposed in this paper (replaying up to the first data race). Choi and Min prove that it is possible to replay up to the first data race, and they describe how one can replay up to the race frontier. A problem they do not solve is how to efficiently find the race frontier. RecPlay effectively solves the problem of finding the race frontier, but goes beyond this. It also finds the cause of the data race.
Most of the previous work, and also our RecPlay tool, is based on Lamport’s happened-before relation. This relation is a partial order on all synchronisation events in a particular parallel execution. Therefore, by checking the ordering of all events and monitoring all memory accesses, data races can be detected for one particular program execution.
Another approach is taken by a more recent race detector: Eraser [26]. It goes slightly beyond work based on the happened-before relation. Eraser checks that a locking discipline is used to access shared variables: for each variable it keeps a list of locks that were held while accessing the variable. Each time a variable is accessed, the list attached to the variable is intersected with the list of locks currently held and the intersection is attached to the variable. If this list becomes empty, the locking discipline is violated, meaning that a data race occurred. Unfortunately, Eraser detects many false data races: as Eraser is not based on the happened-before relation it has no timing information whatsoever. For instance, in theory there is no need to synchronise shared variables before multiple threads are created. The happens-before relation deals in a natural way with the fact that threads cannot execute code ‘before’ they have been created but Eraser needs special heuristics to support these kind of unlocked accesses. The support for initialisation makes Eraser dependent on the scheduling order and therefore requires also the checking of all possible executions for each possible input.
The most important problem with Eraser is however that its practical applicability is limited as it can only process mutex synchronisation operations and the tool fails when other synchronisation primitives are built on top of these lock operations.
These problems with Eraser makes us believe that methods based on the happens-before relation (like RecPlay) are better. Contrary to Eraser, it can only detect data races that show up in a particular program run, but it is more general in that it knows how to deal with all common synchronisation operations. Furthermore, it is more reliable because it never reports false data races.
6 Conclusions
In this paper, we have presented RecPlay, a practical and effective tool for detecting data races in parallel executions. Therefore, we implemented a highly efficient two-level record/replay system that traces the synchronisation operations, and uses this trace to replay the execution. During replay, a race detection algorithm is run to notify the programmer when a race occurs. As such, synchronisation races are replayed while deta races are detected. Using snooped matrix clocks and multilevel bitmaps, we were able to limit the memory consumption. RecPlay works on running processes, and is therefore completely independent of any compiler or programming language. Moreover, recompiling or relinking the application is not required.
Acknowledgements
Michiel Ronsse is sponsored by a GOA project (12050895) from Ghent University. Koen De Bosschere is a research associate with the Fund for Scientific Research – Flanders.
References
- [1] S.V. Adve, M.D. Hill, and R.H.B. Netzer. Detecting data races on weak memory systems. In Proceedings of the 18th Annual Symposium on Computer Architectures, pages 234–243, May 1991.
- [2] K. Audenaert and L. Levrouw. Space efficient data race detection for parallel programs with series-parallel task graphs. In Proceedings of the third Euromicro Workshop on Parallel and Distributed Processing, pages 508–515, San Remo, January 1995. IEEE Computer Society Press.
- [3] Anton Beranek. Data race detection based on execution replay for parallel applications. In Proceedings of CONPAR ’92, pages 109–114, Lyon, France, September 1992.
- [4] G. Cavalheiro and M. Doreille. Athapascan: A C++ library for parallel programming. In Stratagem’96, Sophia Antipolis, France, June 1996. INRIA.
- [5] Jong-Deok Choi and Sang Lyul Min. Race frontier: Reproducing data races in parallel-program debugging. In Proc. of the Third ACM SIGPLAN Symposium on Principles & Practice of Parallel Programming, volume 26, pages 145–154, July 1991.
- [6] Koen De Bosschere and Michiel Ronsse. Clock snooping and its application in on-the-fly data race detection. In Proceedings of the 1997 International Symposium on Parallel Algorithms and Networks (I-SPAN’97), pages 324–330, Taipei, December 1997. IEEE Computer Society.
- [7] C. J. Fidge. Logical time in distributed computing systems. In IEEE Computer, volume 24, pages 28–33. August 1991.
- [8] Jason Gait. A probe effect in concurrent programs. Software - Practice and Experience, 16(3):225–233, March 1986.
- [9] Leslie Lamport. Time, clocks, and the ordering of events in a distributed system. Communications of the ACM, 21(7):558–565, July 1978.
- [10] Luk J. Levrouw, Koenraad M. Audenaert, and Jan M. Van Campenhout. A new trace and replay system for shared memory programs based on Lamport Clocks. In Proceedings of the Second Euromicro Workshop on Parallel and Distributed Processing, pages 471–478. IEEE Computer Society Press, January 1994.
- [11] H.I. Lu, P.N. Klein, and R.H.B. Netzer. Detecting race conditions in parallel programs that use one semaphore. Technical report, Brown University, 1993.
- [12] Hsueh-I Lu, Philip N. Klein, and Robert H. B. Netzer. Detecting race conditions in parallel programs that use one semaphore. Workshop on Algorithms and Data Structures (WADS), Montreal, August 1993.
- [13] Friedemann Mattern. Virtual time and global states of distributed systems. In Cosnard, Quinton, Raynal, and Roberts, editors, Proceedings of the Intl. Workshop on Parallel and Distributed Algorithms, pages 215–226. Elsevier Science Publishers B.V., North-Holland, 1989.
- [14] John M. Mellor-Crummey. On-the-fly detection of data races for programs with nested fork-join parallelism. In Proceedings of Supercomputing ’91, pages 24–33, November 1991.
- [15] R.H.B. Netzer and B.P. Miller. Improving the accuracy of data race detection. In Proceedings of the 1991 Conference on the Principles and Practice of Parallel Programming, April 1991.
- [16] Robert H. B. Netzer and Barton P. Miller. On the complexity of event ordering for shared-memory parallel program executions. International Conference on Parallel Processing, pages 93–97, August 1990.
- [17] Robert H.B. Netzer. Optimal tracing and replay for debugging shared-memory parallel programs. In Proceedings ACM/ONR Workshop on Parallel and Distributed Debugging, pages 1–11, May 1993.
- [18] Robert H.B. Netzer and Barton P. Miller. What are race conditions? some issues and formalizations. ACM Letters on Programming Languages and Systems, March 1992.
- [19] Dejan Perkovic and Peter J. Keleher. Online Data-Race Detection via Coherency Guarantees. pages 47–57, Seattle, October 1996. The Second Symposium on Operating Systems Design and Implementation (OSDI ’96) Proceedings.
- [20] Michel Raynal and Mukesh Singhal. Logical clocks: Capturing causality in distributed systems. IEEE Computer, pages 49–56, February 1996.
- [21] M. Ronsse and L. Levrouw. On the implementation of a replay mechanism. In L. Bouge, P. Fraigniaud, A. Mignotte, and Y. Robert, editors, Proceedings of EuroPar ‘96, volume 1123 of LNCS, pages 70–73. Springer-Verlag, Lyon, August 1996.
- [22] M. Ronsse, L. Levrouw, and K. Bastiaens. Efficient coding of execution-traces of parallel programs. In J. P. Veen, editor, Proceedings of the ProRISC / IEEE Benelux Workshop on Circuits, Systems and Signal Processing, pages 251–258. STW, Utrecht, March 1995.
- [23] Michiel Ronsse and Koen De Bosschere. JiTI: Tracing Memory References for Data Race Detection. In E. D’Hollander, F.J. Joubert, and U. Trottenberg, editors, Proceedings of ParCo97: Parallel Computing: Fundamentals, Applications and New Directions, volume 12 of Advances in Parallel Computing, pages 327–334, Bonn, February 1998. North Holland.
- [24] Michiel Ronsse and Koen De Bosschere. Recplay: A fully integrated practical record/replay system. ACM Transactions on Computer Systems, 17(2):133–152, May 1999.
- [25] S.K. Sarin and L. Lynch. Discarding obsolete information in a replicated data base system. In IEEE Transactions on Software Engineering, volume SE, pages 39–46. January 1987.
- [26] Stefan Savage, Michael Burrows, Greg Nelson, Patrick Sobalvarro, and Thomas Anderson. Eraser: A dynamic data race detector for multithreaded programs. ACM Transactions on Computer Systems, 15(4):391–411, November 1997.
- [27] Edith Schonberg. On-the-fly detection of access anomalies. Proceedings of the SIGPLAN ’89 Conference on Programming Language Design and Implementation, published in ACM SIGPLAN Notices, 24(7):285–297, July 1989.
- [28] SunSoft. lock_lint User’s Guide, 1994.
- [29] Steven Cameron Woo, Moriyosho Ohara, Evan Torrie, Jaswinder Pal Singh, and Anoop Gupta. The SPLASH-2 programs: Characterization and methodological considerations. In Proc. of the 22nd Annual International Symposium on Computer Architecture, pages 24–36, June 1995.
- [30] G.T.J. Wuu and A.J. Bernstein. Efficient solutions to the replicated log and dictionary problems. Proc. 3rd ACM Symp. Principles Distributed Computing, pages 233–242, New York, 1984. ACM Press.