LA-UR-00-2839
Geometric Morphology of Granular Materials
Abstract
We present a new method to transform the spectral pixel information of a micrograph into an affine geometric description, which allows us to analyze the morphology of granular materials. We use spectral and pulse-coupled neural network based segmentation techniques to generate blobs, and a newly developed algorithm to extract dilated contours. A constrained Delaunay tesselation of the contour points results in a triangular mesh. This mesh is the basic ingredient of the Chodal Axis Transform, which provides a morphological decomposition of shapes. Such decomposition allows for grain separation and the efficient computation of the statistical features of granular materials.
Keywords: image processing, pulse-coupled neural network, smoothing, segmentation, contour extraction, Delaunay triangulation, tesselation, chordal axis transform, skeleton, grain materials
1 INTRODUCTION
Mathematical morphology was born in 1964, when G. Matheron [1] was asked to investigate the relationships between the geometry of porous media and their permeabilities, and when at the same time J. Serra [2] was asked to quantify the petrography of iron ores, in order to predict their milling properties. This initial period (1964 – 1968) has resulted in a first body of theoretical notions. The notion of a geometrical structure, or texture, is not purely objective. It does not exist in the phenomenon itself, nor in the observer, but somewhere between the two. Mathematical morphology quantifies this intuition by introducing the concept of structuring elements. Chosen by the morphologist, they interact with the object under study, modifying its shape and reducing it to a sort of caricature which is more expressive than the actual initial phenomenon. The power of this approach, but also its difficulty, lies in this structural analysis.
In this paper, we are going to present a new method of structural analysis for images (micrographs) of granular materials to the immediate benefit of the field of micromechanics of materials. In this particular field of physics, hydrodynamic model calculations are performed to investigate the propagation of shockwaves through such heterogeneous media. To be specific, one needs to setup the calculations with very accurate initial conditions, e.g., distributions of grain sizes in case one is interested in the mechanical properties of granular materials. In our presentation we demonstrate how to prepare the micrographs for extraction of proper input statistics data by using low and high level image processing algorithms.
We perform image segmentation of a micrograph (original image and its smoothed version) by applying either pulse coupled neural networks (PCNN) [3] or a spectral segmentation. Contour extraction of the segmented blobs will be performed with a newly developed algorithm, which is highly parallel and therefore fast. The contours and its points form the input to the Chordal Axis Transform [4, 5] (CAT), which provides a morphological decomposition of grain shapes into simplicial chain complexes of limbs and torsos. This decomposition is used to perform geometric filtering operations such as grain separation based on grain morphology. Subsequent to such filtering, we explain how the metrical and statistical properties of the granular material can be efficiently computed to obtain input for the hydrodynamic model calculations.
 |
2 IMAGE PROCESSING
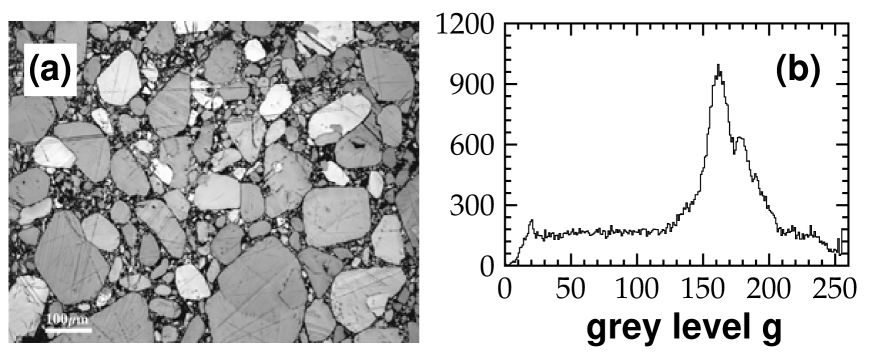
In this paper, we discuss the image analysis of a micrograph (cf. Fig. 1.a) of an explosive material, PBX 9501 (95% HMX and 5% polymeric binder, by weight). More images similar to the one shown in Fig. 1.a can be found in the paper by Skidmore [6] et al.
2.1 Image Segmentation and Image Smoothing
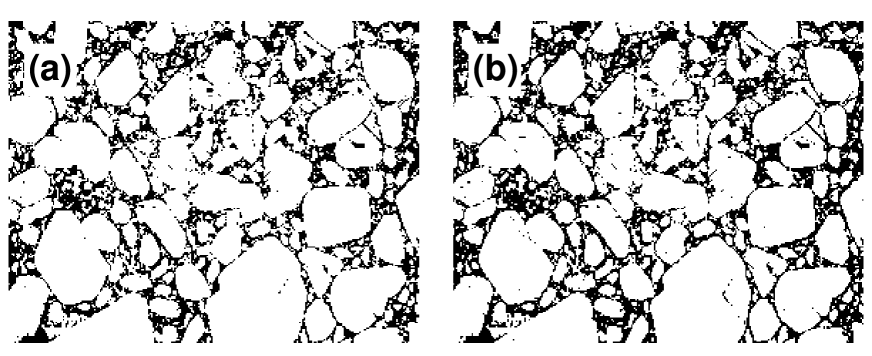
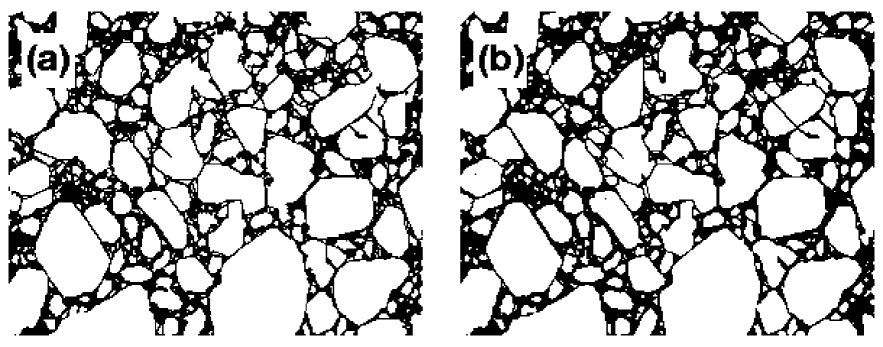
An image can in general be viewed as the spacial arrangement (positions) of pixels, which contain spectral information (such as grey-levels, etc.). In Fig 1.b we show the grey-level histogram of the explosive material, which is shown in Fig 1.a. We can identify the pixels, which have rather low grey-levels (dark) in the range of 0–100, with the polymeric binder, and the remaining pixels (light) with the HMX crystals (grains). If we assign to the binder pixels black pixels and to the grain pixels white pixels, respectively, then this spectral segmentation leads to the bi-level image shown in Fig. 3.a.
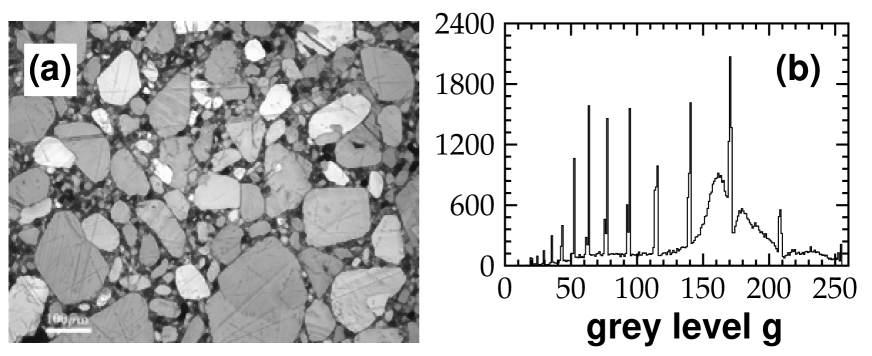
A more sophisticated way of performing image segmentation can be acchieved by applying a PCNN [3]. PCNN’s use, simultaneously, the spacial and spectral information content of an image for its segmentation into blobs. We have applied such a PCNN to Fig 1.a. The result is shown in Fig. 3.b (for more detail, cf. the paper by Skourikhine [3] et al.). In addition to segmentation, PCNN’s can also help to smooth an image, in order to suppress noise generated by the imager or to remove undesired texture. We have smoothed Fig. 1.a while using a PCNN. The resulting image
 |
 |
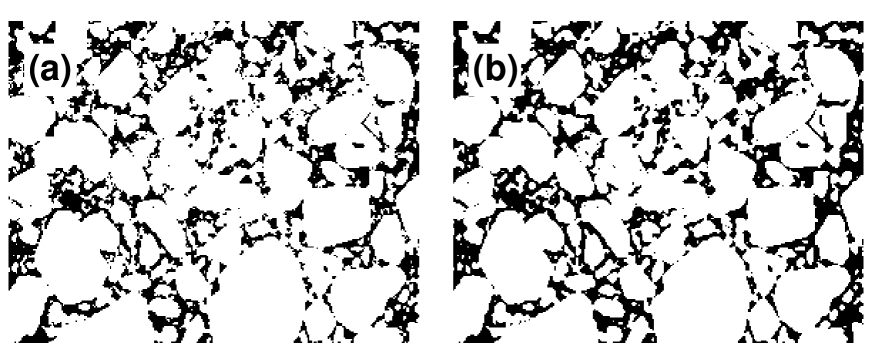
and its corresponding pixel grey-level histogram are displayed in Fig. 2. We would like to emphasize, that the application of a PCNN leads to smoothing without blurring the image [3]. In Fig. 4. we have applied spectral and PCNN segmentation, respectively, as described above to the smoothed image Fig. 2.a. In total we have generated four different segmented versions of the original image, where apparantly the level of pixel noise decreases when going from Fig. 3.b over Fig. 3.a and Fig. 4.a to Fig. 4.b. In the following, we shall use the four segmented images for their further morphological analysis. This section also demonstrates, that image analysis is not purely objective, as we indicated in the introduction.
2.2 Contour Extraction
The next step after the image segmentation is the contour extraction of the blobs. For the material science application under consideration we desire blob contours, which are nondegenerate, i.e., they always enclose an area larger than zero, and they never cross or overlap each other. Furthermore, the contours should be oriented with respect to the objects and their possible holes.
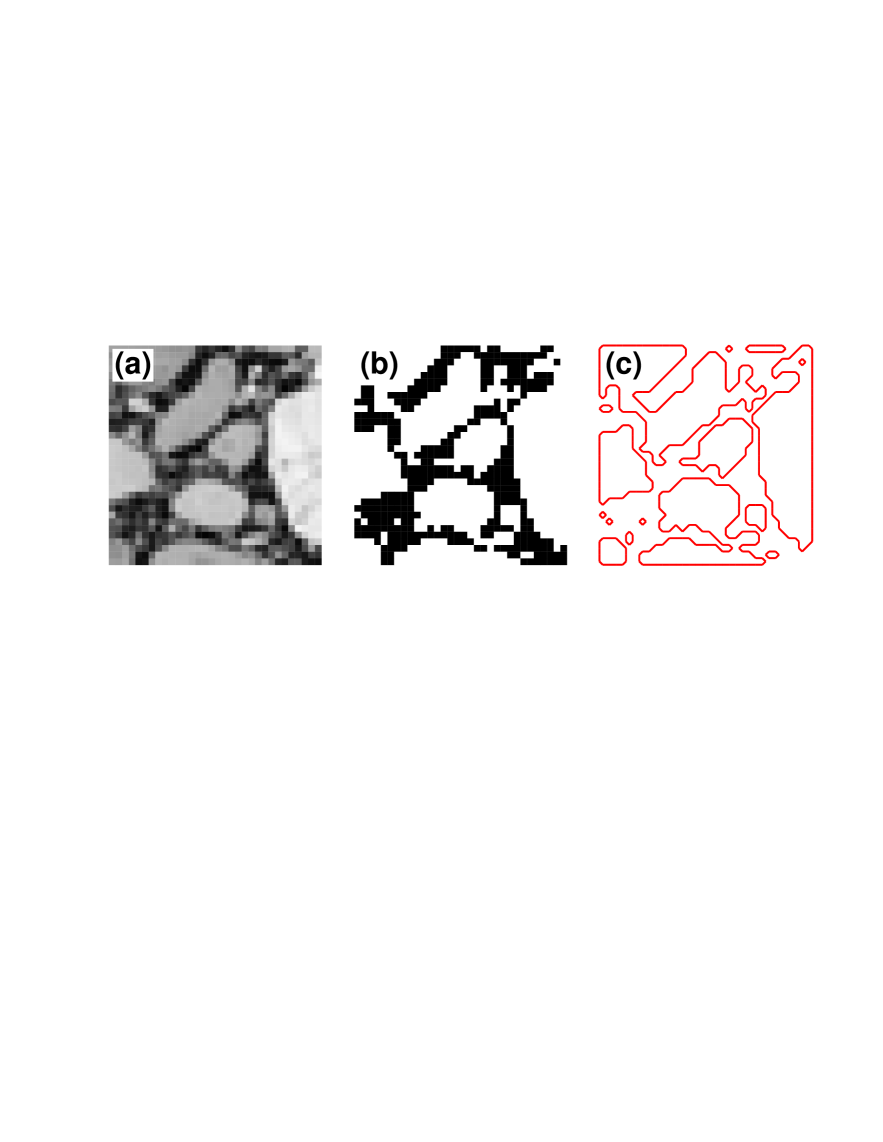
In Fig. 5.a we show for the sake of illustration a cropped subimage of Fig. 1.a with increased magnification. In Fig. 5.b we have applied a spectral segmentation of the pixels grey-levels as described in the previous section. Finally, Fig. 5.c shows the dilated contours as generated by the algorithm [7], which is described in the paper by Schlei et al. [8] and which fulfills all of the above stated requirements for the contours.
 |
 |
2.3 Constrained Delaunay Tesselation and Chordal Axis Transform
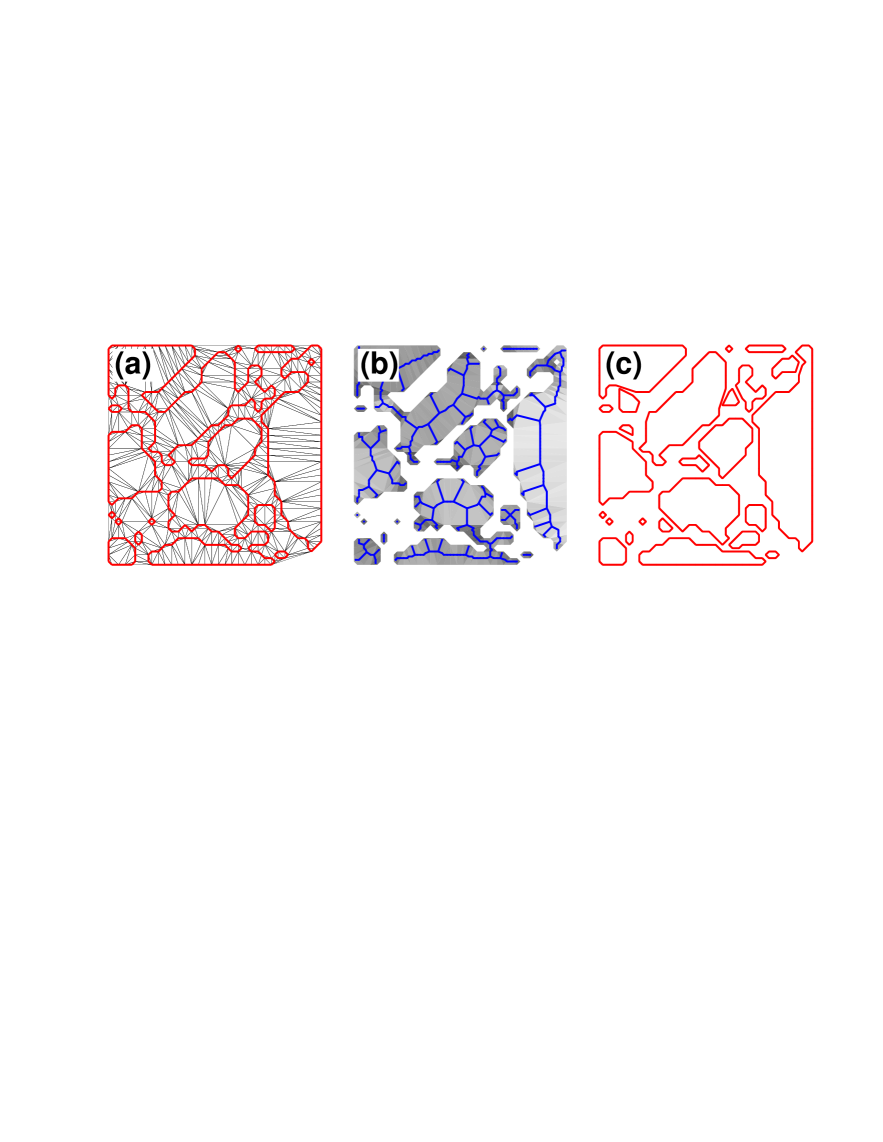
The Constrained Delaunay Tesselation (CDT) of a simple planar polygon (contour) is a decomposition of a polygon into triangles, such that the circumcircle of each triangle contains no vertex of the polygon inside it that is simultaneously visible to two vertices of the triangle [4]. Note, that the CDT of the contours is the key step that allows for the shape feature extraction. In Fig. 6.a we transform through the CDT the spectral pixel information of our given micrograph into an affine geometric description. As a next step we use the pointset of the dilated oriented contours and the generated triangular mesh with its neighbor information of the triangles to compute the CAT skeleton [4, 5] of the grains (cf. Fig. 6.b). Each arc of the skeleton represents a simplical chain complex of either a limb or a torso, respectively. A limb is a chain complex of pairwise adjacent triangles, which begins with a junction triangle and ends with a termination triangle. A torso is a chain complex of pairwise adjacent triangles, which begins and ends with a junction triangle[4, 5].
2.4 Grain Separation
In the micrograph (cf. Fig. 1.a) many grains might be very close to each other spatially such that they are connected through a single CAT skeleton. This is not satisfactory, if one wants to use the CAT skeleton directly for the computation of material statistics, because the number of grains is unequal to the number of skeletons. If we compute for each CDT triangle the average grey level of the pixels which are covered by it, we obtain Fig. 6.b. For each given torso of the CAT we can investigate the fluctuation of grey levels for its simplical chain complex. If two grains are connected in the CAT skeleton through a torso, we would expect a larger grey level fluctuation compared to the case, where a torso would be located within a single grain. In the following, we have used a threshold of 30
 |
 |
(among 256 grey levels) for cutting a torso, thus leading to grain separation. In Fig. 6.c we show the resulting refined grain contours. We note, that it is neccessary for the shape manipulation to use the unpruned CAT skeleton.
2.5 Material Statistics
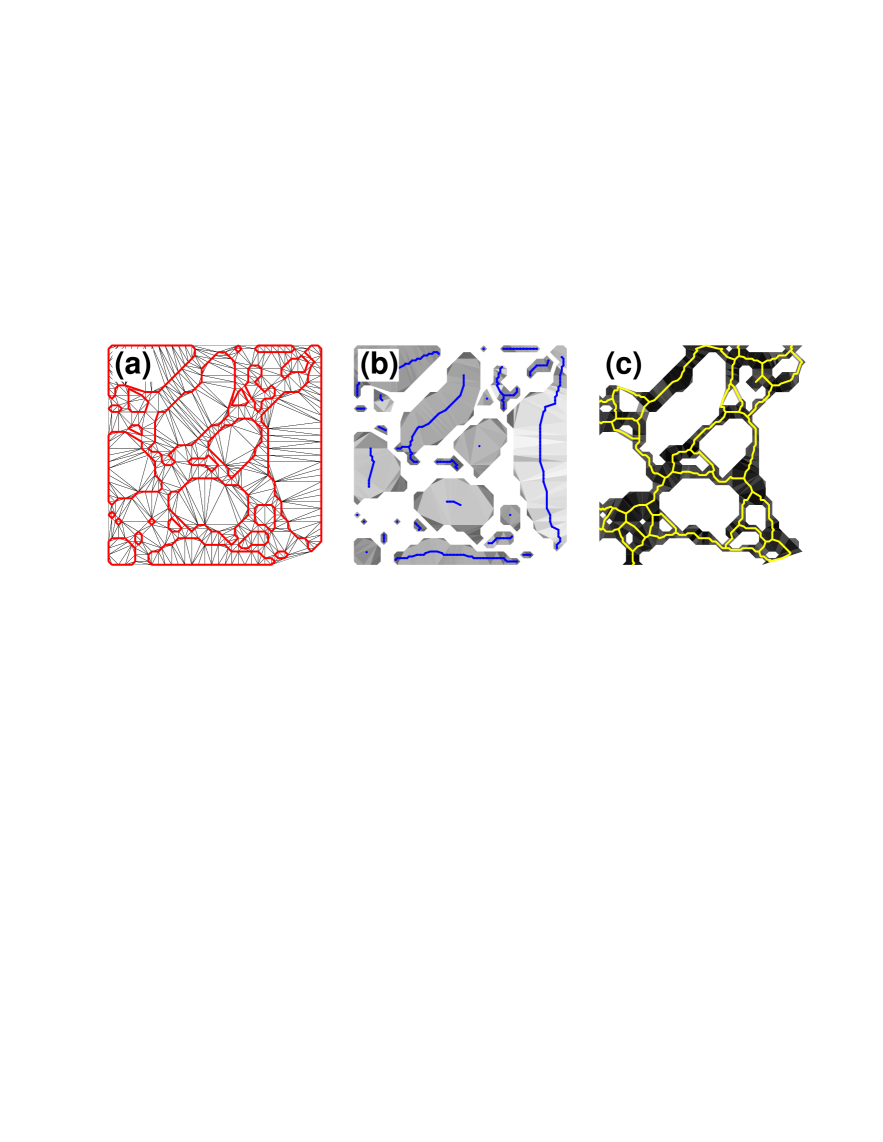
After the grain separation it is in general neccessary to generate a new CDT of the refined contours (cf. Fig. 7.a). In the subsequent CAT our computer code [9] generates a connectivity hierarchy of the triangular chain complexes, which allows the efficient pruning of morphologically insignificant shape features. The results are the pruned skeleton for grains (cf. Fig. 7.b) and the pruned skeleton for the polymeric binder (cf. Fig. 7.c). We note, that the CAT skeleton of a grain can be sometimes pruned to a single point. After pruning, each connected arc of the attributed CAT skeletons can be regarded as the axis of a single particle (grain or binder particle). This allows for the computation of area, length, width, location, orientation, etc. for each particle. In case of present holes in a single HMX grain we even are able to remove them through the knowledge of the morphology of a single grains CAT skeleton. Of course, this requires a third application of CDT and CAT, respectively.
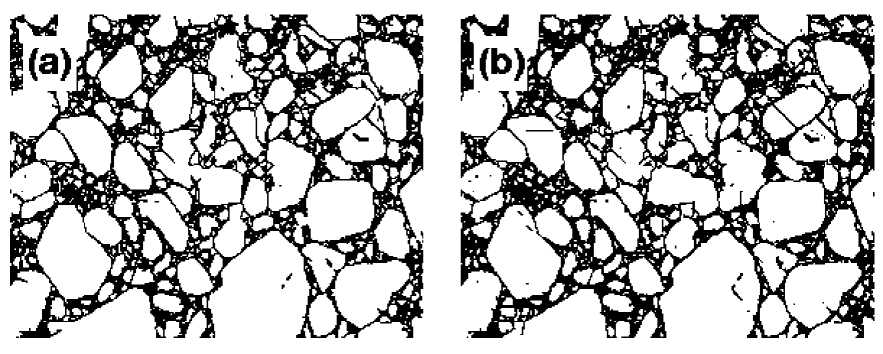
Figs. 8. and 9. show the processed images for Figs. 3 and 4. E.g., we find the following grain numbers when going from Fig. 8.a over Fig. 8.b and Fig. 9.a to Fig. 9.b: 912, 919, 624, and 534. Correspondingly, the two-dimensional HMX crystal percentages are: 75%, 72%, 74%, and 71%. Obviously, although the ratio between grains and polymer binder are more or less insensitive to the choice of image segmentation, there are apparently significant differences in
 |
 |
the grain numbers. Further experimental analysis should help to determine, which image segmentation is the most favorable for the computer vision micrograph analysis of explosive materials such as the PBX 9501 considered here.
3 SUMMARY
In summary, we have presented a method of image decomposition for micrographs into meaningful parts such as single HMX and binder grains. We have demonstrated that our algorithms are capable of grain separation and the efficient computation of statistical features of granular materials.
ACKNOWLEDGMENTS
This work has been supported by the Department of Energy.
References
- [1] G. Matheron, “Les variables régionalisées et leur estimation”, Doctorate thesis, Appl. Sci., Masson, Paris, 1965.
- [2] J. Serra, “L’analyse des textures par la géométrie aléatoire”, Compte-rendu du Comité Scientifique de l’IRSID, 1965.
- [3] A. N. Skourikhine, L. Prasad, B. R. Schlei, “A neural network for image segmentation”, in Mathematical Imaging, Proc. of SPIE’s 45th Annual International Symposium, San Diego, CA, SPIE Vol. 4120, 2000.
- [4] L. Prasad, “Morphological Analysis of Shapes”, CNLS Newsletter, No. 139, LALP-97-010-139, Center for Nonlinear Studies, Los Alamos National Laboratory, July ‘97.
- [5] L. Prasad, R. Rao, “A Geometric Transform for Shape Feature Extraction”, in Mathematical Imaging, Proc. of SPIE’s 45th Annual International Symposium, San Diego, CA, SPIE Vol. 4117, 2000.
- [6] C. B. Skidmore, D. S. Phillips, N. B. Crane, “Microscopical Examination of Plastic-Bonded Explosives”, Microscope, 45(4), pp. 127–136, 1997.
- [7] B. R. Schlei, ”DICONEX – Dilated Contour Extraction Code, Version 1.0”, Los Alamos Computer Code LA-CC-00-30, Los Alamos National Laboratory, 2000; for more detail check the website http://www.nis.lanl.gov/bschlei/eprint.html.
- [8] B. R. Schlei, L. Prasad, ”A Parallel Algorithm for Dilated Contour Extraction from Bilevel Images”, Los Alamos Preprint LA-UR-00-309, Los Alamos National Laboratory, cs.CV/0001024, 2000.
- [9] B. R. Schlei, ”GEOFILT – Geometric Filtering Code, Version 1.0”, Los Alamos Computer Code LA-CC-00-31, Los Alamos National Laboratory, 2000; for more detail check the website http://www.nis.lanl.gov/bschlei/eprint.html.