Energy Spectrum of Spin Fluctuations in Superconducting La2-xSrxCuO4 ()
Abstract
The energy spectrum of incommensurate spin
fluctuations in superconducting Sr-doped La2CuO4 has been
studied by inelastic neutron scattering experiments. An energy gap in
the spin excitation spectrum is observed in the superconducting state
of optimally doped (x=0.15) and slightly overdoped (x=0.18)
samples. At temperatures well below Tc, the incommensurate peaks
diminish rapidly in intensity with decreasing energy below 8meV and
merge into the background below 3.5meV for x=0.15 and 4.5meV
for x=0.18. For
both samples, the energy spectrum of the q-integrated spin susceptibility,
, exhibits an enhancement around 7meV, which is caused by a
broadening
in the momentum width of the incommensurate peaks. The gap-like structure in
the energy spectrum and the enhancement of
survive at Tc. On the other hand, for both underdoped
(x=0.10) and heavily overdoped
(x=0.25) samples there is neither a clear energy gap nor an
enhancement of below Tc.
KEYWORDS: La2-xSrxCuO4, high-Tc superconductor, spin fluctuation,
neutron scattering
I Introduction
The interplay between magnetism and superconductivity is one of the most interesting and important issues in the physics of the cuprate high temperature superconductors [1]. For more than ten years, experimental studies on the spin fluctuations in these materials have been performed by neutron scattering and NMR measurements. NMR first revealed a suppression of the low-energy spin excitations below what is called the spin gap temperature [2]. In the underdoped region, it is thought that above Tc a pseudo-gap opens up in the spin fluctuation spectrum. Since the spin-gap state is believed to be related to the pairing mechanism, a large number of experimental and theoretical studies have focused on the origin of the spin gap.
Unlike NMR, neutron scattering can determine both the momentum and the energy dependence of the magnetic excitations, providing information about the anisotropy of the energy gap of the high-Tc cuprates. In fact, neutron scattering has been used to observe the spin-gap of YBa2Cu3O7-y by determining the energy spectrum of the dynamical spin susceptibility around as a function of T [3,4,5]. However, the energy spectrum of the spin fluctuations and its doping dependence in La2-xSrxCuO4 have not yet been determined over a wide range of x, most especially for x above the optimal doping value. This is in part because it is difficult to separate the weak magnetic signals from the non-magnetic background originating from phonons for example. Further, it is difficult to grow large homogeneous single crystals over a wide doping region.
Several years ago an overview of the low energy spectrum of associated with the incommensurate peaks of La1.85Sr0.15CuO4 was presented [6]. Shortly thereafter, a well-defined energy gap of 3.5meV was observed in the superconducting state of the optimally Sr-doped La2CuO4 [7]. The latter measurements were limited to low energies 6meV. For higher energies, pulsed neutron scattering measurements were performed on La1.85Sr0.15CuO4 and revealed a broad peak between and 70meV [8] in . The dynamical spin susceptibility was integrated over q around the incommensurate peaks. This result was recently reconfirmed by more comprehensive experiments and analysis on the same crystals [9].
However, Hayden et al. [10] reported a somewhat sharper peak in the energy spectrum of at around meV in La1.86Sr0.14CuO4 by combining data taken by pulsed neutron scattering with that of 3-axis neutron spectroscopy. Furthermore, the latter group studied the energy and temperature dependence of using the same crystal and suggested that they were observing the effects of a nearby quantum critical point at T=0 K. They reported that the q-width of the spin fluctuations monotonically increased with increases in either temperature or energy [11] although their observed correlation length at low temperatures was in fact quite short in apparent contradiction with the quantum critical interpretation. They found no evidence for a gap in the spin fluctuation spectrum above Tc, in conflict with NMR measurements [12].
To reconcile these apparent inconsistencies a more systematic neutron scattering study is required. In particular, it is important to measure the doping dependence of the energy spectrum over a wide doping region. To accomplish this we have grown large single crystals of superconducting Sr-doped La2CuO4 over a wide range of Sr concentrations extending from the underdoped to the highly overdoped region. Although the energy region in the present study is still limited to that of conventional low energy 3-axis neutron scattering measurements, the doping dependence provides new insights into the spectrum of the spin fluctuations in this system. We describe the experimental details in section II, the results and data analysis are presented in section III, a discussion is given in section IV and a brief summary is presented in section V.
II Experimental Detail
Single crystals of La2-xSrxCuO4 have been grown by the traveling solvent floating zone (TSFZ) method using lamp-image furnaces [13,14]. The furnaces have been improved in order to tune the temperature gradient near the molten zone. We have found that a steep temperature gradient around the liquid allows us to grow homogeneous large single crystals. As-grown single crystals have been kept under oxygen flow at C for 50 hours to remove oxygen defects.
To characterize the Sr content and homogeneity we determined the phase transition temperature (Ts) between the high temperature tetragonal (HTT) and the low temperature orthorhombic (LTO) phases by neutron diffraction. The values for Ts of our single crystals [15] agree quite well with those previously deduced from powder data [16,17,18]. Ts depends primarily on the Sr concentration and specifically a small amount of oxygen non-stoichiometry does not change Ts appreciably [19,20]. Therefore, the agreement of the measured Ts for our single crystals with the results obtained from measurements on powders confirms the Sr concentration of our single crystals. The values of the Sr concentration measured by electron probe microanalysis were also consistent with the results from the Ts measurements within the instrumental resolution.
Superconducting magnetic shielding effects were measured by a SQUID magnetometer in a magnetic field of 10 . The onset temperature of the superconducting transition (Tc) in the single crystal, Tc=37.5K, is almost the same as the maximum value found in powder samples [18,21]. For and 0.25 the values of Tc = 29K, 36.5K and 15K, respectively, also agree with those of powder samples [15]. Since Tc is very sensitive to any deviation from stoichiometry in the oxygen concentration [20,22], this agreement suggests that the oxygen content and ordering of our crystals is nearly optimal.
Normal state magnetic susceptibilities were also measured using a SQUID magnetometer with a magnetic field of 1T. We observed a broad peak at a temperature Tmax=200K for x=0.18 which depends on both the Sr and the oxygen concentration [22]. Tmax of the single crystal is in good agreement with that of a powder sample with the same Sr concentration [22, 23, 24]. Lattice parameters of pulverized single crystals measured by x-ray diffraction at room temperature are also consistent with previous data [15].
Inelastic neutron scattering measurements were performed with the triple-axis spectrometer, TOPAN at JRR-3M in the Tokai Establishment of JAERI for crystals with x=0.15, 0.18, and 0.25 and with H7 at the HFBR at Brookhaven National Laboratory for crystals with and 0.15. The incident (final) neutron energy was typically fixed at Ei (Ef) = 14.75meV for TOPAN and Ei (Ef) = 14.7meV for H7. A typical sequence of the horizontal collimators was 40’-100’-S-60’-B for TOPAN and 40’-40’-S-80’-80’ for H7 where S denotes the sample position. Pyrolytic graphite crystals were used both as monochromator and analyzer. A pyrolytic graphite filter was used to reduce the intensity of higher order neutrons. Moreover, in TOPAN, a sapphire crystal was inserted to reduce significantly the flux of high energy neutrons. The single crystals were mounted in an Al container filled with He gas as a heat exchanger. For cooling, a closed cycle He refrigerator was used.
III Results
The four panels in Fig. 1 show representative q-spectra of the magnetic fluctuations measured at and below Tc. Constant-energy scans were performed through the two peaks at () as illustrated in the inset of panel (c). For , due to some
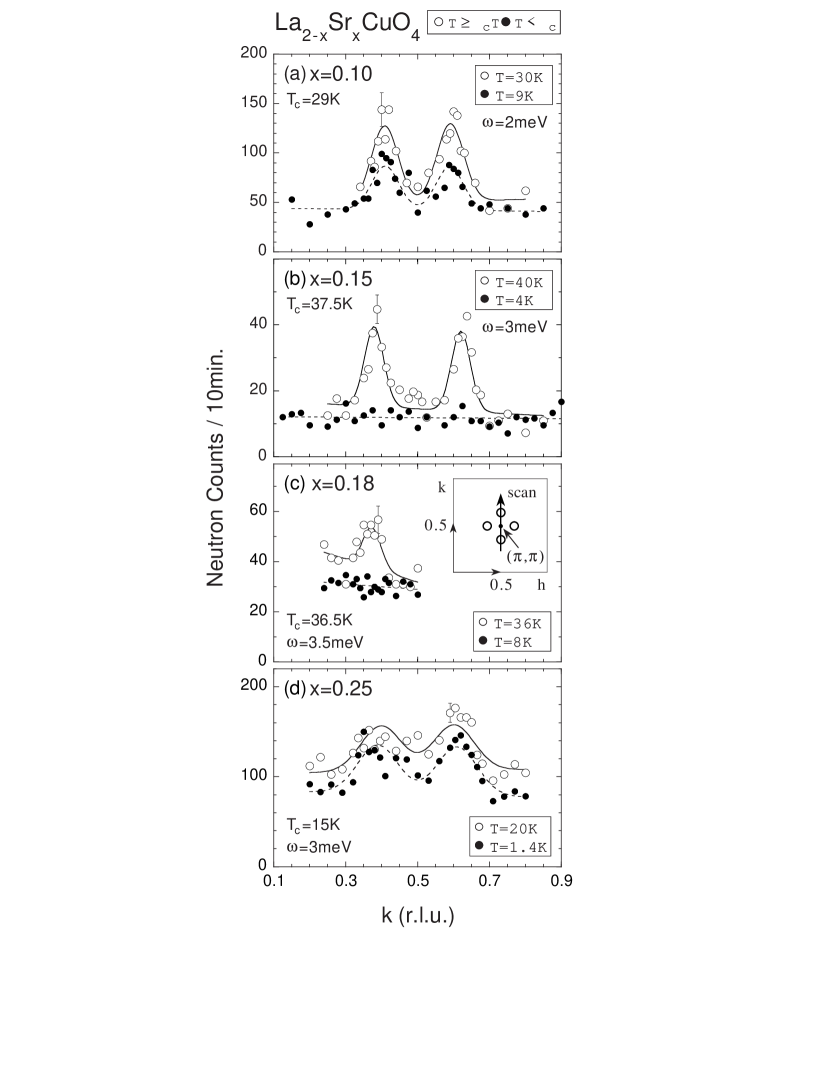
non-magnetic contamination in the scan, we present only one of the peaks, at (). For T Tc well-defined peaks are observed at incommensurate positions for all samples. Below Tc, the peaks at 3 meV and 3.5 meV vanish into the background for and 0.18 respectively. As is shown by the energy spectra discussed below, this dramatic change occurs due to the opening of an energy gap in the spin excitation spectrum at the same temperature as that for the onset of superconductivity. In contrast, for and 0.25 substantial peak intensities at low energies are observed even at temperatures well below Tc
We present the results of the same q-scan as that shown in Fig. 1 at several different energies for x=0.10 and 0.15 in Figs. 2 and 3
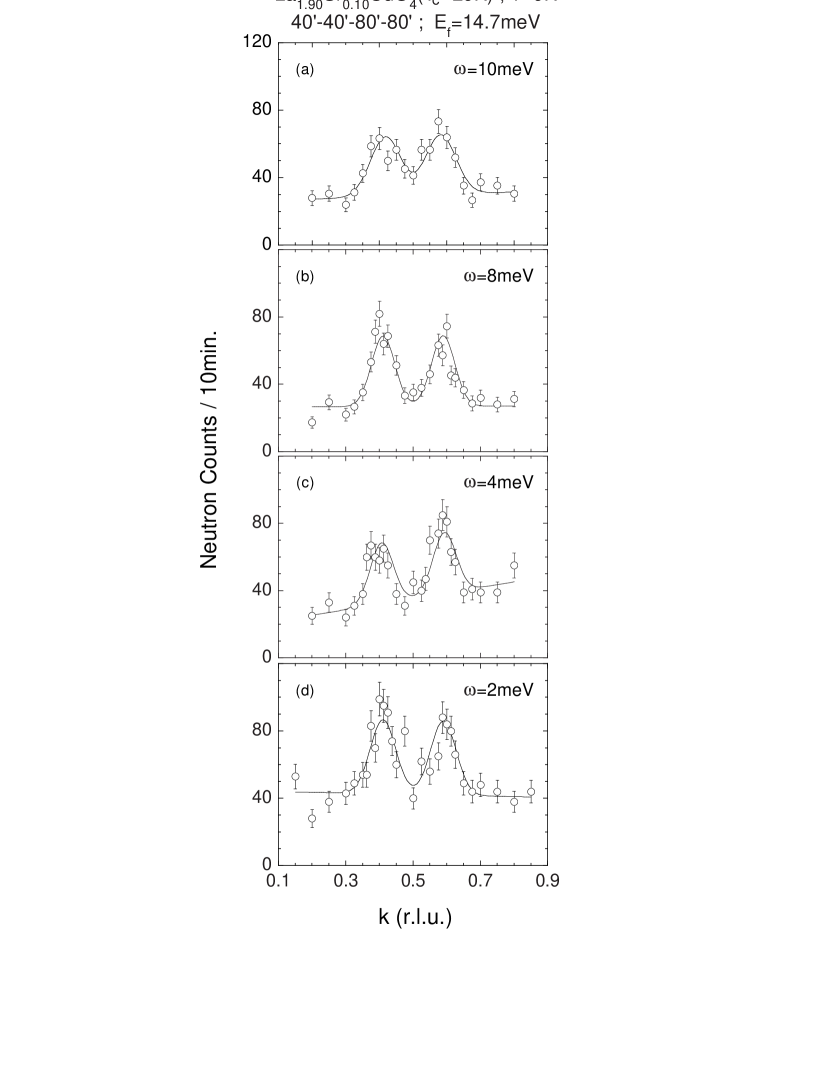
respectively. Below Tc, the peak intensities for x=0.10 are comparable at all energies between 2 and 10 meV. On the other hand, for x=0.15 the intensities dramatically decrease with decreasing energy and no peak remains outside of the errors at 3 meV. Although our collaboration has reported the observation of an energy gap for
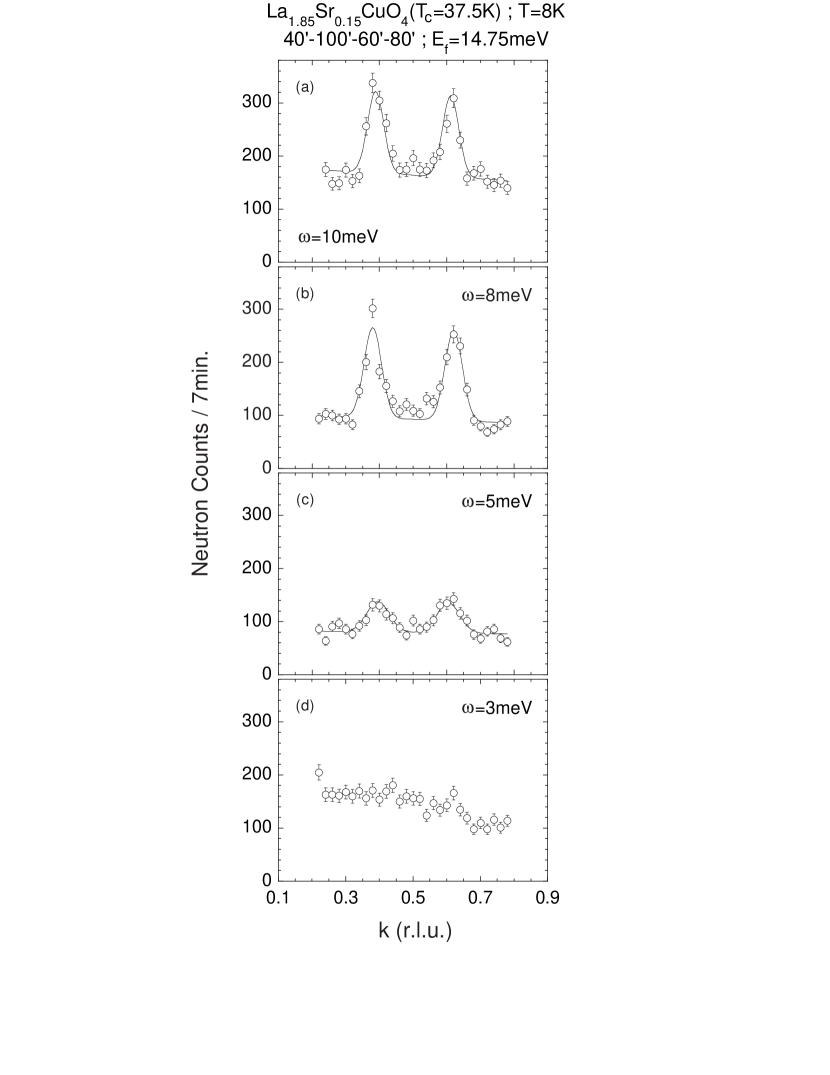
x=0.15 previously [7] the change in peak intensities below 7 meV appears to be more dramatic in these experiments. A similar energy dependence of the incommensurate peak intensity is found for x=0.18 as shown in Fig. 4(c).
The q-spectrum of the incommensurate peaks was fitted using the following dynamical structure factor S(q,) convoluted with the instrumental resolution function:
| (1) |
with
| (2) |
where and are the peak positions of the magnetic peaks around , the q-width at a given , the Boltzman constant and an overall scale factor, respectively. is assumed to be isotropic in the Cu plane.
The imaginary part of the q-integrated dynamical susceptibility averaged over the Brillouin zone is defined as:
| (3) |
Note that in this case, the q-integration is carried out for the four incommensurate peaks around over the Brillouin zone.
In Fig. 4, we show the energy-dependence of the peak intensities at the incommensurate positions for and 0.25 together with the resolution-corrected , which is obtained by fitting the q-spectrum
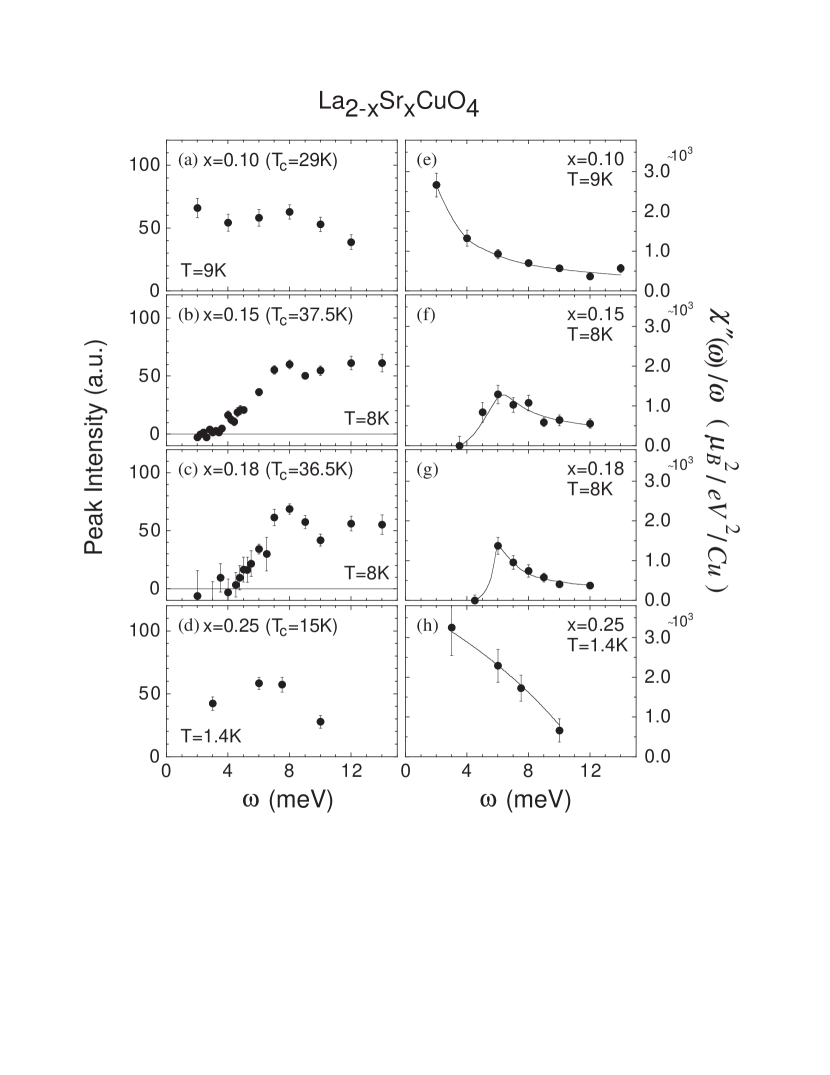
and integrating over q for the four incommensurate peaks around . The absolute value of for each sample was calculated by using phonon intensities for the same sample as described in the Appendix. We present instead of to reveal any gap structure in the spectrum because the latter quantity may go to zero as the energy approaches zero even if there is no gap. Fig. 4 again exhibits two types of energy dependencies for the incommensurate peaks for the four samples. There exists a well-defined energy gap for and 0.18, accompanied by an enhancement of around 6 meV to 7 meV while no gap-like structure is seen for and 0.25.
The energy dependence of the resolution-corrected q-width of the incommensurate peak below Tc is shown in Fig. 5. We
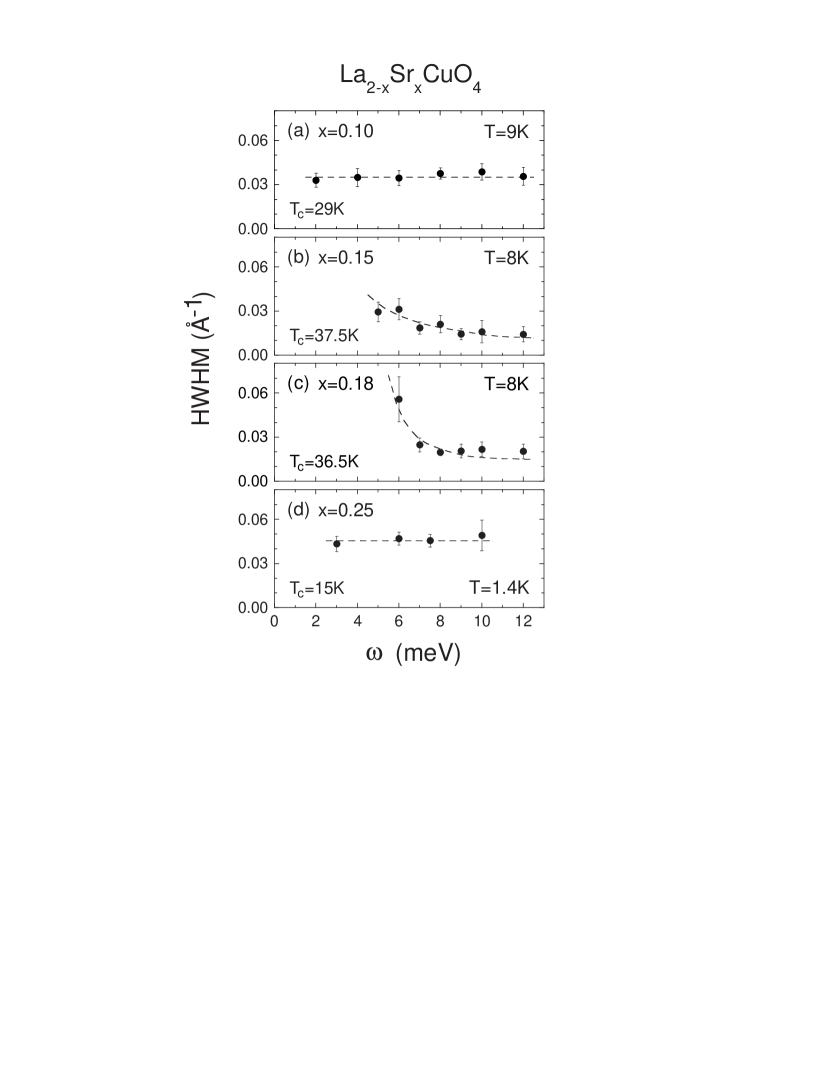
only show the data above 5 and 6 meV for and 0.18, respectively because of the energy gap. We note that the q-width has a rather different dependence depending on whether or not there is a gap. For the gapped samples, above the gap energy the q-width is small and it increases with decreasing energy as the gap energy is approached. Furthermore, as will be shown later in Fig. 8, for T Tc the q-width appears to exhibit a peak for excitation energies near the gap energy. On the other hand, for the gapless samples the q-width is constant with energy at least up to 12 meV.
Next, we show for temperatures TTc for crystals with x=0.15 and 0.18 in Fig. 6. Although the peak in the intensity appears at slightly
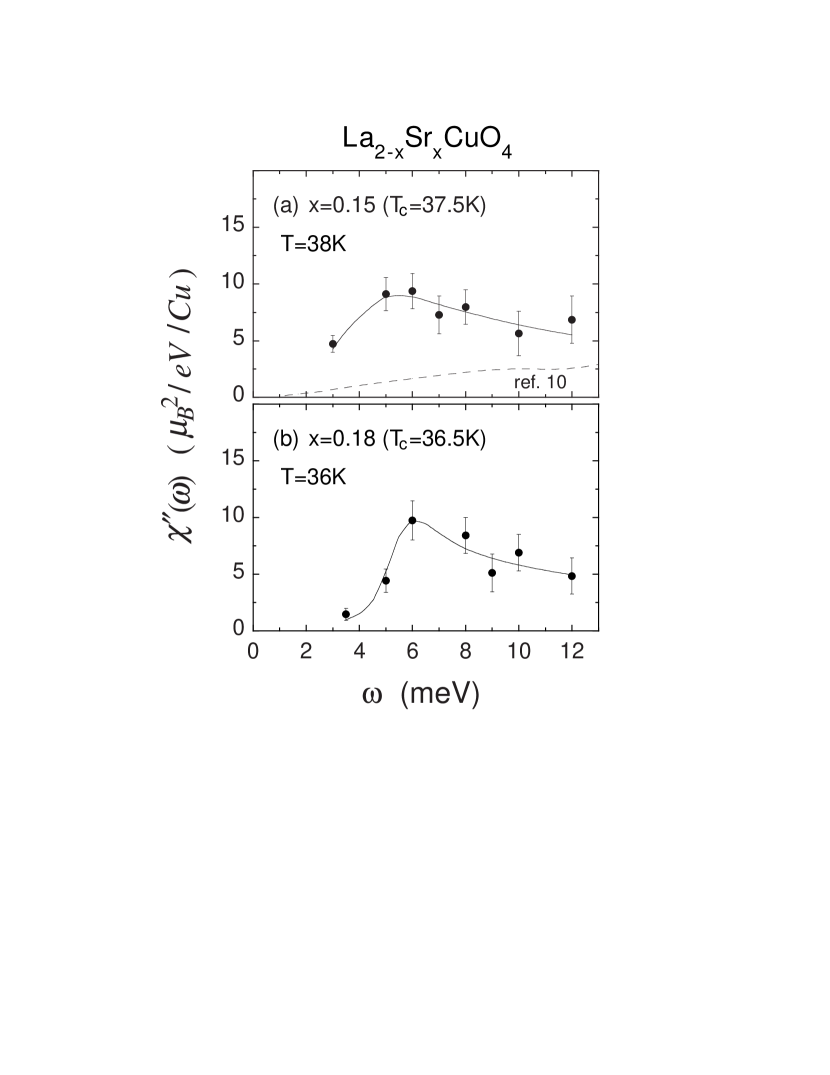
lower energies compared to the data below Tc, a gap-like structure and an enhancement in still remains. In the upper panel of Fig. 6, we show using a dashed line the data obtained by Hayden et al. for the same system with x=0.14 [10]. No peak in is observed in their data. As shown in Fig. 7, for
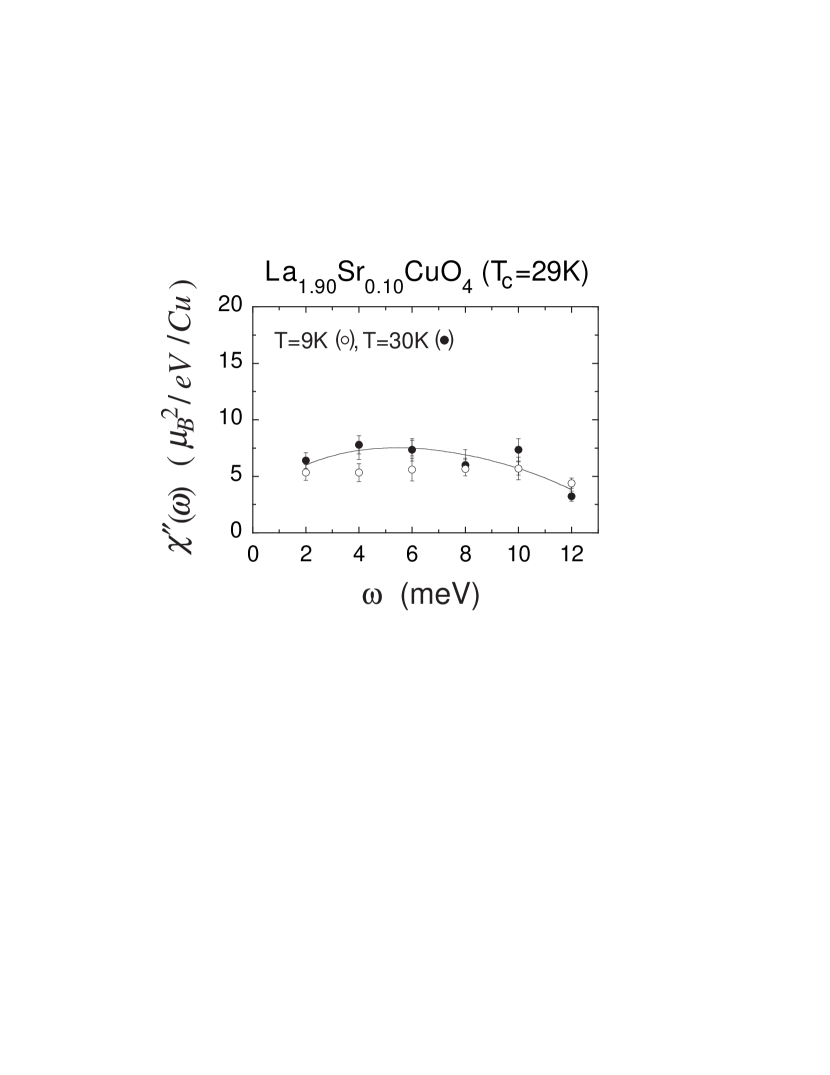
the gapless sample of with x=0.10, both the energy and temperature variation of is weak, although we see a slight suppression of around 4 to 6 meV at T=9K.
In Fig. 8 we show the energy variation of the q-width of the incommensurate peak for TTc for x=0.15 and in the inset for x=0.18. In the figure, we have plotted results from several different crystals. We observe a peak in the q-width at around the same energy as that at which the enhancement of is observed. In
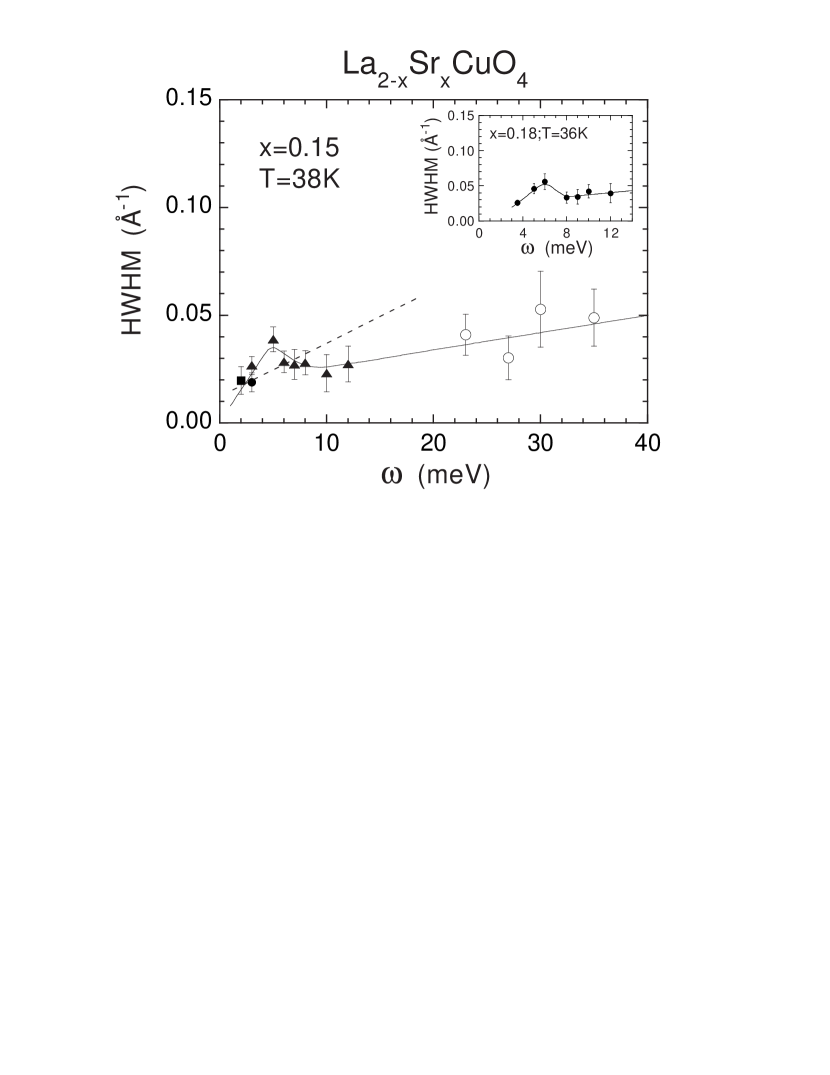
contrast, the energy variation of the q-width for the sample with x=0.14 of Aeppli et al. [11] shows a linear energy dependence. It should be noted that the peak width for energies of order 8 to 10 meV is substantially narrower below Tc than that at Tc for the gapped samples, particularly for x=0.18.
IV Discussion
The present study has revealed two types of energy spectra for the spin fluctuations in Sr-doped superconducting La2CuO4. For and 0.18, a well-defined energy gap appears below Tc, whereas for the underdoped sample, , and highly overdoped sample, x=0.25, no gap is observed even though they exhibit bulk superconductivity with Tc =29K for and Tc=15K for x=0.25.
In order to discuss the results shown in Figure 4 quantitatively, we introduce a phenomenological dynamical spin susceptibility of the form:
| (4) |
This corresponds to Lorentzian spin fluctuations in the normal state multiplied by a gap-function in the superconducting state. The gap function includes the gap-energy together with a broadening ; is the inverse of lifetime of the spin fluctuations. The parameters B, and are assumed to be constant in the q-region of the incommensurate peaks. It should be noted that in Eq. (4), is a simple Lorentzian in energy for . On the other hand, in the superconducting state, Eq. (4) describes the gap-structure with a non-zero value of . As required, the above dynamical spin susceptibility satisfies detailed balance for the dynamical structure factor S(q, ).
The observed energy spectra were fitted using Eq. (4) convoluted with the instrumental energy resolution. The value of so-obtained is meV for both x=0.15 and 0.18 while meV for x=0.15 and meV for x=0.18. Quite recently, Lake et al. reported a similar value for the energy-gap for a sample of with x=0.16 [25]. We note that is significantly larger than the value previously quoted by our collaboration which was around 3.5 meV for x=0.15 [7]. However, this latter value for the energy-gap was simply the energy below which the magnetic intensity disappeared entirely below Tc. This energy is naturally less than our fitted value simply due to the non-zero broadening of the gap-structure for x=0.15 together with the effects of instrumental resolution. We note that for samples with x=0.14 and 0.16, Lake et al. [25] find = 1.2 meV and 0.1 meV respectively albeit using a somewhat different functional form than Eq. (4). Thus, decreases smoothly with increasing x reaching 0 within the errors for x=0.18 while the gap energy appears to be independent of x for x between 0.14 and 0.18.
In Ref. 6 the gap-energy, of the spin fluctuations at the incommensurate peak position was converted into the value at (,0) by assuming a d(x2-y2)-type q-dependence. The previous value 3.5 meV implied a full gap of 10 meV which is consistent with the full superconducting gap of 8 meV inferred from photoemission spectroscopy [26]. However, the new value of determined here implies a full gap of 18 meV which corresponds to which seems too high compared with the BCS weak coupling value of 1.77 kTc. This fact, therefore, suggests that may not be simply related to the superconducting gap. It is possible that instead relates to the so-called pseudo-gap or the larger energy gaps reported by photoemission and tunneling spectroscopies.
The gapped samples exhibit an anomalous broadening in the q-width of the incommensurate peaks for energies around the gap value of . Qualitatively, we can interpret the peak-broadening as arising from the energy independent dispersion surface of the quasiparticle excitations around the energy-gap. In other words, if the magnetic scattering occurs through interband excitations of quasiparticles, the momentum change can be widely distributed for excitation energies close to the gap. As shown in Fig. 8, a broadening in q of the peak width for energies of order is observed at Tc which again indicates the robustness of the gap structure of for the gapped samples.
We discuss next the possible reasons for the absence of an energy-gap in the gapless samples with x=0.10 and x=0.25. At present, it is widely speculated without any direct experimental evidence that the disorder introduced by dopant substitution at the La-sites degrades the lifetime of the quasiparticles and smears out the gap structure. However, this is contradicted by the fact that no gap is observed in either stage-6 or stage-4 in spite of the fact that structural disorder is minimal in these systems [27,28]. Further, neutron scattering experiments on the Y1-2-3 system reveal the robustness of the magnetic energy-gap against Zn-impurities [29,30]. In the Zn-doped Y1-2-3 system, although low energy spin fluctuations appear at low temperatures, the gap-like or pseudo-gap structure appears at higher temperatures.
For the x=0.10 sample, the low energy spin excitations are simply explained as originating from the spin wave excitations concomitant with the elastic magnetic order which occurs in the superconducting state. Such order is observed for all x between 0.02 and 0.135 in . However, a different explanation is required for the highly overdoped gapless sample, x=0.25, because in that case there is no evidence for magnetic order coexisting with the superconductivity. Here, we simply point out that there is a dramatic degradation of the spacial coherence of the spin correlations in the overdoped region particularly near the upper critical doping value for the superconductivity as pointed out by Yamada et al. [15]. In this doping region, the spatial coherence length for the low energy spin fluctuations becomes comparable to or shorter than the superconducting coherence length. Therefore, the energy gap in this region is probably vitiated by the degradation of the lifetime of quasiparticles due to the short ranged spin fluctuations.
V Summary
We have studied the energy dependence of the spin fluctuations for superconducting La2-xSrxCuO4 (=0.10, 0.15, 0.18, 0.25) using neutron inelastic scattering. Below Tc a well-defined energy gap in the incommensurate spin fluctuations is observed in the superconducting state of the optimally doped () and slightly over doped () samples. An enhancement in caused by the peak-broadening is also observed at 6 meV which remains even at Tc. For the underdoped sample with and the highly overdoped sample with , no clear gap is ovserved even though these samples show bulk superconductivity.
Acknowledgements
The authors acknowledge K. Nemoto and M. Onodera for their technical assistance at JAERI and Tohoku University. We wish to thank H. Fukuyama, T. Tanamoto, H. Kohno, S. Hosoya, K. Hirota and H. Kimura for valuable discussions. We also thank S. Wakimoto for his help in crystal growth of x=0.15 samples. The present work was supported in part by a Grant-In-Aid for Scientific Research from the Ministry of Education, Science, Culture and Sports of Japan and a Grant for the Promotion of Science from the Science and Technology Agency of CREST. Work at Brookhaven National Laboratory was carried out under contract No. DE-AC02-98CH10886, Division of Material Science, U. S. Department of Energy. The research at Massachusetts Institute of Technology was supported by the National Science Foundation under Grant No. DMR97-04532 and the MRSEC Program of the National Science Foundation under Award No. DMR98-08941.
Appendix
We have converted the observed magnetic intensity into the absolute value of by comparing with the intensity of phonon scattering. The phonon intensity is given by
| (5) |
where is the detector efficiency and is the energy-integrated phonon intensity measured by constant-Q scans. The energy integrated phonon scattering cross section is given by:
| (6) |
where C=2.09 barns, is the nuclear structure factor, is the total atomic mass in a unit cell, is the angle between Q and the phonon polarization direction, is the number of unit cells, is the Debye-Waller factor and is the population factor. We have measured the integrated inensity of the acoustic phonons by constant-Q scans at (2, -0.13, 0) for and (2, -0.17, 0) for , 0.18, and 0.25. The magnetic scattering intensity is measured by constant- scans. To scale the magnetic scattering intensity with the phonon intensity measured in a different scan mode, is divided by the sound velocity. The absolute value of is estimated using the following magenetic cross section per formula unit for a Heisenberg system without Néel ordering:
| (7) |
| (8) |
Here barns, is magnetic form factor and .
References
- 1 For a review, see M. A. Kastner, R. J. Birgeneau, G. Shirane and Y. Endoh, Rev. Mod. Phys. 70, 897 (1998).
- 2 H. Yasuoka, T. Imai and T. Shimizu, Springer Series in Solid State Science 89, Strong Correlation and Superconductivity, ed. H. Fukuyama, S. Maekawa and A. P. Malozemoff (Springer-Verlag, New York, 1989)
- 3 J. Rossat-Mignod, L. P. Regnault, C. Vettier, P. Bourges, P. Burlet, J. Bossy, J. Y. Henry and G. Lapertot, Physica C 185-189, 86 (1991)
- 4 T. E. Mason, G. Aeppli and H. A. Mook, Phys. Rev. Lett. 68, 1414 (1992)
- 5 J. M. Tranquada, P. M. Gehring, G. Shirane, S. Shamoto and M. Sato, Phys. Rev. B. 46, 5561 (1992)
- 6 M. Matsuda, K. Yamada, Y. Endoh, T. R. Thurston, G. Shirane, R. J. Birgeneau, M. A. Kastner, I. Tanaka and H. Kojima, Phys. Rev. B 49, 6958 (1994)
- 7 K. Yamada, S. Wakimoto, G. Shirane, C. H. Lee, M. A. Kastner, S. Hosoya, M. Greven, Y. Endoh, and R. J. Birgeneau, Phys. Rev. Lett. 75, 1626 (1995)
- 8 K. Yamada, Y. Endoh, C. H. Lee, S. Wakimoto, M. Arai, K. Ubukata, M. Fujita, S. Hosoya and S. M. Bennington, J. Phys. Soc. Jpn. 64, 2742 (1995)
- 9 M. Arai, T. Arakawa, M. Fujita, S. Wakimoto, K. Yamada, Y. Endoh, G. Aeppli, T. E. Mason and S. M. Hayden, Czech. J. Phys. 46, Suppl. S2, 1147 (1996)
- 10 S. M. Hayden, G. Aeppli, H. A. Mook, T. G. Perring, T. E. Mason, S.-W. Cheong and Z. Fisk, Phys. Rev. Lett. 76, 1344 (1996)
- 11 G. Aeppli, T. E. Mason, S. M. Hayden, H. A. Mook, J. Kulda, Science 278, 1432 (1997)
- 12 Y. Itoh, M. Matsumura and H. Yamagata, J. Phys. Soc. Jpn. 66, 3383 (1997)
- 13 S. Hosoya, C. H. Lee, S. Wakimoto, K. Yamada and Y. Endoh, Physica C 235-240, 547, (1994)
- 14 C. H. Lee, N. Kaneko, S. Hosoya, K. Kurahashi, S. Wakimoto, K. Yamada and Y. Endoh, Supercond. Sci. Techonol. 11, 891, (1998)
- 15 K. Yamada, C. H. Lee, K. Kurahashi, J. Wada, S. Wakimoto, S. Ueki, H. Kimura, Y. Endoh, S. Hosoya, G. Shirane, R. J. Birgeneau, M. Greven, M. A. Kastner and Y. J. Kim, Phys. Rev. B 57, 6165 (1998)
- 16 R. M. Fleming, B. Batlogg, R. J. Cava and E. A. Rietman, Phys. Rev. B 35, 7191 (1987)
- 17 H. Takagi, R. J. Cava, M. Marezio, B. Batlogg, J. J. Krajewski, W. F. Peck, Jr., P. Bordet and D. E. Cox, Phys. Rev. Lett. 68, 3777 (1992)
- 18 T. Nagano, Y. Tomioka, Y. Nakayama, K. Kishio and K. Kitazawa, Phys. Rev. B 48, 9689 (1993)
- 19 C. H. Lee, K, Yamada, M. Arai, S. Wakimoto, S. Hosoya, Y. Endoh, Physica C 257, 264 (1996)
- 20 K. Kurahashi, S. Wakimoto, C. H. Lee, K. Yamada and S. Hosoya, J. Phys. Soc. Jpn. 65, 3994 (1996)
- 21 H. Takagi, T. Ido, S. Ishibashi, M. Uota, S. Uchida and Y. Tokura, Phys. Rev. B 40, 2254 (1989)
- 22 R. Yoshizaki, N. Kuroda, S. Nakamura and N. Ishikawa, Physica C 199, 143 (1992)
- 23 T. Nakano, M. Oda, C. Manabe, N. Momono, Y. Miura, and M. Ido, Phys. Rev. B 49, 16000 (1994)
- 24 D. C. Johnston, Phys. Rev. Lett. 62, 957 (1989)
- 25 B. Lake, G. Aeppli, T. E. Mason, A. Schrder, D.F. McMorrow, K. Lefmann, M. Isshiki, M. Nohara, H. Takagi and S. M. Hayden, Nature 400, 43 (1999).
- 26 T. Sato, T. Yokoya, Y. Naitoh, T. Takahashi, K. Yamada and Y. Endoh, Phys. Rev. Lett. 83, 2254 (1999).
- 27 B. O. Wells, Y. S. Lee, M. A. Kastner, R. H. Christianson, R. J. Birgeneau, K. Yamada, Y. Endoh and G. Shirane, Science 277, 1067 (1997).
- 28 Y. S. Lee, R. J. Birgeneau, M. A. Kastner, Y. Endoh, S. Wakimoto, K. Yamada, R. W. Erwin, S. -H. Lee and G. Shirane, Phys. Rev. B 60, 3643 (1999).
- 29 H. Harashina, S. Shamoto, T. Kiyokura, M. Sato, K. Kakurai and G. Shirane, J. Phys. Soc. Jpn, 62, 4009 (1993).
- 30 P. Bourges, Y. Sidis, B. Hennion, R. Villeneuve, J. F. Marucco and G. Collin, Czech. J. Phys. 46, Suppl. S2, 1155 (1996).