Anomalous dielectric after-effect in ferroelectric KH2PO4
Abstract
Dielectric permittivity, of KH2PO4 pressed powders was measured between = 1.4 and 25 K in the presence of electric bias fields. Usually if the bias was switched at time = 0, and jumped to new values then decreased approximately as (6 s s). This well-known effect, that is also found with single crystals, is attributed to switchable microdomains that are present accidentally in crystals but are systematically more numerous in powders. A very different after-effect was observed in a narrow range around 7–8 K. jumped to a lower value then increased with according to a stretched exponential with a -dependent time constant. This lay near the extrapolation of the Arrhenius law of a known, but unassigned weak-field dispersion that is a property of polydomain single crystals as well as powders. The weak-field dispersion is attributed to the elementary movement of a jog on a lateral step displacement of a domain wall, consisting of a single H-bond reversal. The anomalous after-effect results from the interaction between these point defects and the microdomain system.
I Introduction
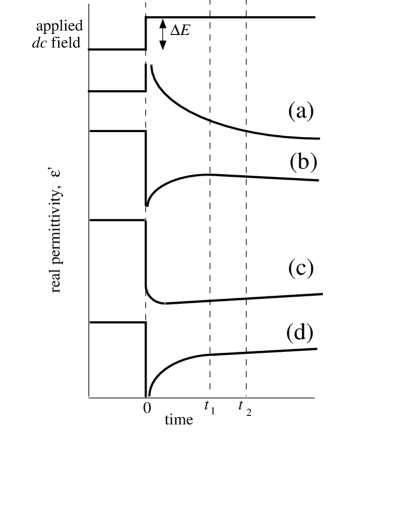
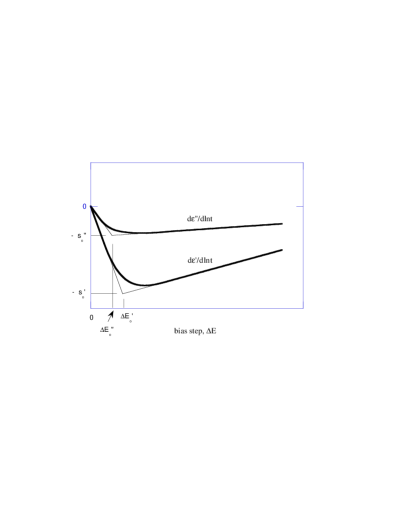
It has been known[1] since the early days of ferroelectric KH2PO4 (KDP) that the material exhibits a retarded response to a disturbance as well as a prompt one. In particular, if its dielectric permittivity, , is recorded using a low amplitude field in the additional presence of a bias field that is changed abruptly at time , then responds by promptly taking a new value, then by decreasing with as shown in Fig. 1, curve (a). Zimmer, Engert, and Hegenbarth[2] reported this for a single crystal with the fields parallel to the ferroelectric -axis, at temperatures = 4.2, 20.4, 77.8, and 300 K. The property is shared by many disordered ferroelectrics and will be referred to as “the normal after-effect”.
Part of the interest of such studies lies in comparison with dielectric glasses which also exhibit a “normal after-effect” at K.[3] It is also well known that ferroelectrics with diffuse transitions and relaxor ferroelectrics display low temperature thermal properties somewhat similar to structural glasses.[4, 5] A specific heat term at K was also at one time reported for KDP[6, 7] though KDP has a normal, sharp ferroelectric transition. It was later clarified that large, pure KDP crystals can have almost Debye-like specific heat,[8] and lack a “glassy” thermal conductivity anomaly.[4]
The present article reports a study of the dielectric after-effect in KDP, mostly as pressed powders. These would be certain to have a strong specific heat term, and the after-effects were found to be stronger, and less variable from one sample to another than with single crystals. In the course of this study, a curious anomaly was found.[9] In a narrow temperature range around 7.5 K the effect of a bias switch was a prompt decrease of followed by an upward relaxation according to a stretched exponential law. Curves (b), (c) and (d) in Fig. 1 show schematically what was observed at 9.0, 6.0 and 7.5 K respectively. The retarded response appeared to be the sum of two terms, the usual downward relaxation as (the normal after-effect) and an upward relaxation with a characteristic time constant that depended on . Near 7.5 K, the upward relaxation dominated throughout the range 6 s s, at 9.0 K only at the shorter times, at 6.0 K the longer ones. This term will be referred to as “the anomalous after-effect”. Two electroded single crystal samples exhibited the anomalous after effect, as well as the normal one,[9] but both effects were more precisely measurable using pressed powders.
Among many previous dielectric studies of KDP, ones by Holste, Lawless and Samara[10] and by Motegi, Kuramoto, and Nakamura[11, 12] paid particular attention to temperatures below 25 K. Over a continuous background of absorption and dispersion rising regularly with , Motegi et al. observed two specific dispersions, one sensitive to fields parallel to the ferroelectric axis (), that required the presence of domain walls, the other sensitive to and equally present in poly- or mono-domain crystals. The dispersion (hereafter “KMN-C”) obeyed an Arrhenius law with activation energy = 19 meV and pre-exponential frequency, = 45 GHz,[12] i.e., it was centered at frequency . It looks like the typical effect of a reorientable point defect species in a crystalline environment. A link between the anomalous after effect and KMN-C was suggested[9] by the finding that the time constant of the stretched exponential obeyed the same Arrhenius law as KMN-C. As it will be shown in Sec. V below, the agreement is not as exact as initially supposed, but it will also be reported (Sec. IV C) that the strengths of the two effects were closely correlated, when samples of different qualities were compared.
The main aim of the present article is to report the anomalous after effect and to suggest an explanation for it. Since it appears to be related both to the normal after effect and to KMN-C, a report and discussion in some detail of each of these effects is also necessary.
It is notorious that a dielectric study of any solid sample that is not a properly electroded single crystal can lead to spurious results that bear little relation to bulk material properties. It is argued below in Sec. III and IV C that serious errors are avoided by restricting attention to K, and interpreting the measurements cautiously. The general features of the data are also described in Sec. III, by reference to one representative KDP sample. In Sec. IV A the normal after-effect is reported. This allows scaling parameters to be defined, that are useful in the subsequent (Sec. IV B and IV C) description of the anomalous after-effect. Results obtained with four single crystal samples are reported in Sec. V, and the three effects, their interrelations and possible origins are discussed in Sec. VI.
II Samples and measurements
The pressed powder samples were derived from Aldrich 99+% ACS reagent. In most cases the product was ground manually to m particle size (as examined by swept-beam electron microscopy at 20 kV) then pressed ( MPa) into pills of diameter 10 mm and thickness normally 250–400 m, density 80% of crystal density. The pills were pressed ( kPa) between lead or indium electrodes. Four single crystal samples were also studied, and these are described in Sec. V, where their results are also reported.
Capacitance and conductance were measured using a General Radio 1621 transformer bridge system, and expressed as and based on the external dimensions of the pills and electrodes. The variations of and during a 360 s interval were obtained from a chart recording of the bridge off-balance signals. At longer times the bridge was rebalanced for each point. The temperature was controlled using a carbon resistor sensor (Allen Bradley 390 ), that was calibrated periodically by substituting a Pt and a Ge resistor for the sample capacitance. Thermometry errors were of two types, a short and a long term error. The short term error was caused by the carbon resistor varying with time following a temperature change. This was noticeable below 10 K and non-negligible below 6 K. It was allowed for by assuming that
where was measured and was required. By waiting long enough before switching the bias field, the last term became a slow drift that could be subtracted confidently. The “long term” error had various contributing causes. In routine work with different samples, the absolute was known to K, but for the extensive work on Sample 2, to K. For the detailed study around 7.5 K (Fig. 9) the relative error was K (rapid succession of measurements without heating above 122 K). For Fig. 12, absolute was known to K.
III Results, Generalities
The results reported here and in Sec. IV A were obtained with a typical pressed powder sample (Sample 1) prepared from KDP as received (not recrystallized).
A Weak field, no bias
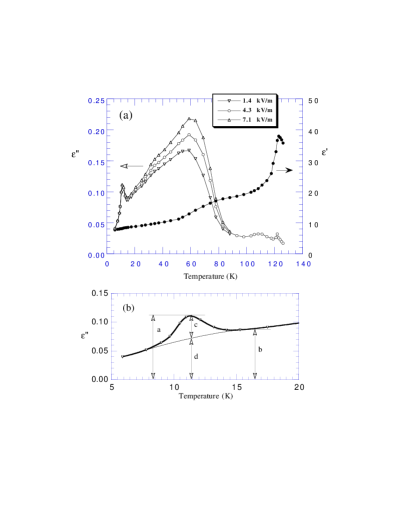
Figure 2 shows the response of Sample 1 to alternating fields of different strengths and a fixed frequency. At ambient , sample impedance was limited by conduction, but this diminished rapidly on cooling, and became undetectably small already well above the ferroelectric transition temperature, , and outside the range of Fig. 2. In Fig. 2, is marked by a peak of at the usual value of 122 K. Well below there are peaks near 12 K and near 60 K. The 12 K peak is a genuine property of the material but the 60 K peak is not. A spurious peak is to be expected near 60 K for the following reason. For the sake of argument, suppose each grain had an anisotropic permittivity as measured with a properly electroded, unclamped single crystal. Both and rise rapidly with in this range,[1, 11] changing in order of magnitude from to . At , there would be appreciable, though nonuniform penetration of field component into suitably oriented powder grains, but at such penetration would be negligible, the applied field being confined to the vacuum gaps, and to within the grains ( remains moderate, rising to a peak value at , while remains low). The best compromise between the rising and the falling penetration then locates a loss peak as in Fig. 2(a). It is not a Maxwell-Wagner effect and does not involve conduction.
On the other hand at K, crystal and values are both moderate and depend weakly on . At the moderate field values used, the dielectric response did not depend markedly on field strength (Fig. 2(a)), while conductance was totally insignificant. Insofar as the constituents of a composite dielectric material can be regarded as continuous media, the value of the composite is a mean value of the of the constituent parts. The possible complex mean values lie within rigorously determined bounds.[13, 14, 15, 16] In these conditions, the 12 K loss peak in Fig. 2 can be assigned as a peak in or or both. In absolute value, it is distinctly stronger than either the or dispersions reported by Motegi et al.[11, 12] in single crystals, but in position it is nearer KMN-C (see Sec. V below and Fig. 12). The background value of in Fig. 2 is also an order of magnitude higher than the background in Motegi’s crystals, so the relative strength of the special absorption effect is quite similar. It is to be noted that the background value as well as KMN-C depended on the presence of domain walls,[12] so the relative strength could be used for comparing the KMN dispersion in samples of different qualities. It will be useful to characterize this relative strength for different samples by expressing the ratio of the peak near 12 K to the minimum near 15 K, the ratio in Fig. 2(b), as a percentage. For Sample 1, = 126% and in absolute value, .
B Effects of bias switches
Figure 3 shows typically how behaved following bias steps of different magnitudes at any value not near 7.5 K. “Step” here means a single abrupt change of applied field. Normally after each step, and after the subsequent changes of had been recorded the sample was heated to and recooled. As Fig. 3 shows, after a small bias step, promptly rose then gradually returned towards its original value, but after a larger step it gradually moved to new, lower values. A curve like (a) of Fig. 1 would be found after a bias step of intermediate magnitude. In each case, taking at the bias step, , where and is a constant. To estimate would require a long, uncertain extrapolation, and over a limited range the power law differs little from a logarithmic variation, so it is more useful to define , and find , which was usually a slowly varying function of . The variations of (not shown in Fig. 3) were similar, but scaled down by a factor of . Defining , was like , usually a slowly diminishing function of . In cases like curves (b) and (c) of Fig. 1, depended more strongly on and even changed sign. In every case the final value of , for , was less than or equal to the initial value . The strength of the measuring field was unimportant provided it did not exceed , otherwise and were underestimated.
Figure 3 shows two relaxations of that start from a same value, even though in one case the sample had been cooled from in a bias field, the other in zero field. At K, was generally reproduced to within 0.1% over a series of thermal cycles up to and back, even though the bias field was sometimes zero, sometimes MV/m and the cooling rate also was variable. Similarly the value of prior to any bias step was reproduced to within 1%. This is quite different from single crystal behavior. Three types of bias switches were studied. Either the sample was cooled in zero field, and field switched on at , or it was field cooled and at , the field switched off or reversed. Repeated measurements at 25 K with bias field switched from 0 to 920 kV/m, separated by thermal cycles to yielded standard deviations 4% for and 2% for , excluding data from the first few cycles. If instead the sample was cooled in 920 kV/m and this bias switched off, was 34% higher and , 22% higher. These are not significant differences, and the same applies if the sample was cooled in 460 kV/m and this switched to -460 kV/m. Only the magnitude of the bias change was important. In this respect also the pressed powders behaved quite differently from single crystals. This point established, the three types of bias switches were used indifferently. Since also the sign of is irrelevant, it will be taken to be positive.
A spurious after-effect could have been caused by space charge migration. If charge were to gradually migrate and accumulate, the effective penetration of the bias field into the grains would gradually diminish. This might cause to return towards its original value, but not to acquire a new, lower value. It will be reported (Sec. IV C) that samples of very different qualities always had limiting and values of the same order of magnitude, which argues against charge migration.
Sequences of bias changes without change of were not studied systematically, but schematically, if the bias field was switched periodically between values and , starting at , without changing , each switch initiated a new relaxation. In that case , where is the time of the most recent bias switch. For small , , while for large , after several switches approached a constant lower value.
IV Permittivity changes following a bias step
A first systematic study of the after-effect at K is reported because this is far from any special feature in Fig. 2(a), and the normal after-effect could be observed without the anomalous effect.
A Behavior near 25 K
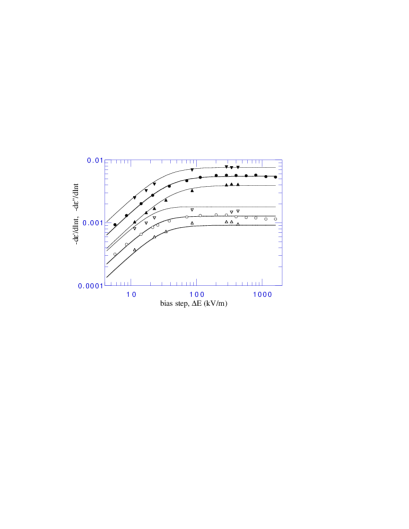
Figure 4 shows and vs. the magnitude of the bias step. Each pair of data points corresponds to a first bias step after a thermal cycle to and back to 25 K. and are the slopes of the best logarithmic fits to curves as in Fig. 3 and corresponding data for between 6 and 360 s. It is already clear from Fig. 3 that was not always proportional to . Figure 4 shows that only at small values. At larger values and reached limits. The limiting value of will be written , and another independent scaling parameter will be defined by putting for small . and similarly define the scale of the curve. The values of the four parameters for each of the three values of Fig. 4 are given in Table I. Their precise absolute values are not significant on account of the incomplete and nonuniform penetration of the applied bias fields into the grains of KDP. It is more useful to note that and are decreasing functions of , while and are increasing functions. Also, at given , .
| (kHz) | (kV/m) | (kV/m) | ||
| 0.12 | 31 | 0.0077 | 20 | 0.0018 |
| 1.2 | 37 | 0.0055 | 24 | 0.0013 |
| 12 | 43 | 0.0039 | 28 | 0.0009 |
The curves in Fig. 4 drawn to fit at 120 Hz and 12 kHz correspond to an empirical formula with the and values given in Table I. The four other curves do not correspond to Table I, but were obtained from these two by supposing that for any given value, depends on the frequency of the measuring field according to a power law, and the response obeys the Kronig-Kramers relation. The appeal to Kronig-Kramers is based on the reasoning that whereas the response to on the time-scale of minutes is essentially nonlinear, represents an approximately linear response to a small field on the millisecond time-scale, and a set of data provides a “snapshot” for given and . The same is true at , and so of the derivative . It shows there is a link between the observations that and increase with , and that is smaller than the corresponding .
B K
The results reported here were obtained with another typical pressed powder (Sample 2) prepared from material that had been recrystallized in bidistilled water, the solution microfiltered. Referring to Fig. 2(b), = 130%, .
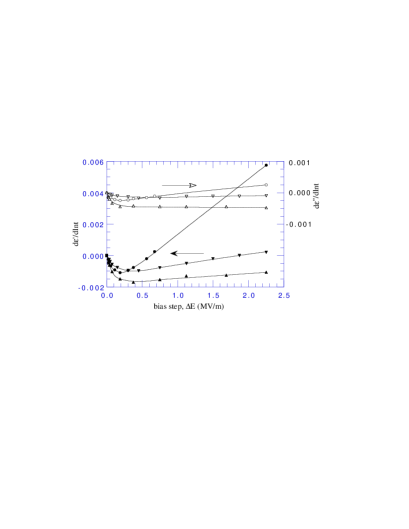
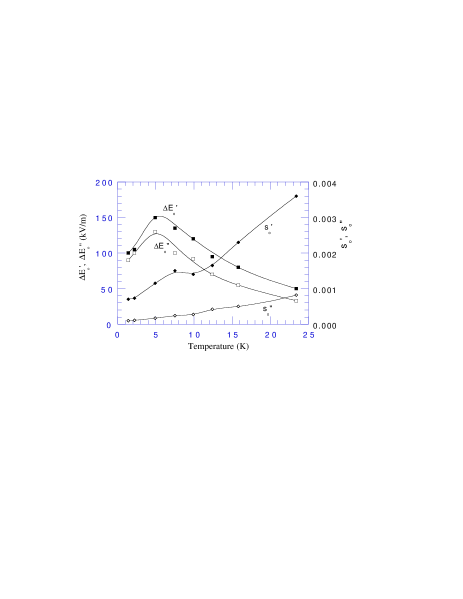
Figure 5 shows and for Sample 2 at a fixed , fixed interval and three temperatures. In this linear plot the details near the origin are not clearly seen, but the curves have two straight-line sections joined by a curved section. In a similar linear plot the same would be true of the 25 K data of Fig. 4, but at these lower values the straight-line section representing at high is not horizontal. It has a distinct positive slope at each , steep at 7.5 K. In the case of the effect is much less pronounced. It is necessary to generalize the definitions of the scaling parameters introduced in Sec. IV A and it will be defined that the straight lines intersect at and respectively as shown in Fig. 6.
The parameters so defined for Sample 2 at various are shown in Fig. 7. and are increasing functions of , but and peak near 5 K. Below 5 K, and , and vary in the same proportions, because the response to a small became temperature independent.
In a linear plot like Fig. 5, the slopes of the straight lines at high can be expressed in dimensionless units by using and or and . In such units the initial slope is always -1 by definition. The values obtained for these positive slopes of were 0.01, 0.02, 0.086,0.32, 0.04, and 0.017 respectively at = 1.37, 2.17, 4.9, 7.5, 9.9, and 12.4 K. For the slopes were 0.04, 0.09, 0.003, and 0.000 respectively at = 4.9, 7.5, 9.9, and 12.4 K. A closer scrutiny of the 25 K data showed a significant positive slope there also, for at . Statistical treatment of all data extending to (five pressed powder samples) yielded a dimensionless slope 0.0030.001.
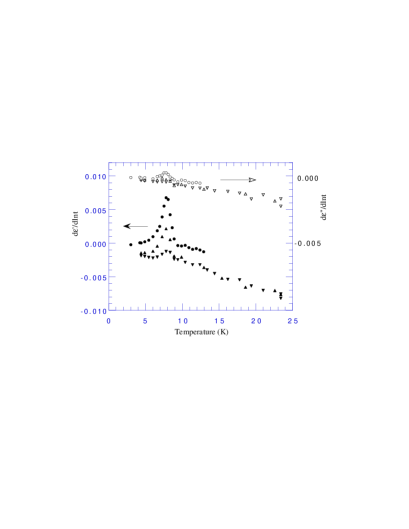
Figure 8 shows and , at fixed and fixed interval, for Sample 2 and another similar sample at three different values. The values are such that always, so that far away from 7.5 K, and . The position of the positive peak is independent of . In relative as well as in absolute value it is weaker in than in .
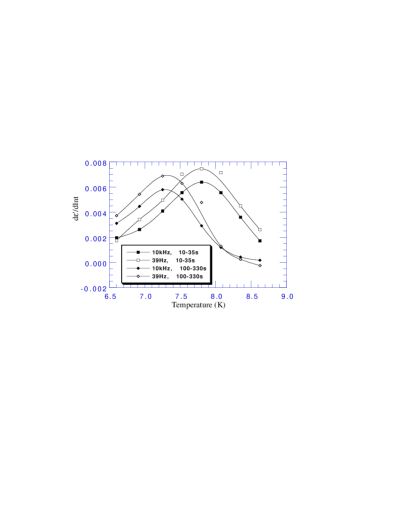
Figure 9 shows in the peak region at two frequencies and two time lapse intervals. The position depends distinctly on the time lapse but not at all on . The magnitude is a very slowly diminishing function of , which is consistent with the weakness of the peak (Kronig Kramers).
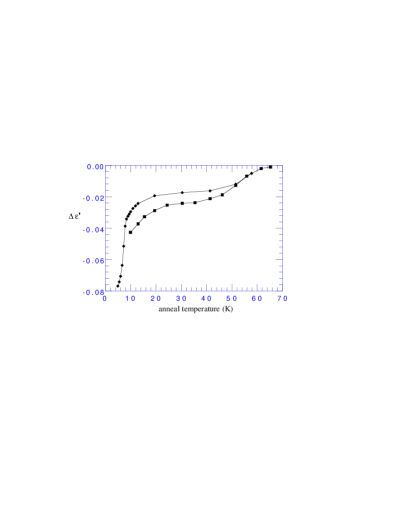
Figure 10 illustrates another method of studying the upward relaxation effect. Two data sets are shown, using different procedures. In one case all the measurements were made at 4.9 K, where the change caused by the bias step could be measured with little ambiguity because was relatively very small. The sample was then annealed at 5.45 K for 2 mn and returned to 4.9 K for another measurement without further bias change, annealed at 6.0 K, at 6.6 K and so on. The coordinate in Fig. 10 is the highest anneal temperature prior to each measurement. The steepest slope near 7 K corresponds to the peaks in Figs. 8 and 9. Anneals up to 20 K continued to have some effect, but then a plateau extended to 40 K, at which % of the shift had been annealed out. The original value was almost entirely restored by an anneal to 65 K. For the other data set, was always measured at 9.9 K, where the bias step was effected, but after each 2 mn anneal at different , and after returning to 9.9 K the sample was cycled to 122 K. Where they can be compared, ie K the curves are similar apart from a scaling factor. The scaling factor suggests bias step was more effective at 9.9 K than at 4.9 K, doubtless because was larger.
A similar procedure was used to compare the strength of the anomalous after-effect of different samples after bias steps of different magnitudes. The bias was stepped at 6.0 K and the sample was annealed for 3 mn at 9.0 K before remeasuring at 6.0 K. This anneal generally restored half way back to its original value. The recorded in these cases (and plotted in Fig. 11) was the change caused by the anneal alone, without reference to the original value before the bias step.
C Particle size and impurity effects
The variations of the scaling parameters from one sample to another are reported here, and also of the KMN dispersion strength and the strength of the upward relaxation of corresponding to the anomalous after-effect. The principal results are also summarized in Table II.
| Smaller particle size | Added impurities | |
| , | little changed (slightly increased) | unchanged |
| , | increased | increased |
| KMN dispersion | unchanged | weakened |
| strength of anomalous after-effect | unchanged (at equivalent values) | weakened |
Firstly it is necessary to consider variations amongst nominally pure samples prepared as in Sec. II. This category includes Samples 1 and 2 that were said to be “typical”. It was found that , , , and for such samples might vary by as much as a factor 2, but often much less. This would be due to accidental variations of density, homogeneity, and particle size distribution of the pressed powders. Therefore when comparing different categories of samples, any variations of these parameters exceeding a factor 2 are considered significant. Neither the scaling parameters nor the KMN strength depended significantly on whether the material was used as received or recrystallized, and whether in bidistilled water (solution microfiltered) or in deionized water. There was no apparent difference between moderately pure and highly pure samples. Mean values at = 25 K and = 1.2 kHz were and kV/m. Referring to Fig. 2(b), the KMN dispersion strength was characterized by 125%145% and 0.0250.045.
To investigate the effects of particle size, two samples were prepared from powders more thoroughly ground than usual, one of “as received” material, the other recrystallized. Examination showed many particles of globular shape and diameter m. With the smaller average particle size, these samples undoubtedly contained a higher proportion of severely damaged and nonferroelectric material. Both had slightly higher and values, but markedly higher and values than standard samples. At = 25 K and = 1.2 kHz, and kV/m. On the other hand two samples with larger than normal particles (loose powder contained angular shaped particles of dimensions m) yielded similar parameter values as standard samples. The larger particles would be likely to have broken up during pressing. Similarly, a normally ground sample pressed at 500 MPa had and values typical of the more thoroughly ground samples pressed as usual at 50 MPa. The KMN dispersion strength was found not to depend significantly on particle size.
A series of samples was prepared in the usual way from material recrystallized from nonstoichiometric or impure solutions. Whatever the impurity species, the results were abnormally high and values, unchanged or and weakened KMN dispersions. In particular, when the solution contained 0.2 H3PO4, 0.1 KHSO4, 0.2 NH4H2PO4 or 2 RbH2PO4 per 100 KDP, or 2 D2O per 98 H2O (2% d), ranged from 0.0035 to 0.0077 as usual, but from 85 to 315 kV/m (always at = 25 K and = 1.2 kHz) while, referring to Fig. 2(b), 101%108% and 0.0140.018. Increased impurity concentration (0.5 H3PO4, 0.3 KHSO4 or 11 RbH2PO4 per 100 KDP) caused further increase of , still no change to but further weakening or disappearance of the KMN dispersion. Between 5 K and 25 K the temperature variations of the four parameters were roughly similar for pure or impure samples with coarse or fine grains (as Fig. 7).
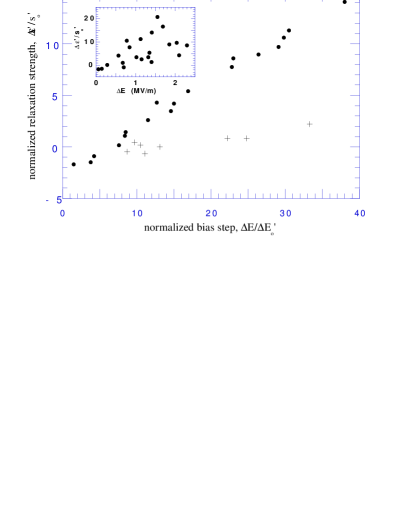
The impure samples also had weaker anomalous after-effects. Figure 11 demonstrates a correlation between strength of anomalous after-effect and KMN dispersion strength. Two groups of samples are featured. The first group comprises seven nominally pure samples. These were prepared as usual (Sec. II) or were more thoroughly ground than usual so they had a variety of values, but all had normal KMN dispersions (125% and ). The second group included the five impure samples mentioned above, and one other that fell into the same category (101%108% and 0.0140.018). As mentioned in Sec. IV B, the strength of the anomalous after-effect was characterized by , the change in caused by anneal at 9.0 K, following a bias step at 6.0 K. To allow for variation of sample densities and homogeneities, was normalized with respect to (as measured at K and = 1.2 kHz). If only the “normal KMN” samples are selected, shows a strong linear correlation with , but only if the latter is also normalized with respect to . The line does not pass through the origin, but below it. For ( at 25 K, 1.2 kHz), or equivalently ( at 7.5 K), the normal after-effect (downward relaxation) still dominated. The points in Fig. 11 for the “weak KMN” samples fall near another line of lower slope, indicating a weaker anomalous after-effect.
One other impure sample deserves a special comment. Following a known example,[17, 18] KDP was recrystallized from solution containing a large excess of base, 58 KOH for 100 KDP. The crystals were very hygroscopic and when removed from the dessicator and pressed into pills, fluid was expelled and filled the space between grains (pill density = 96% of crystal density). Several other samples were more or less conductive at room temperature, but in this respect, this one was an extreme case. Nevertheless, it behaved at low almost as a usual, slightly impure sample. At 25 K, , , and were rather higher than usual. The field would have penetrated the grains more effectively, on account of the higher permittivity of the intergranular space. The KMN dispersion was observed near 12 K (at 1.2 kHz) as usual, as also the anomalous after-effect centered around 7.5 K. This demonstrates conclusively than none of the reported low effects is a purely surface effect, and that the KMN dispersion is unlikely to be a Maxwell-Wagner effect, as already argued by Kuramoto et al.[12]
The 2% deuterated sample was classed amongst the impure samples because of its properties outlined above. It is logical to suppose that protonic impurity in KD2PO4 (DKDP) would have a similar effect, so that if an analog to the KMN dispersion occurs in DKDP it would be necessary look for it in a % sample. Such an effect was searched at 5 K80 K but not found with a commercial (Aldrich) 98% sample nor with another KDP sample recrystallized twice from 99.8% D2O in an atmosphere free of natural humidity.
V Single crystals
Four single-crystal samples were studied. SC 1 consisted of two slabs, cut normal to the -axis and silver electroded by evaporation: total area 72 mm2, mean thickness 0.73 mm. The two pieces were connected in parallel. SC 2 consisted of two other -cut slabs, gold electroded, also connected in parallel: 38 mm mm. SC 3 idem but the two pieces were cut normal to an -axis and silver painted: 75 mm mm. SC 4 was a single -cut plate of irregular shape 61 mm mm, gold electroded.
Both the normal (at 25 K) and the anomalous (near 7.5 K) after-effects were observed with SC 1 and SC 2 (). All low dielectric properties were sensitive to cooling speed through , and whether cooled in field or no field. They were less accurately reproducible from one thermal cycle to another than with pressed powders. With SC 1, after fast zero-field cooling, and were typically several times smaller than with pressed powders, [9] but so also were and . At 25 K, attempts to apply fields kV/m always caused an instability. At lesser values, varied roughly as , and no or value could be estimated. Near 7.5 K, the anomalous after-effect was characterized by a lower constant in the stretched exponential law. Thus if , took the value 0.45 for pressed powder Sample 1 at 7.5 K, but 0.34 for SC 1 at the same . With SC 2, also fast zero-field cooled, all the low dielectric properties were several times weaker than with SC 1.
With SC 3 very little after-effect was found following a bias step, = 300 kV/m at 25 K. This puts an upper limit to of , so if any effect exists for it is of a lower order of magnitude than for . The inference is that the after-effects of the pressed powders are essentially caused by the field component.
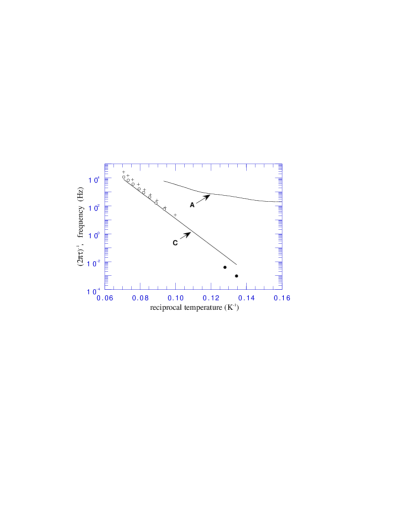
SC 4 was used to check the Arrhenius law of the KMN-C absorption. For this purpose the calibration of the carbon resistor thermometer was not relied on, but a germanium resistor was placed in close thermal contact with the sample. As KMN noted,[12] the background absorption and dispersion that has to be subtracted depends on as well as . Some plausible choice has to be made, how this is done. KMN assumed at each , a Cole-Cole law plus a linear background. For the present, the background to be subtracted at each and was assumed to be a linear interpolation of the data at = 6.14 and 19.75 K (i.e. well below and above the KMN effect) and the same . This also subtracted an instrumental and circuit error that becomes serious at kHz, and it resulted in a symmetric . The peak position was found at each . Two field values were used, 3.5 and 7.0 kV/m (cf. 1.0 kV/m [12]) and the data sets analysed separately. The 3.5 kV/m results are shown in Fig. 12 and yielded Arrhenius parameters = 173 GHz, = 20.09 meV. The 7.0 kV/m results would not be distinguishable in the plot and gave = 170 GHz, = 20.03 meV. If the 6.14 K data alone had been subtracted as background, the figures would have been = 605(640) GHz, = 21.65(21.68) meV. Assuming the linear interpolation is more appropriate, the present result is not significantly different from the published[12] result and it may be concluded that meV and 40 GHz GHz.
Also shown in Fig. 12 are analogous results for pressed powder Sample 2, at 3.8 kV/m, using the same background subtraction. It might be expected that at 6 K would have a peak near 100 Hz corresponding to the dispersion,[12] and so give a false baseline. Such an effect was searched between 5 and 7 K but not detected, which means it could have been no more than 3% as strong as the absorption and dispersion near 12 K in this sample. Best Arrhenius parameters for the latter were = 880 GHz, and = 21.16 meV, and it is concluded from its position in Fig. 12, and absence of effect (at 5–7 K) that it corresponds almost entirely to the KMN-C effect.
Figure 12 also shows two points representing the time constant of the anomalous after-effect. The time constant was taken to equal at the point of maximum positive slope of . It was found at = 7.44 and 7.82 K, and ( is plotted. The points fall distinctly below the Arrhenius law, whichever of the three data sets is extrapolated, but the law derived from the same pressed powder sample comes nearest. If an estimated normal after-effect contribution of the form had been subtracted from the data, the discrepancy would have been smaller.
VI Discussion
The after-effect in KDP at K consists of two parts that are readily distinguished. Both parts have been reported for single crystal samples,[2, 9] as well as pressed powders and the KMN-C dispersion[11, 12] is also a single-crystal property. The discussion of their origins must be broad enough to encompass both types of sample.
A The normal after-effect
A first salient feature of the normal after-effect is that it has been observed at ranging from 1.4 to 300 K, so that its range extends well above and well below the usual domain freezing temperature in crystals ( K). A second is that it has no characteristic relaxation time, and a third is that its magnitude reaches a limit (, ) at very moderate values (, ) of applied field step, with pressed powders at least. Below 25 K, it conforms to a general law for “glassy” properties in that is a simple, near-linear function of .[19] The low and values that decrease with suggest a high dipole moment value that increases with . All this suggests microdomains, that were present accidentally in the single crystals, but more systematically present in the powders. The notion of microdomains was developed[20] to explain the diffuse nature of the phase transition in disordered ferroelectrics such as PLZT ceramics. The sizes and shapes are widely distributed. R. Höhler et al. [21] invoked this notion to explain their finding of a retarded dielectric response at low in a PLZT ceramic. Although a different was measured, related to the polarisation and not the polarisability, a law was also found, between 20 and 80 K, in conditions corresponding to (retarded response independent of ). This possibly suggested independent thermally activated Debye processes with a uniform distribution of activation energies, which would imply a uniform spectral density of values ( is a relaxation time) that varies as . Strongly interacting systems that relaxed according to a hierarchical sequence[22] would also have been possible, and more plausible. The authors suggested[21, 23] a discrimination in favour of the latter, based on results of applying a step as well as a pulse, which indicated an abnormally low frequency prefactor. For the present, it is also more plausible to suppose strongly interacting systems in the pressed powder samples. This would explain why and always took similar values at a given . In the single crystals there may not have been enough active microdomains to reach the strong-interaction limit. Apparently and represent a threshold bias-step value for a prompt and widespread microdomain polarization rearrangement that limits the extent to which the system can be out of equilibrium. It is also most likely that microdomains are responsible for the “background” dispersion and absorption at low , both in single crystals () and powders. They also explain naturally why and decreased with , but increased with . Either increased or decreased would bring into play larger microdomains.
The microdomains that are active at low are probably ones that have less than full orthorhombic distortion, so they are easily switched. In single crystals they are likely to be associated with crystal defects, in pressed powders likely to be much influenced by the damaged grain surface layers. In the powders they must be subject to a very broad distribution of stresses, as witnessed by the equivalence of field-cooled and zero-field-cooled properties. On the other hand, the active microdomains at ambient are perhaps to be identified with the orthorhombic inclusions that have been reported in the tetragonal phase.[24]
A “normal” after-effect of a bias step is also characteristic of disordered dielectrics generally at very low . The immediate rise of and followed by decay as was observed with hydroxyl-doped KCl at K, [25] and several structural glasses, also at K.[3] The results could be displayed in plots like the present Figs. 3 and 4, though the samples were not thermally cycled between measurements as in the present study. The behaviour of the structural glasses below 1 K was explained[26] by reference to a random Ising model of dipoles with long-range interactions.[27] One difference from the present results was that the parameter was an increasing function of . In accordance with the model, it was found , where is the (fixed) relevant dipole moment. Another difference was that decreased sharply with . The other main point in common is that and relaxed downwards, and this can be understood as the system of interacting dipoles gradually self-trapping into deeper potential wells, from which it can respond less actively to weak applied fields.
B The anomalous after-effect
The most obvious distinguishing features are that relaxed upwards, not down and that although some effect was detectable at all between 1.4 and 25 K, there was a pronounced peak near 7 or 8 K, depending on the time lapse. Also, the anomalous effect was only observed when , and then its strength as represented for example in Fig. 11 increased as , where . The parameter needed to describe the normal after-effect appears as a threshold for the anomalous effect. More precisely there was a tendency for the strength to level off and possibly saturate at some high value not reached in this work.[9] This suggests that the unit dipole moment involved here is much smaller than the moments of the microdomains. Since the anomalous after effect is also linked to KMN-C, it may be supposed a same species of dipole (“the KMN dipoles”) is responsible.
A phenomenological model can then be formulated as follows. Two subsystems (the microdomains and the KMN dipoles) coexist and interact, each having its own relaxation dynamics. The KMN dipoles only interact weakly with one another, but certainly interact with the microdomain system. After a bias step that is big enough to unsettle the microdomain system, this settles into a new configuration that is metastable, with the KMN dipoles in their present states. These dipoles then relax with their characteristic time constant, , perpetually changing the local strain fields and electric fields. This affects the microdomain system qualitatively as would a random series of applied field changes. Referring to the effect of repeated bias changes that was mentioned in Sec. III B, and summing over the sample volume, it might be expected that after a single applied field step, ,
For simplicity, unstretched exponentials have been written here. The term in represents regions of the sample where is still relaxing downwards due to the applied field step. Its volume diminishes exponentially. The term represents the sum of micro-regions that have been affected by a subsequent KMN dipole flip, that occurred at . The expression allows an upward relaxation of only if . This is possible because if , takes its limiting value related to , while can plausibly exceed this limit. The field changes caused by the dipole flips may be very strong, but they are localized and random, so they do not cause a prompt and widespread microdomain rearrangement like a strong applied field change. The microdomain system can therefore be driven further away from equilibrium.
C Possible origin of KMN-C and anomalous after-effects
KMN suggested[12] that a peculiar mode of motion related to the domain wall structure may be responsible. If some of the atoms located at the domain boundary were in shallow double potential wells, movement of these atoms across the barriers would be a possible origin. This brings to mind the hydrogen atoms and their O…H-O bonds. At the time of KMN, the potential barrier to H-bond reversal was thought to be well over 100 meV,[28] but newer work[29, 30, 31, 32] based on neutron incoherent scattering data has yielded the much lower estimate of 37.1 meV,[30] and again a precise potential function with a barrier height near 30 meV (for DKDP, 135 meV) has been calculated for the system comprising a hydrogen atom and coupled lattice mode, based on 30 K data.[32] The principal aim was to account for and its deuteration shift by considering lattice dynamics at , but the result might also apply to a special case where a single H bond reversal could occur at low without the energy cost of creating a HPO ion and an adjacent H3PO4 group.
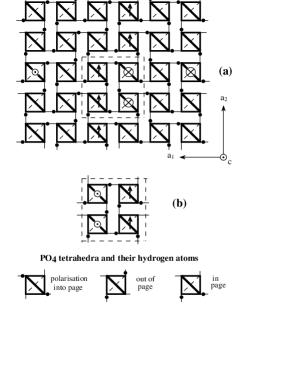
It is necessary to examine possible domain-wall structures. Wall width increases with towards ,[33] but at , walls are plausibly approximated by the vanishingly thin models proposed by Barkla and Finlayson.[1] There were two such structures, the “polarized” and the “neutral” domain wall. Both respect the Slater rule (no HPO4 and no H3PO4 groups). It is not known for certain which is the more accurate approximation to real walls at but Bjorkstam and Oettel calculated that the polarized wall would be the more stable.[34] Bornarel[35] showed that either of these walls, normally planar and perpendicular to an -axis, can have any number of lateral step displacements. The minimum displacement is a half lattice parameter. The step displacements, or quasi-dislocations, like the planar walls, respect the Slater rule, but only if they run straight across the entire crystal, parallel to the -axis. They are associated with an intense local strain field. Minimum domain wall movement therefore involves glide of a quasi-dislocation along its entire length, or the presence of HPO4 and H3PO4 groups. Otherwise, if the walls have finite width, a minimum movement without HPO4 or H3PO4 groups consists of six simultaneous H-bond reversals.[36] The simplest case with HPO4 or H3PO4 is a unit jog, where a quasidislocation shifts by one lattice parameter. This requires a single HPO4 or H3PO4 group and its illustration[37] is reproduced in Fig. 13 for the case of a polarized domain wall. The case of a neutral wall is almost entirely equivalent. By a sequence of single H-bond reversals, the vacancy (or the excess H) can move from one PO4 to the next within a -stack of unit cells, and so, in principle right across the crystal, together with the associated jog. In practice it may get pinned somewhere along the line, by a crystal dislocation or an impurity. A few such pinned jogs may persist as the material is cooled down to temperatures where their creation by thermal activation would be virtually impossible. Also, progression of a jog requires successive reversals of differently oriented H-bonds, first one that lies near the plane of the domain wall, then one nearly perpendicular to it and so on. It is plausible that sometimes, because of the local fields and strains one of these, but not the other remains possible at low , because in just one case the two states are near energetically equivalent. This would constitute the double potential well system.
Yamada and Ikeda[30] considered the “cluster tunneling mode” or protonic polaron[38] model, but found that their purpose of predicting hydrogen dynamics at was better served by a model of incoherent tunneling between self-trapped states. At low this would become coherent phonon-assisted tunneling, with an expected transition probability . On the other hand, the protonic polaron would have an extremely small tunneling splitting, so that thermal activation down to 12 K, or even 7 K, would be more plausible. Moreover, the tunneling mode would be overdamped at higher , and in that condition the predictions of the two models would be experimentally indistinguishable.
In another development since KMN, evidence has been reported[39] of an orthorhombic-monoclinic phase transition in KDP near 60 K. This would mean the H-bonds within a ferroelectric domain are not all equivalent, as previously supposed, but not enough is known about the new phase to draw any other conclusions.
Meanwhile, a different origin for the KMN-C effect cannot be totally rejected. This would attribute it to a defect species that is intrinsic to solution grown KDP (for example a growth dislocation or an included water molecule). At low this defect would only be dielectrically activated by the presence of a domain wall.
VII Conclusions
A new dielectric property of ferroelectric KDP has been reported, “the anomalous after-effect”. It has been shown to be related to the “normal” after-effect[2] and also to the KMN-C dispersion.[11, 12] The normal after-effect is a well-known property of -cut KDP crystals, and of many other ferroelectric materials. Like the specific heat term in microcrystalline KDP, it is reminiscent of such an effect in structural and dipole glasses, but differs in certain important details. It is attributable to microdomains with a wide distribution of sizes, shapes and stresses. Study of the normal after-effect with pressed powders has allowed a set of scaling parameters to be determined for a series of samples of different qualities. As shown in Fig. 11, these scaling parameters also apply to the anomalous after-effect, which therefore also involves microdomains.
The KMN-C dispersion is another known property of -cut KDP crystals. Such dispersions are generally caused by point defects in crystals, and are unknown in structural glasses at low temperatures. Before the present work there was no apparent link between KMN-C and the normal after-effect. The KMN-C dispersion possibly owes its origin to rare, isolated HPO4 and H3PO4 groups associated with jogs on lateral steps (quasidislocations) of domain walls. The activation energy of 19 meV, which is also shared by the anomalous after-effect, would then be related to the energy barrier for the reversal of a single H-bond in this particular environment. It is not clear how closely this should be assimilated to the hypothetical barrier for the reversal of a single H-bond in tetragonal KDP, that has been the object of recent estimates.[30, 32] A correlation might be expected, if different ferroelectric compounds of the KDP type could be compared. The most interesting comparison would be with DKDP, but so far, as mentioned in Sec. IV C no dispersion analogous to the KMN effect has been observed with DKDP. For the other isostructural compounds the situation can be summarized as follows. As pressed powders, RbH2PO4 and the arsenates all behaved analogously to KDP, but the arsenates had first to be crystallized with excess base (solution pH6). Each compound exhibited a low-field dispersion that obeyed an Arrhenius law, and a corresponding anomalous after-effect. With RbH2PO4 the activation energy was close to the value for KDP, perhaps 1 meV higher. With KH2AsO4 it was near 30 meV, with CsH2AsO4, 44 meV and with RbH2AsO4 between these two. However, no independent estimates of the barrier heights are available.
The anomalous after-effect results from an interaction between two coexisting subsystems. One subsystem relaxes with a definite relaxation time, the other with a very broad distribution of relaxation times. The result of the interaction is an apparent tendency of the system to evolve temporarily away from its stable equilibrium. The lines of an explanation sketched in Sec. VI B need to be developed into a model.
Acknowledgements.
This work owes much to Jean Bornarel, who supplied copious advice and background knowledge together with the electroded single crystals. Comments by Jean Souletie, and information supplied by André Durif and Marie-Thérèse Averbuch were also appreciated.REFERENCES
- [1] H.M. Barkla and D.M. Finlayson, Phil. Mag. 44, 109 (1953).
- [2] H.-E. Zimmer, J. Engert, and E. Hegenbarth, Ferroelectrics Letters 6, 165 (1987).
- [3] D.J. Salvino, S. Rogge, B. Tigner, and D.D. Osheroff, Phys. Rev. Lett. 73, 268 (1994).
- [4] J.J. De Yoreo, R.O. Pohl, and G. Burns, Phys. Rev. B 32, 5780 (1985).
- [5] E. Hegenbarth, Ferroelectrics 168, 25 (1995).
- [6] W.N. Lawless, Phys. Rev. Lett. 36, 478 (1976).
- [7] W.N. Lawless, Phys. Rev. B 14, 134 (1976).
- [8] W.N. Lawless, Ferroelectrics 71, 149 (1987).
- [9] J. Gilchrist, Solid State Commun. 108, 939 (1998).
- [10] J.C. Holste, W.N. Lawless, and G.A. Samara, Ferroelectrics 11, 337 (1976).
- [11] H. Motegi, K. Kuramoto, and E. Nakamura, J. Phys. Soc. Jpn 52, 1131 (1983).
- [12] K. Kuramoto, H. Motegi, and E. Nakamura, J. Phys. Soc. Jpn 53, 4413 (1984).
- [13] D.J. Bergman, Physics Reports 43, 377 (1978).
- [14] D.J. Bergman, Phys. Rev. Lett. 44, 1285 (1980).
- [15] G.W. Milton, Appl. Phys. Lett. 37, 300 (1980).
- [16] G.W. Milton, J. Appl. Phys. 52, 5294 (1981).
- [17] E. Nakamura, K. Itoh, S. Ushio, K. Abe, and H. Yoshida, Jpn. J. Appl. Phys. 20, Suppl. 20-4, 59 (1981).
- [18] K. Abe, E. Nakamura, and S. Ushio, J. Phys. Soc. Jpn. 53, 3220 (1984).
- [19] J.J. Préjean and J. Souletie, J. Physique 41, 1335 (1980).
- [20] M. Yokosuka and M. Marutake, Jpn. J. Appl. Phys. 25, 981 (1986), and references therein.
- [21] R. Höhler, J. Münzel, G. Kasper, and S. Hunklinger, Phys. Rev. B 43, 9220 (1991).
- [22] R.G. Palmer, D.L. Stein, E. Abrahams, and P.W. Anderson, Phys. Rev. Lett. 53, 958 (1984).
- [23] R. Höhler, G. Kasper, and S. Hunklinger, J. Non-Cryst. Solids 131-133, 217 (1991).
- [24] E.I. Suvorova and V.V. Klechkovskaya, Sov. Phys. Crystallogr. 36, 405 (1991).
- [25] M. Saint-Paul and J. Gilchrist, J. Phys. C: Solid State Phys. 19, 2091 (1986).
- [26] H.M. Carruzzo, E.R. Grannan, and C.C. Yu, Phys. Rev. B 50, 6685 (1994).
- [27] S. Kirkpatrick and C.M. Varma, Solid State Commun. 25, 821 (1978).
- [28] M.C. Lawrence and G.N. Robertson, J. Phys. C: Solid State Phys. 13, L1053 (1980).
- [29] H. Sugimoto and S. Ikeda, Phys. Rev. Lett. 67, 1306 (1991)
- [30] Y. Yamada and S. Ikeda, J. Phys. Soc. Jpn. 63, 3691 (1994)
- [31] Y. Yamada, J. Phys. Soc. Jpn. 63, 3756 (1994).
- [32] S. Ikeda, Physica B 226, 207 (1996).
- [33] S.R. Andrews and R.A. Cowley, J. Phys. C: Solid State Phys. 19, 615 (1986).
- [34] J.L. Bjorkstam and R.E. Oettel, in Proceedings of the International Meeting on Ferroelectricity, Prague (Institute of Physics of the Czechoslovak Academy of Sciences, Prague 1966) Vol. 2, p. 91.
- [35] J. Bornarel, J. Appl. Phys. 43, 845 (1972).
- [36] V.H. Schmidt, in Ref. 34, p. 97.
- [37] J. Bornarel, Ferroelectrics 9, 197 (1975).
- [38] Y. Yamada, J. Crystallogr. Soc. Jpn. 40, 70 (1998).
- [39] F.E.A. Melo, K.C. Serra, R.C. Souza, S.G.C. Moreira, J. Mendes Filho, and J.E. Moreira, Braz. J. Phys. 22, 95 (1992).