First-order phase transitions in non-equilibrium systems: New perspectives
Abstract
First-order irreversible phase transitions (IPT’s) between an active regime and an absorbing state are studied in two models by means of both simulations and mean-field stability analysis. Hysteresis around coexistence is the result of the interplay of the length of the interface, its curvature and a memory effect related to the phase which is being removed. A controversy on the occurrence of scale-invariance is clarified, conciliating the behavior of IPT’s with its reversible counterpart.
Pacs numbers: 05.70.Jk, 64.60.Ht, 02.50.Ey, 82.65.Jv
The study of far from equilibrium systems continues to attract great attention and has become challenging subject of interest for many areas of research in physics, chemistry, ecology, catalysis, economy, social sciences, etc. [1, 2, 3]. An intriguing feature of those systems is the occurrence of irreversible phase transitions (IPT’s) between an active regime and an absorbing state where the system becomes trapped. After the work of Ziff et. al. [4], our understanding of second-order IPT’s has experienced a rapid growth since they have unambiguously been placed either in the directed percolation or parity conserving universality classes [3, 5]. Due to the lack of experimental feedback on second order IPT’s, the huge activity in the field is mainly of academic-theoretical interest. In spite of the existence of experimental evidence on systems undergoing first order IPT’s [6], our understanding of this field is far from being satisfactory. There are important controversies and many aspects still remain unexplored. In fact, the claim that power-law behavior could also hold for first order IPT’s is certainly a puzzle [7]. A similar controversy has recently raised in the field of reversible transitions [8]. However, power law behavior can be identified as finite-size effects which vanishes in the thermodynamic limit [8]. Furthermore, the existence of hysteresis, which is a signature of first order transitions in equilibrium systems, has so far, not been explored in detail in the field of IPT’s.
The aim of this work is to present an study of first order IPT’s based on two complementary techniques, namely extensive numerical simulations and mean field approaches. Two different model systems, namely the ZGB model for a catalyzed reaction [3, 4] and stochastic game of life (SGL) for a society of living individuals [9] are investigated in order to allow the discussion of useful comparisons.
The SGL model is a cellular automaton defined on a square lattice where each site can take only two values and interacts with its eight nearest neighbors which defines its neighborhood (NH). The system evolves from a given time to the next time step as follows: i) A living site whose NH is dead or allocates one living site, will die. ii) A living site whose NH allocates more than three living sites, will die. iii) A living site whose NH allocates two or three living sites, will survive with a probability . iv) A dead site whose NH is dead or allocates one living site, will remain in this state. v) A dead site whose NH allocates more than three living sites, will remain in this state. vi) A dead site whose NH allocates two living sites, will become a living site with a probability . vii) A dead site whose NH allocates three living sites, will become a living site.
The phase diagram of the SGL has two phases, namely extinction and life, both separated by a first order coexistence curve [9]. A mean field (MF) equation for the time evolution of the density of living sites is given by
| (1) | |||
| (2) |
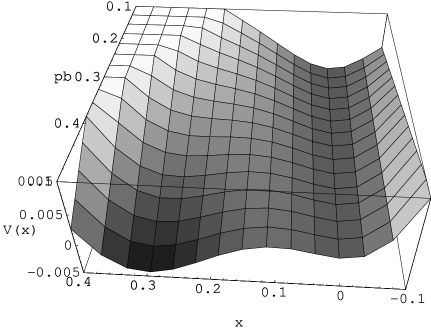
where is the order parameter and . The fixed points of eq. (1) satisfy , and the stable ones correspond to the stationary states of the system. We define a potential through the relation . Then, the stable (unstable) fixed points correspond to the minima (maxima) of , respectively. The values () that satisfy and determine the MF coexistence curve. Figure 1 shows a plot of as a function of and , keeping fixed. is always a minimum of which corresponds to the absorbing state. In addition, the surface exhibits another valley at a higher density which corresponds to the stationary living phase. The valley at a higher density is vanishing when decreasing , and it actually disappears at the coexistence point given by () (see figure 1). Further decreasing leads to potential functions displaying only the valley at . Figure 1 clearly shows that the valley at a higher density disappears at a value well above . So, a sharp jump in the order parameter of the system is observed indicating a first order IPT in agreement with the simulation results [9]. Since the system always evolves to the potential valleys, the stationary state will depend upon the initial density. This MF result is also in agreement with simulations.
The ZGB model is an approach to the catalytic oxidation of carbon monoxide, [4]. The arrival probabilities of and are normalized, , so one has a single parameter which is selected to be . The ZGB model exhibits a first order IPT between a regime of sustained reaction and a CO-poisoned state close to [10]. For details on the ZGB model see e.g. [3, 4, 11].
In this paper, hysteresis in the SGL model has been studied using the constant-coverage (CC) ensemble [11]. First, one has to achieve a stationary configuration using the standard ensemble. Then, the system is switched to the CC ensemble where the density of living sites is varied stepwise. Since the SGL model has two external parameters, and , in the CC ensemble is kept constant and the control parameter is now . Each point of the phase diagram, versus (see figure 2), is evaluated after allowing the system to relax time steps. The phase diagram is identical to that obtained with the standard method only within the living phase, i. e. for . When approaching the coexistence point, the curve bends downwards, close to , becoming parallel to the axis. Then, the value of the parameter remains constant, within this density range, pointing out that the living and the absorbing phase coexist. The MF phase diagram ( versus ) exhibits two branches of fixed points, the upper stable curve and the lower unstable one, that intersect at the coexistence point where the sharp jump in the density occurs. Further decreasing the parameter , leads to only one stable stationary state, namely the absorbing state. Then, no stable stationary living state exists for densities . Using the the CC ensemble the system is forced to support a density within this range, so it splits in two stable phases, namely the living phase at and the absorbing phase that behave almost independently. This is the reason why remains constant in the coexisting region. After achieving a density close to the absorbing state, we begin to slowly increase it. At that stage, a big absorbing cluster has occupied most of the system. Since the density can only grow from the interface between the coexisting phases by invading the absorbing cluster, a larger value of is needed. This is observed in figure 2, where the increasing density branch is the rightmost branch of the loops.

This invading process, which can be regarded as a memory effect related to the absorbing cluster, is unique for the growing branch. It is also found that the longer the relaxation time the narrower the loops. In addition, the left branch (decreasing density branch) seems to fall downwards at the same value independent of the value of . Then, the right branch approaches the left one for longer . After a view inspection of two configurations obtained at the same density but on different branches (not shown here), it is clear that the presence of a large absorbing cluster in the configuration corresponding to the right branch and the existence of many small clusters in the ones corresponding to the left branch is the main difference among them. Then, the length of the interface between the two phases is clearly larger for configurations on the left branch, and consequently they are more efficient at keeping the population constant. This results in a lower value of the parameter . Notice that along the decreasing branch the memory effect is due to the presence of small active clusters. Also, loops become narrower for longer because the system evolves towards the most disordered state with the largest interface at a given density.
In the case of the ZGB model, the density of () plays the role of the control parameter (figure 3). Hysteresis effects are absent in small lattices (), while hysteresis loops can be distinguished for larger lattices (figure 3). So, for the CO-growing (decreasing) branches of the loops we obtain (), respectively. Notice that the value of the parameter remains almost constant for a wide range of values () for .

Assuming that the coexistence point lies in the middle of the loop, we get . We claim that this value, obtained by measuring 400 different points each of them averaged over Monte Carlo steps, is the most accurate available [10]. Snapshot configurations were obtained for both branches (not shown here). For the growing branch a massive cluster preveals and after becoming large enough, it percolates along only one direction of the lattice, forming two (relatively flat) interfaces at the boundary of the coexisting phases. When is increased the interface roughens and eventually dangling ends evolving from both parallel interfaces get in contact causing the onset of percolation in both directions of the lattice. At this point the system jumps to the other branch of the hysteresis loop. So, the interface between coexisting phases has become shorter and its curvature has decreased. Smaller local curvature leads to a less efficient adsorption mechanism and consequently a larger pressure (smaller ) is needed in order to decrease the . In addition, the memory effect associated to a bulky active phase, results in a bigger value along the growing branch, in contrast to the memory effect along the decreasing branch which is related to a bulky cluster. The phase diagram of the ZGB model as obtained by the CC-ensemble, clearly exhibits the upper-spinodal point , which strongly depends on the lattice size. In the infinite-size limit (), we obtain the value which may be compared with [11] and [7]. An stability analysis, similar to that described above for the SGL, has also been performed within the MF approach proposed by Dickman [2]. Both models display two different branches of fixed points, namely a stable branch and an unstable one, which coalesce at a point identified as the spinodal point [2]. CC simulations clearly show the existence of a spinodal point for the ZGB model but no evidence is found in the case of the SGL model.
Another approach for the study of IPT’s is the epidemic analysis (EA) [7]. For the SGL, we have studied the time evolution of the average number of living sites () as it is shown in figure 4. Initializing the simulation with a small colony of living sites in an otherwise extinct state, it is found that the asymptotic regime is reached after updates and it is possible to identify subcritical, critical and supercritical curves as well. The critical point (, ) is in excellent agreement with the coexistence point obtained by means of the CC ensemble (see figure 2). Notice the high sensitivity of to tiny changes in the values of the parameter. also displays a short time regime () and an intermediate time regime (), the last resembling a plateau behavior.

Starting with bigger colonies (inset of figure 4), we observe the following three main differences, i) the short time behavior is absent, ii) intermediate time regime dominates from the very beginning and, iii) asymptotic regime is achieved sooner (). These features can be understood on the basis of the potential . In fact, Figure 1 shows that for low initial densities, will flow to . This is the reason why displays a decreasing short time behavior in figure 4, which appears to be a universal feature observed in every EA of a first-order IPT. However, in some few cases and due to a density fluctuation, the system may overcome the potential barrier, reaching a small region where . Consequently, the system can remain for a long time in a region where until another fluctuation would drive it either towards or to the stationary living state. This explains the plateau observed in the intermediate time regime and the asymptotic regime as well. Another way of corroborating the above explanation is to initialize the simulation with larger colonies (see inset of figure 4). So, as the density is in a region where from the very beginning, the short time behavior is absent and only the plateau and the asymptotic time behavior remain.The short time behavior of the system can be easily confused with a power-law behavior, mainly if small lattices and short times are considered.
In the case of the ZGB model the absorbing state is a lattice fully covered by . So, the EA is started with a covered lattice except by a small amount of empty sites placed at the center of the sample. Figure 5 shows results for the number of empty sites () versus the time .

Results obtained for show pronounced curvature, with clear evidences of a cut-off. So, the dynamical critical behavior of the ZGB model at coexistence does not exhibit scale-invariance. This finding is in contrast with previous results claiming power-law and scaling behavior [7]. For , exhibits a pseudo-power-law behavior over many decades with an effective exponent . However, eventually after a long time, a successful epidemic spreading preveals and suddenly growths as , as it is shown in figure 5, indicating a spatially homogeneous spreading. In order to understand the critical behavior of at coexistence we propose the following anzats
| (3) |
where sets a characteristic time scale which is validated by the plot in the inset of figure 5. A regression analysis gives . Summing up, one observes a pseudo power-law behavior for short time () which crosses over to an asymptotic exponential decay for larger time.
In summary, we have studied two different models that exhibit first-order IPT’s, using extensive computer simulations and MF approximations. Despite of the lack of universality, the critical behavior of both models share several features, namely (i) hysteresis is absent for small lattices, (ii) hysteresis effects are due to the interplay between differences in length and curvature of the interfaces among the coexisting phases at the same density, and the existence of memory effects related to the phase which is being removed. Which of the three effects play a major role may depend on the system and is the subject of an ongoing investigation, and (iii) the occurrence of power-laws in the dynamical critical behavior of first-order IPT’s can be safely ruled out. This last finding conciliates the behavior of first order IPT’s with their counterpart in equilibrium systems where it is well established that the existence of short range correlations inhibits the observation of scale invariance. However, major differences to be noted are: (i) in contrast to the ZGB model, spinodal points are not observed in the SGL model, (ii) for , hysteresis loops collapse to a single curve. However, for the SGL model there is a single vertical line at coexistence, while for the ZGB model the curve splits out in two vertical lines resembling a phase transition in the parameter space, and (iii) the intermediate time dynamic critical behavior is different.
Acknowledgments: This work was supported by CONICET, UNLP, ANPCyT, Fundación Antorchas (Argentina), and Volkswagen Foundation (Germany).
REFERENCES
- [1] See a set of papers published in Science 284, 79 (1999).
- [2] J. Marro and R. Dickman in Non-equilibrium phase transitions in lattice models, Cambridge University Press, Cambrigde (UK) (1999).
- [3] E. V. Albano, Het. Chem. Rev. 3, 389 (1996).
- [4] R. Ziff, E. Gulari, Y. Barshad Phys. Rev. Lett. 56, 2553, (1986).
- [5] J. L. Cardy and U. C. Täuber J. Stat. Phys. 90, 1, (1998).
- [6] M. Ehsasi et al.; J. Chem. Phys. 91, 4949 (1989).
- [7] J. W. Evans and M. S. Miesch; Phys. Rev. Lett. 66, 833 (1991) and Surf. Sci. 245, 401 (1991); J. W. Evans and T. R. Ray, Phys. Rev. E., 50, 4302 (1994).
- [8] F. Gulminelli and Ph. Comaz. Phys. Rev. Lett. 82, 1402 (1999).
- [9] R. A. Monetti and E V. Albano, Phys. Rev. E 52, 5825, (1995); J. Theor. Biol. 187, 183, (1997).
- [10] The error in the value [11], seems to be optimistic on view of the size of the lattices used.
- [11] R. Ziff and B. J. Brosilow. Phys. Rev. A.; 46, 4630 (1992).