Evolution of a polaron band through the phase diagram of Nd2-xCexCuO4-y
Abstract
The evolution with doping and temperature of the polaronic absorption in a family of high-Tc superconductors is first followed here across the whole phase diagram. The polaron band softens with increasing doping, is still present in the superconducting phase, and vanishes in the overdoped metallic phase. These results point toward the existence of polaron aggregates at low temperature and provide an experimental ground for the increasing number of theoretical descriptions of many-polaron systems.
pacs:
PACS numbers: 74.25.Gz, 74.72.-h, 74.25.KcAn absorption band (often called band) appears at 1000 cm-1 in the infrared spectra of many parent compounds of high critical temperature superconductors (HCTS) upon slight doping by either electrons or holes.[1, 2, 3, 4, 5] The polaronic nature of the band has been established on sound arguments,[1, 4, 5, 6] which include the observation that this band is made of overtones of infrared active vibrational modes (IRAV’s) induced by doping.[7] The polarons are most likely in the Cu-O planes that are common to all cuprates where the band has been observed.
Recently, an increasing theoretical effort has been devoted to the investigation of many-polaron systems.[8, 9, 10, 11, 12, 13] Some role of polarons in high- superconductivity has also been proposed by several authors.[14, 15] An experimental study of the band through the whole phase diagram of a cuprate would provide a useful basis to the above theoretical efforts.
In the present paper the above task is pursued by following the evolution of the polaron band in ten Nd2-xCexCuO4-y (NCCO) single crystals. Their reflectivity ) has been measured from 10 to 300 K and from 50 to 15000 cm-1. Those measurements allow us to follow with unprecedented detail the evolution of the band across the insulator-to-superconducting transition (IST) in a family of cuprates. This procedure also enables one to overcome the intrinsic difficulties in discriminating the band from the Drude term in the infrared spectrum of a single, metallic sample.
This investigation in the electron-doped NCCO should be relevant to HCTS, independently of the type of carriers involved. In fact, the well known equivalence between the optical properties of electron- and hole-doped HCTS (see, e.g., Refs. [16] and [17]) has been recently extended to the anomalous transport properties.[18, 19, 20]
The main results of the present work are summarized as follows: i) the average polaron energy softens with increasing doping and/or lowering temperature through the whole insulating phase, with an abrupt change of slope an intermediate doping; ii) this behavior persists in the metallic superconducting phase, where a polaron contribution peaked at a finite energy is still distinguishable, even at optimum doping; iii) no change in the polaron energy with doping is detected at IST; iv) a plain Drude behavior is observed in the overdoped, not superconducting regime. These results are discussed in connection with recent models of polaron-polaron interactions.[8, 9, 10, 11, 12, 13]
The NCCO single crystals investigated here were prepared as described in Ref. [3]. Their doping concentrations are specified in Table I, together with that of a sample measured in Ref. [21]. The Ce concentration was determined as the average of chemical microanalysis measurements at 4 to 7 positions on the crystal surface. The experimental apparatus has been described in detail in Ref. [22]. The real part of the optical conductivity has been obtained from Kramers-Kronig transformations of ) measured with the radiation electric field polarized in the Cu-O plane. is independent of the low- and high-energy extrapolations used to extract it,[22] at least for 5 103 cm-1.
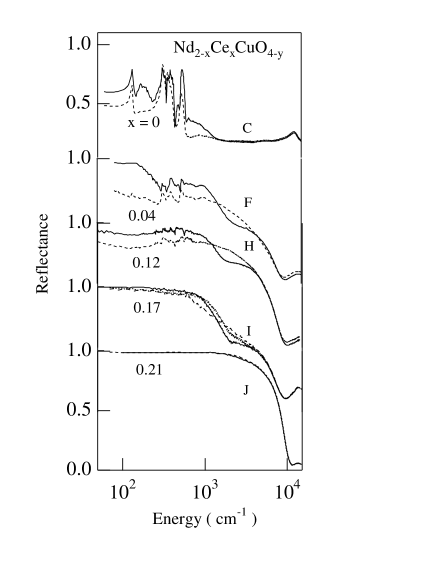
, reported in Fig. 1, illustrates how the reflectivity evolves with doping for the most representative samples. The peak above 104 cm-1 is due to the well known charge transfer (CT) band. A strong temperature dependence is observed in the of the insulating samples (), (), and () for 6 103 cm-1. This holds too for the superconducting sample (=0.17), while no temperature dependence is observed in sample (=0.21). The reflectivity of the other samples in Table I smoothly interpolates that of the samples shown in Fig. 1.
The dependence of the polaron band on T and doping can be isolated from the plain effect of an increased carrier density by looking at the renormalized conductivity = , where
| (1) |
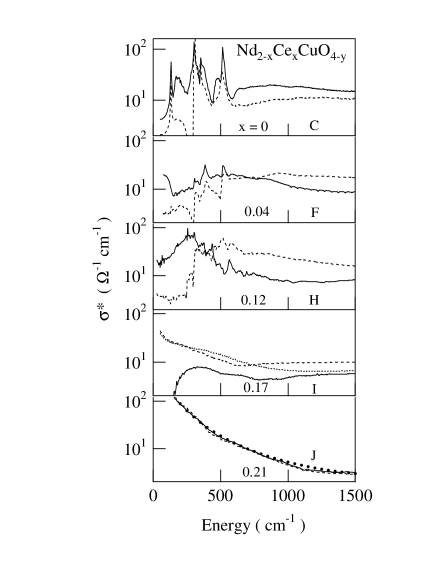
is the spectral weight in the CT gap and is proportional to the number of carriers per unit cell. is the carrier effective mass, assumed here equal to the free electron mass , V is the volume of the unit cell, and =10000 cm-1, an approximate value for the CT energy gap. is reported in Fig. 2 in a reduced infrared range for the same samples shown in Fig. 1.
For fixed T and increasing doping, the spectral weight shifts toward low energy and narrows until a Drude contribution appears above IST. The phonon peaks, increasingly screened, nearly vanish in sample .
For fixed doping, the spectral weight shifts toward low energy with decreasing T until a saturation temperature Ts is reached. Below Ts, the far-infrared optical conductivity does not change sizably. An inspection to the sets of data taken for some samples at intermediate T’s suggests that Ts decreases with doping. It is equal or greater than room temperature in sample (=0; ), on the order of 200 K in sample (=0; ), quite lower in sample (=0.17; ) where still changes on going from 40 to 10 K, and finally is not relevant for sample (=0.21) where no appreciable dependence on T can be detected between 300 and 20 K. A finer tuning of the temperature sampling is required in order to get precise values of Ts and will be the object of further investigations. Since the spectral weight undergoes a “red shift” for decreasing T, the gap appearing at 300 K below cm-1 in sample is almost completely filled at 20 K, indicating a low temperature “metallization” near IST. This “red shift” leads also to a dependence on T of the phonon line shapes (see the two low-doped samples and ), which can be related to a Fano interaction with a polaron continuum shifting from high to low energy with decreasing T.[22]
Finally, for the most doped sample , in Fig. 2 follows a conventional Drude behavior
| (2) |
where is the plasma frequency and is the inverse of the scattering rate, independent of . In the same Fig. 2, a best fit of Eq. 2 to data is reported by dots ( = 17500 cm-1, = 90 cm-1). On the other hand, the same type of fit is unsuccessful in sample where one should add the band to the Drude term in order to satisfactorily fit .
Let us now proceed to a quantitative analysis of . The shift of the spectral weight between the insulating samples and is due to the “red shift” of the polaron band.[22] This analysis can be extended to more doped samples, where the peak energy of the band increasingly merges with the Drude term, by evaluating the first moment, , of the polaronic contribution to . In those highly doped samples the polaron band can be hardly isolated from the Drude and IRAV contributions, while both the mid-infrared (MIR)[noiPR92] and CT terms can easily be identified. Therefore, we actually estimate by subtracting from the corresponding contributions and , which are determined from a standard fit to the data.[22, 23] In conclusion, an approximate expression for the first moment of the polaron conductivity is given by
| (3) |
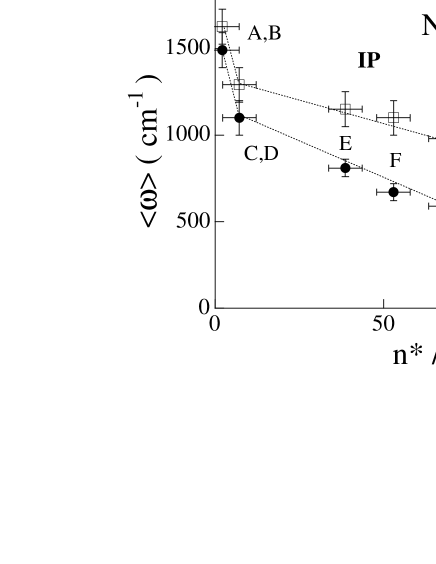
This quantity, estimated at T=300 and 20 K, is plotted in Fig. 3 vs the spectral weight renormalized to , the spectral weight in the CT gap of the less doped sample . has been estimated also for a sample with =0.15 on the grounds of conductivity data at 10 K from Ref. [21] and is reported in Fig. 3.
A major softening of the band on going from room to low temperature is confirmed in all samples. As a function of doping, two different regimes can be identified. In the diluted polaron regime (samples to ), where the intensity of the band increases[23] for , decreases at a much faster rate than at high doping. In the latter region, the determination of is affected by large errors. However, in a few samples[22] seems even to increase with , as predicted in Ref. [24] for a system including polarons, free charges and impurities.
Quite surprisingly, no abrupt change in is observed at IST and is still finite in the superconducting phase, as confirmed from the value extrapolated from Ref. [21] (full triangle). vanishes, instead, at the superconducting-to-metal transition SMT, both at 300 and 20 K, in agreement with the plain Drude behavior of in sample . It should also be mentioned that the polaron band narrows continuously for increasing doping, as observed when comparing sample with sample in Fig. 2.
The above results provide a verification for theoretical models recently proposed for describing a system of interacting polarons. Indeed, in Fig. 3 is closely related to the polaron energy . In the limit of infinite polaron dilution () one observes[23] an almost symmetric polaron band and 2. At finite doping, both the polaron size and line shape are unknown and remains the best experimental estimate of presently available.
According to theoretical models accounting for polaron-polaron interaction,[8, 9, 10] an increase in the polaron density should reduce the electron-phonon coupling. This leads to a decrease of , in qualitative agreement with present results. An explicit expression for the decrease of due to the dipole-dipole interaction in a liquid of large Feynman polarons has been recently derived:[11]
| (4) |
Here, is the polaron energy at infinite dilution, , with the static dielectric constant, is the free electron charge, the polaron effective mass, and is equal to eight times the integral at the denominator of Eq. 3, namely, it is proportional to the polaron density. Equation (4) quantitatively accounts for the decrease of the polaron energy from sample to sample and predicts that vanishes at a doping just slightly higher than that of sample , namely where the rate in the decrease of changes; see Fig. 3. This change of slope implies the insurgence of a new process, e.g., the formation of a polaron aggregate, not predicted by any of the above theoretical models. This process should account also for the persistence of polarons in the metallic superconducting phase with a collapse of in the normal metal. The narrowing of the polaron band further suppports the formation of polaron aggregates. These latters may be either polaron pairs, or clusters, or stripes.
The implications of a hypothetical superconducting polaron-pair aggregate have been discussed and compared to the properties of HCTS in a recent study of the tunneling dynamics of polarons in a two dimensional antiferromagnet.[13] This model also predicts a crossover (either sharp or continuous) from the polaron aggregate to a Fermi liquid for doping higher than the optimal one. On the other hand, evidence of stripes in certain HCTS has been provided by a series of experiments, in particular neutron scattering[25] and EXAFS.[26] Moreover, it can be shown that the total energy of the system decreases if polarons dynamically self-aggregate in unidimensional arrays in the Cu-O plane, hereafter called wires, whose spacing decreases with increasing polaron density.[12] In this context, at the critical density IST, the Cu-O plane becomes unstable and strong fluctuations in the wire density together with the increasing interaction between wires give rise at low T to a crossover from an insulating phase to a superconducting polaron liquid. Therein, localized energy states, monitored by the survival of the band, see Fig. 3, are in dynamical equilibrium with delocalized free carrier (Drude) states. In the superconducting phase, the density of free carriers should increase superlinearly with doping, since an increase in carrier density leads to an increase in the screening length with an ensueing further increase in the number of carriers leaving the wires. This would account for the abrupt drop of the polaron energy at SMT in Fig. 3, which is reached when the screening unbounds all carriers, as also suggested in Ref. [13].
In summary we have shown that a polaron band dramatically softens in NCCO for increasing doping and/or decreasing temperature. This band can still be distinguished from the Drude term in the superconducting phase and disappears only when =0. The well established similarity of both the optical and transport properties between electron- and hole-doped HCTS extends the validity of the present results, which then stress the role of polaronic effects in high superconductivity.
We thank W. Sadowski for providing the samples here investigated, A. Paolone and B. Ruzicka for collaborating in different phases of the data collection, M. Grilli and J. Lorenzana for letting us know their results prior to publication. We also acknowledge useful discussions with C. Castellani, V. Cataudella, S. Ciuchi, J. Devreese, C. Di Castro, S. Fratini, G. Iadonisi, and P. Quemerais.
REFERENCES
- [1] Y. H. Kim et al., Phys. Rev. Lett. 67, 2227 (1991).
- [2] G. A. Thomas et al., Phys. Rev. B 45, 2474 (1992).
- [3] S. Lupi et al., Phys. Rev B 45, 12 470 (1992).
- [4] J. P. Falck et al., Phys. Rev. B 48, 4043 (1993).
- [5] Y. Yagil and E. K. H. Salje, Physica C 256 205 (1996).
- [6] B. Bucher, J. Karpinski, E. Kaldis, and P. Watcher, Phys. Rev. B, 45 3026 (1992).
- [7] P. Calvani et al., Solid State Commun. 91, 113 (1994).
- [8] J. T. Devreese and J. Tempere, Solid State Commun. 106, 309 (1998).
- [9] G. De Filippis et al., Eur. Phys. J. B 8 339 (1999).
- [10] S. Fratini and P. Quémerais, Mod. Phys. Lett. B 12, 1003 (1998).
- [11] J. Lorenzana, unpublished results.
- [12] A. Sadori and M. Grilli, unpublished results (cond-mat/9907447).
- [13] K. Yonemitsu et al., Phys. Rev. B 59, 1444 (1999); and references therein.
- [14] D. Emin, Phys. Rev. Lett. 72, 1052 (1994).
- [15] J. Ranninger, J. M. Robin, and M. Eschrig, Phys. Rev. Lett. 74, 4027 (1995).
- [16] S. Uchida et al., Phys. Rev. B 43, 7942 (1991).
- [17] S. L. Cooper et al., Phys. Rev. B 41, 11 605 (1990).
- [18] The suppression of the superconducting phase under high magnetic field shifts the insulator to metal transition to the optimal doping value both in electron-doped Pr2-xCexCuO4-y (Ref. 19), a compound homologous to NCCO, and in hole-doped La2-xSrxCuO4 (Ref. 20).
- [19] P. Fournier et al., Phys. Rev. Lett. 81, 4720 (1998).
- [20] G. S. Boebinger et al., Phys. Rev. Lett. 77, 5417 (1996).
- [21] C. C. Homes et al., Phys. Rev. B 56, 5525 (1997).
- [22] S. Lupi et al., Phys. Rev. B 57, 1248 (1998).
- [23] P. Calvani et al., Phys. Rev. B 53, 2756 (1996); and references therein.
- [24] V. V. Kabanov and D. K. Ray, Phys. Rev. B 52, 13021 (1995).
- [25] J. M. Tranquada et al., Nature 375, 561 (1995).
- [26] A. Bianconi et al., Phys. Rev. B 54, 4310 (1996), and references therein.
| A | B | C | D | E | F | G | H | Ia | J | Homesb | |
|---|---|---|---|---|---|---|---|---|---|---|---|
| 0 | 0 | 0 | 0 | 0.04 | 0.04 | 0.10 | 0.12 | 0.17 | 0.21 | 0.15 | |
| 0.005 | 0.005 | 0.01 | 0.04 | 0 | 0 | 0 | 0 | 0 |
a Tc = 21 K
b Tc = 23 K, from Ref. 21