Ion-Conducting Polymers – Quenched to Dynamic Disorder
Sarmishtha Mandal, S. Tarafdar111email : sujata@juphys.ernet.in
Condensed Matter Physics Research Centre, Department Of Physics,
Jadavpur University, Calcutta 700032, INDIA.
Aninda Jiban Bhattacharyya222email : aninda@boson.bose.res.in
S.N. Bose National Centre For Basic Sciences
JD Block, Salt Lake, Calcutta 700091, INDIA.
Abstract
Ion conducting polymers have a biphasic character with crystalline as well as amorphous phases. There is moreover, a dynamic disorder due to motion of polymer chain segments. The PEO-NH4ClO4 system undergoes a crossover from a DLA-type morphology for low salt fraction to a structure with polygonal spherulites. In the present communication we show that the low regime exhibits a variation of diffusivity with crystallinity typical of a quenched system, whereas the high X regime has dynamic disorder with rapid rearrangement.
Pacs No : 66.10.Ed ; 66.30.-h, 61.41.+e; 61.43.Hv
Keywords : A. disordered systems ; A. polymers, elastomers and plastics
Polymers such as PEO complexed with salts form good ionic conductors which are used as electrolytes in different devices [1]. These materials are biphasic with crystalline as well as amorphous phases present in a single sample. In addition there is continuous rearrangement of the polymer chains, which aids in the ion transport process [2], so the disorder is said to be dynamic.
In a recent study of PEO-NH4ClO4 systems it was shown that there are two distinct morphological regimes for varying salt concentration and the ion-conductivity can be related to the morphology [3, 4]. In the present communication we show that the two morphological regimes have a striking difference with respect to the dynamic nature of disorder. For low salt fraction at room temperature the system is essentially quenched, whereas for high there is a rapid rearrangement initially, with a percolation-like behaviour setting in later. As temperature increases the low regime also shows dynamic disorder.
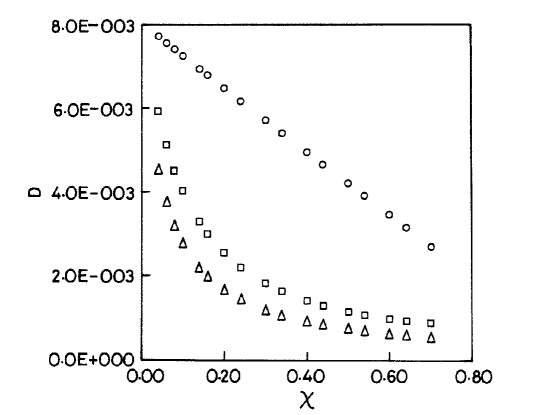
Bhattacharyya et al [5] carried out a computer simulation study of diffusion on a square (2-dim) lattice with rearrangement. Here, a random walker explores a lattice consisting of a random distribution of two types of sites — one good conducting and the other low conducting. is the fraction of crystalline (low conducting) sites. The two types have different trapping times corresponding to amorphous (short time - ) and crystalline (long time - ) phases. The distribution of sites changes after a characteristic time , this incorporates dynamic disorder into the model. An empirical relation for the diffusion coefficient was suggested to be of the form
| (1) |
where
| (2) |
| (3) |
Exact results are obtained in the limits of small and large . With (a quenched system) is given exactly by the relation
| (4) |
which is a curve, and gives a linear relation
| (5) |
Here R = /. Figure 1 shows the variation of with the crystallinity () for different obtained in [5]. The analytical results obtained by Nitzan et al [6] on a random barrier model are very similar.
In the experimental work reported by Bhattacharyya et al [4], ionic conductivity () and crystallinity () were both measured for different salt fractions (). It was found that with increasing there is a rise in accompanied by a fall in upto . After this falls and increases upto , when the salt no longer goes into the complex.
The morphology for is drastically different from [3]. For low , DLA type fractal clusters are formed in a uniform background, whereas for high a polygonal pattern of spherulites is seen. is highest at the crossover region between the two different types of morphology [4].
In the present work we show that the low regime is almost quenched with very large , but for there is dynamic disorder. To demonstrate this we first extract the diffusivity from the conductivity data. This is done by assuming the Nernst-Einstein relation that
We assume here that is proportional to the number of charge carriers present, so an effective diffusion coefficient is obtained simply as
| (6) |
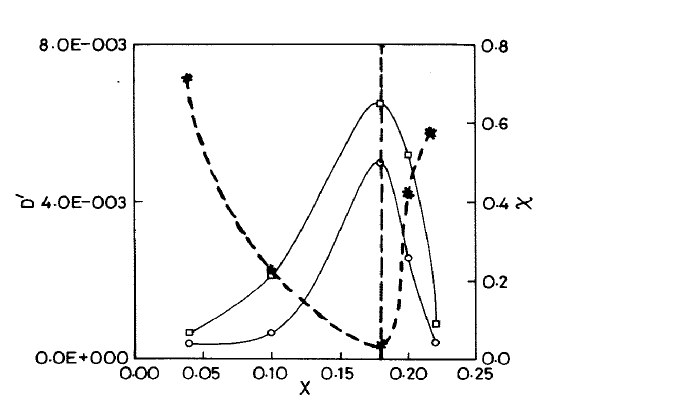
We are interested in the variation of diffusivity with , not the exact numerical value so the variation in is regarded as the variation in . vs and vs are shown in figure 2, for two different temperatures. It is clearly apparent from the asymmetric nature of the curves about , that the variation of with on the left and right of are different.
From the curves in figure 2 we plot vs for and , the results are shown in figures 3 and 4. It is evident that for the curve resembles the curve in figure 1, whereas the curve is much closer to the curve.
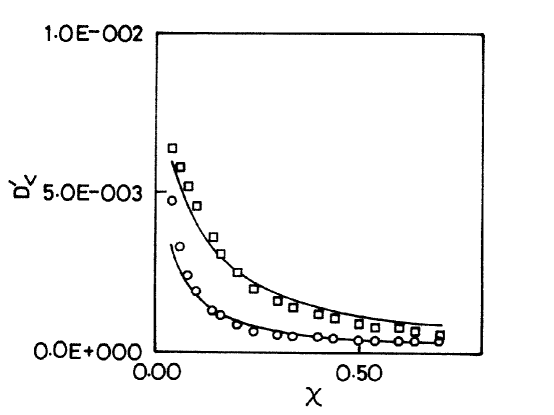
Our results therefore indicate that for the low regime with the DLA type morphology, the system is essentially quenched, but for the high regime with the polygonal spherulites there is considerable dynamic disorder. As temperature increases both regimes show dynamic disorder.
We estimate the relative values of and for the two temperatures 35∘C and 47∘C by fitting the results for to equation (5) in [5].
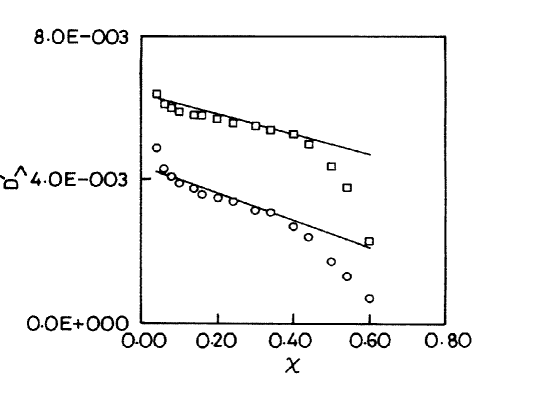
The best fit parameters are given in table 1 and the results are shown graphically in figures 3 and 4. Values of , and are not in absolute units of time but relative values. The extremely rapid rearrangement limit with linear variation given by equation 5 is used to fit the regime.
Table 1 : Input parameters for calculation of D′. for for Temperature 35∘C 150 6000 2104 227.27 1666.66 0 47∘C 125 2500 5103 156.25 277.77 0
It may be seen that the low regime fits the empirical relation for finite quite well, but for the high regime the experimental results deviate linearly towards the point at . The diffusivity vanishing for a finite fraction of low conducting sites 0.66 is strongly reminiscent of the results of percolation theory with one component totally insulating [7]. In our model the crystalline fraction has a high but finite , this gives a nonzero minimum of at .
The temperature variation of the parameters seen in Table I are physically realistic, with both and decreasing for increasing temperature indicating a higher mobility for both amorphous and crystalline fractions as temperature increases. For the nearly quenched regime decreases as temperature increases, that is faster rearrangement occurs. It may be mentioned that vs does not show linear Arrhenius behaviour in our samples. This type of non-Arrhenius behaviour is often observed in glassy or polymer samples [8].
In conclusion we have shown that in PEO-ammonium perchlorate films two distinct ion-conducting regions exist. One is a quenched regime with ion conduction presumably taking place through the interstices of DLA type fractal aggregates, and the other with polygonal spherulites where rapid chain movement of the polymer assists in ion motion. It has been previously suggested by Crist et al [9] that interlamellar regions of spherulites may be preferred for ion motion.
We are at present working on fluorescence spectroscopy studies of the polymer samples to further substantiate our inferences. Acknowledgement : We thank the UGC for financial assistance. SM thanks the CSIR for research fellowship.
References
- [1] M. Armand, Solid State Ionics 69 309 (1994) ; R. Koksbang, I.I. Olsen and D.Shackle, Solid State Ionics 69 320 (1994) ; S.P.S. Badwal, Solid State Ionics, Science and Technology ed. B.V.R. Chowdari et al (World Scientific, Singapore, 1998), p 567.
- [2] A. Nitzan and M.A. Ratner, J. Phys. Chem. 98 1765 (1994) and references therein.
- [3] Aninda Jiban Bhattacharyya, S. Banerjee, T.R. Middya and S.Tarafdar, Fractals 6 285 (1998).
- [4] Aninda Jiban Bhattacharyya, T.R. Middya and S. Tarafdar, Phys. Rev. B, 60 909 (1999).
- [5] Aninda Jiban Bhattacharyya and S. Tarafdar, J. Phys. : Cond. Mat. 10 10931 (1998).
- [6] S.D. Druger, A. Nitzan and M.A. Ratner, J.Chem.Phys. 79 3133 (1983).
- [7] D. Stauffer, Introduction to percolation theory (Taylor and Francis, London, 1985) ; S. Kirkpatrick, Rev. Mod. Phys. 45 574 (1973).
- [8] M.A. Ratner and D.F. Shriver, Chem. Rev. 88 109 (1988) and references therein.
- [9] Y.L. Lee and B. Crist, J. Appl. Phys. 60 2683 (1986).