Calorimetric Investigation of CeRu2Ge2 up to 8 GPa
Abstract
We have developed a calorimeter able to give a qualitative picture of the specific heat of a sample under high pressure up to GPa. The principle of ac–calorimetry was adapted to the conditions in a high pressure clamp. The performance of this technique was successfully tested with the measurement of the specific heat of CeRu2Ge2 in the temperature range K K. The phase diagram of its magnetic phases is consistent with previous transport measurements.
I Introduction
Ambient pressure calorimetry is a classical tool for condensed matter studies. The knowledge of specific heat and its temperature dependence provides information on the type of solid–state excitations and on phase transitions. Extending the standard methods to high pressures (up to GPa) is a rather difficult and experimentally challenging task. In a high pressure study, tiny samples are embedded in a pressure transmitting medium. This assembly is enclosed in a pressure cell. The unavoidable thermal contact between sample and environment leads to heat leakage problems in conventional calorimetric techniques. If the heat capacity of the empty high pressure device is known, the heat capacity of the sample under pressure can be determined by subtraction [1, 2]. As this will work in practice only if the sample contributes a considerable part to the total heat capacity, the choice of samples is restricted.
In the present work we report how the ac–technique [3] can be used to determine the specific heat at low temperature and high pressure. Indeed, this technique is known to be well suited to the high pressure environment [4, 5] since it does not require adiabatic conditions, and allows high resolution, even on very small samples. However, absolute accuracy is generally difficult to obtain.
Two different sample arrangements within the clamped high pressure device were tested. CeRu2Ge2 was chosen as the sample. At ambient pressure it shows two magnetic phase transitions [6, 7] which give rise to large signatures in the specific heat ( and 0.5 J/molK2 at the Curie and N\a’eel temperature , respectively). The pressure dependence of the transition temperatures is known from transport measurements [6, 9, 10, 11, 12]. Thus, CeRu2Ge2 is a good candidate for testing the ac–calorimetric technique at high pressure. It is expected that specific heat can provide additional information on the magnetic phase transitions.
II AC–Calorimetry
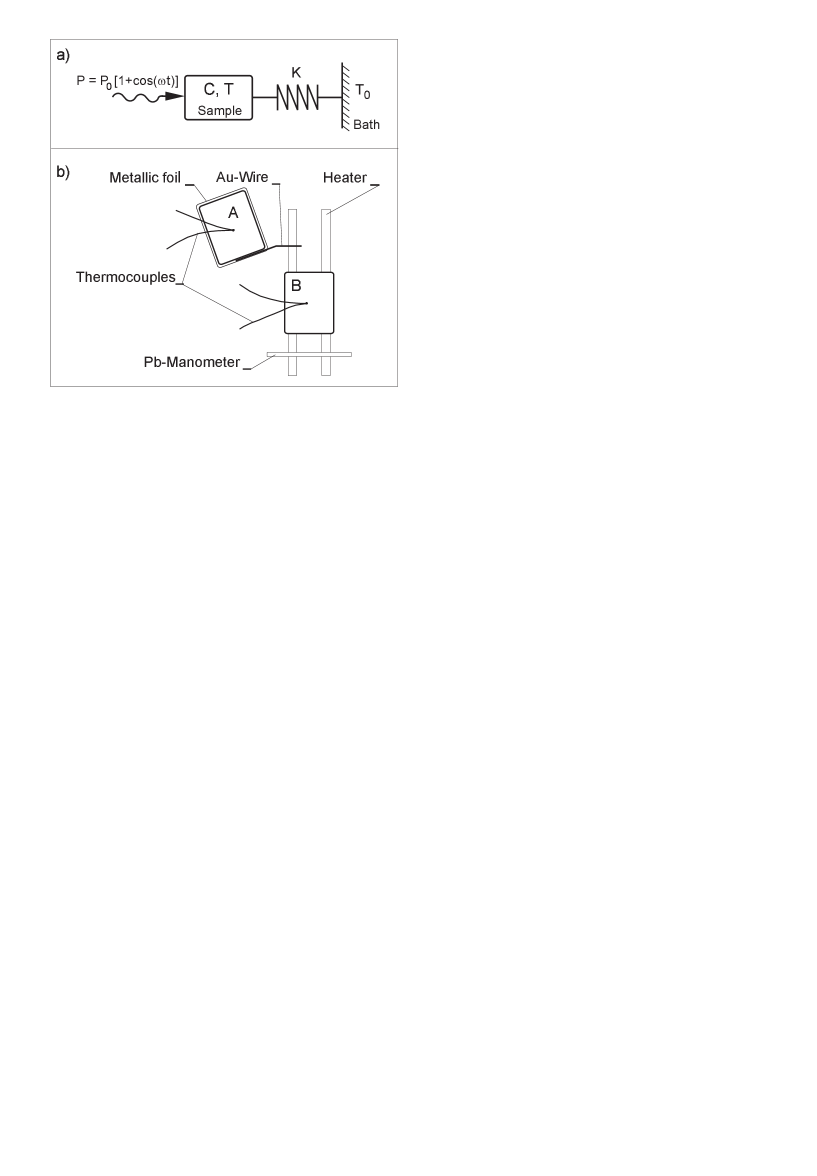
The principle of ac–calorimetry is described in Ref. [3]. Figure 1(a) shows a simplified model: the sample is ther-
mally excited by a ac–heater, and the amplitude of the temperature oscillations is measured. In the ideal case, when the heat capacity of thermometer, heater, and heat link are negligible and when the coupling between heater, sample, and thermometer is ideal, depends
only on the working frequency , the specific heat of the sample , and the global heat link , through the equation:
| (1) |
with and the mean heater power. When working above the cut-off frequency , is inversely proportional to . The possibility of tuning both the amplitude and the frequency of the excitation is the main advantage of this technique; as long as can be made small enough, the sensitivity of the measurement does not depend on the mass of the sample.
The real case of a sample in a pressure cell is far from this ideal one. In particular the specific heat of the pressure transmitting medium has to be taken into account as was done by Baloga and Garland [5]. However, the general behaviour of Eq.(1) can be recovered if the product (volumic specific heat times heat conductivity) of the pressure transmitting medium is negligible with respect to that of the sample [5]. If so, the heat wave does not propagate too far into the medium ( small) and the specific heat of the temperature oscillating medium does not contribute too much ( small). Hence, thermal properties of the pressure transmitting medium determine the working conditions.
III Experimental Details
Calorimetric measurements were performed in a clamped high pressure device able to reach 10 GPa. Sample preparation and details of the high pressure cell are given in Ref. [8, 9]. An important point for specific heat measurements is the fact that the samples are embedded in steatite, the pressure transmitting medium. Figure 1(b) shows schematically the inner part of the high pressure cell in detail. The typical thicknesses of the sample, thermocouple and heating wire are 20, 12, and 3 m, respectively. Two different ways of supplying the heat to the samples were tested. For sample A a thin electrical insulation (4–5 m of an epoxy/Al2O3 mixture) prevents electrical contact with the heater but still allows a good thermal contact. Sample B is set apart on a metallic (Pb) foil, electrically (and thus thermally) linked to the heater through a gold wire. No heating current passes through this sample.
Temperature oscillations should be small compared to the sample temperature and were chosen in the range 2 mK 20 mK. This gives thermovoltages of 100 nV, which were amplified at room temperature in two stages ( 500) and finally read by a lock–in amplifier. We used frequencies between 500 and 4000 Hz. The noise after amplification was 0.15 V peak–peak, i.e. 0.75 nV rms, referred to the thermocouple input taking into account the amplification and settings of the lock–in amplifier. This is not far from the Johnson noise (0.3 nV rms) of the connecting wires (5 at 300 K). The typical thermopower of the thermocouple is 10 V/K, which gives a temperature noise for the sample of 30 K peak–peak; to reach a sensitivity of 1% in the determination of , the sample should have a temperature oscillation 3 mK.
The resistivity of the Pb manometer was measured by the four point technique at 72 Hz. The current excitation was low (5 A) to avoid local heating.
IV Results and Discussion
A Testing
In order to confirm that the signal truly reflects the heat capacity, it should obey the frequency dependence described by the general formula given in Ref. [5]. However, the simplified Eq.(1) describes well the signal as can be seen in the inset of Fig. 2. At low temperature (4.2 K) and pressure (0.7 GPa) the cut-off frequency is 450 Hz; the working frequency was chosen to be slightly higher, keeping in mind that the signal decreases with . Changing the temperature and the pressure influences the cut-off frequency: from 1 to 4 K we worked in the range 600–1000 Hz, and from 4 to 12 K between 2000 and 4000 Hz.
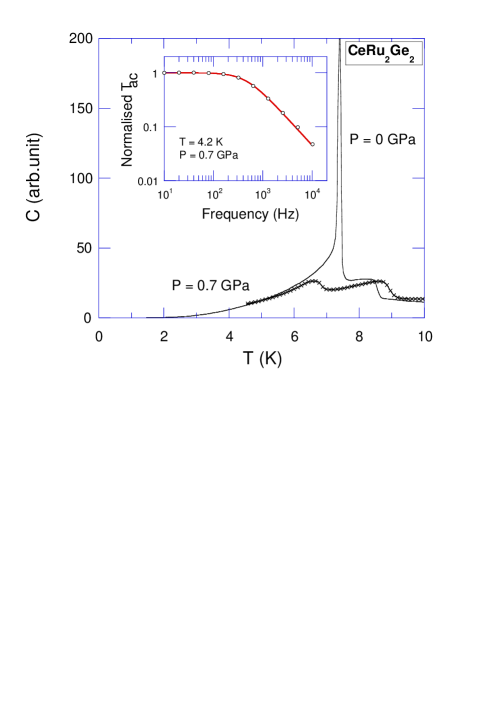
The specific heat of the sample is certainly the main contribution to the signal. This follows implicitly from the fact that the frequency dependence is well described by Eq.(1) without any correction. However, a convincing argument is presented in Fig. 2, where the specific heat measured at ambient and low pressure (0.7 GPa) are compared. The former curve was obtained with a conventional relaxation technique using a comparatively large sample (14 mg) [9, 14] whereas the investigated samples each had a mass of 10 g. The phase transitions are clearly visible. They are also detectable with the ac–technique at 0.7 GPa, but slightly shifted in temperature as expected from the phase diagram [6, 9, 10, 11, 12]. The height of the specific heat jump at the second order transition ( 9 K) represents 47% of the total signal compared to 51% for the ambient pressure curve. This indicates that the heat capacity measured under pressure is in majority the heat capacity of the sample.
The first order transition ( 7 K) is not a good reference for such a comparison. The height of its peak is very sensitive to any distribution of . Moreover, ac–calorimetry is not the proper tool to measure a latent heat [15, 16, 17, 18], since it only detects the reversible part at frequency on a temperature scale . The apparent latent heat may be smaller if part of the system is irreversible at the given frequency. The size of the peak can depend strongly on the operating conditions [18]. This explains the different behaviour at since the relaxation technique used at zero pressure [9, 14] is not subject to this restriction. However, the position of a first order transition can be detected by an ac–calorimeter.
This setup allows the specific heat of samples under pressure to be measure almost without any addenda, therefore no background has to be subtracted. But there are two main limitations: (i) the temperature of the samples is measured with thermocouples, with the assumption that their calibration does not change under pressure. Hence, the quantitative comparison of data at different pressures is limited. However, the relative uncertainty of data obtained in a narrow pressure range remains small. (ii) The total amount of power supplied to the samples is not known precisely, although a joule heater was used. The measurements were done under the assumption that the heat power received by the samples does not change with pressure. These limitations presently do not allow the acquisition of absolute values for the specific heat, so we have to rely on a separate measurement done at zero pressure.
B Specific Heat of CeRu2Ge2 at high pressure
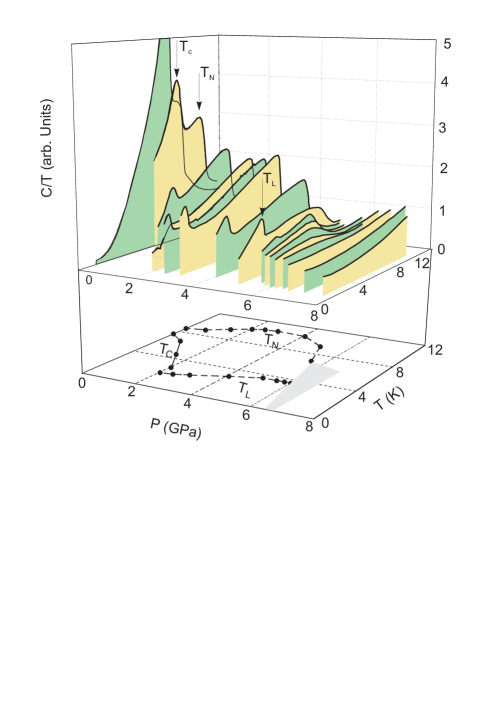
Figure 3 shows versus curves of CeRu2Ge2 at different pressures and the derived (,) phase diagram. The evolution of the anomalies in can be followed up to high pressure ( GPa) for the first time. Results for sample A (insulated from the heater and on top of it) and sample B (connected to the heater but set farther away) at low ( GPa) and high pressure, respectively, were used for this figure. Indeed, both samples show almost identical results, but present small differences which explain this choice. The anomalies in sample B tend to be 10% smaller (depending on pressure and temperature) since the heat capacity of the metallic foil contributes to the measured signal, too. On the other hand, the anomalies of the specific heat of sample A tend to be broader, probably due to a deviation from hydrostatic pressure conditions, especially at higher pressure.
The phase diagram obtained compares well with that deduced from transport measurements [6, 9, 10, 11]. The N\a’eel temperature first increases with pressure up to K (at GPa) and then decreases. In contrast to this, the Curie temperature decreases with pressure and vanishes around 2 GPa. Above that pressure CeRu2Ge2 enters a differently ordered magnetic groundstate below a characteristic temperature K. This transition temperature increases up to K (at GPa). Magnetic order seems to be suppressed below 1.5 K in the pressure range GPa. In this interval the anomaly related to becomes weaker and the overall shape of the vs. curves changes. Hence, a critical pressure GPa is inferred. This value is in agreement with the one deduced from transport measurements (electrical resistivity [11], thermoelectrical power [12]) performed at temperatures above 1.5 K. Electrical resistivity measurements carried out down to 30 mK and 60 mK yield GPa [9] and 10 GPa [10], respectively. These differences are probably due to the influence of sample quality — on a microscopic scale — even though the samples investigated here are taken from the same ingot as those used in the work of Ref. [9, 12].
The dependence can be compared qualitatively with the Doniach phase diagram [19] which describes the competition between the Kondo effect and the RKKY interaction. At low pressures, the latter overcomes the Kondo effect. As the non-magnetic phase boundary is reached, the magnetic moment of the localized –electrons is screened completely by the spin of the conduction electrons.
A detailed view of the –data recorded above 5.5 GPa is given in Fig. 4. The broadening of the antiferromagnetic transition is evident and may be related to an intrinsic behaviour of CeRu2Ge2 or more likely to a deviation from hydrostatic conditions, since the sample sees a pressure inhomogeneity of about GPa around 7 GPa.
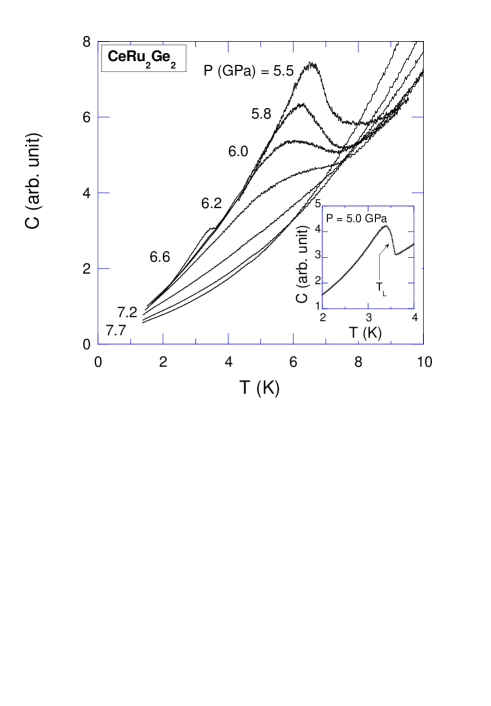
The inset of Fig. 4 shows the low temperature part of the specific heat measured at 5.0 GPa where the anomaly at is maximum. The specific heat data confirm that this transition, also observed in transport measurements [9, 12], has thermodynamic origin and is a bulk property. The nature of this transition is still unclear. Several neutron experiments on substituted compounds (substitution of Ge and Ce by Si and La, respectively, simulates a pressure effect; a correspondence with pressure is given in Ref. [9]) point to the existence of a low temperature transition even if the order parameter has not been identified yet. The indications are (i) the increase of the third order harmonic of the magnetic modulation in CeRu2SiGe, leading to a squaring of the magnetic modulation [20]; (ii) a change in the magnetic excitation spectrum of CeRu2SiGe from quasielastic above K to inelastic below [20]; (iii) in Ce0.8La0.2Ru2Si2 the diffuse scattering measured slightly off the magnetic Bragg peak shows a maximum at K instead at K [21].
V Conclusion
The specific heat of CeRu2Ge2 in the temperature range 1.5–11 K was measured up to 8 GPa with an ac–calorimeter. The evolution of the various magnetic phase transitions in this intermetallic compound could be followed up to the magnetic to non–magnetic phase boundary ( GPa). The (,) phase diagram is in excellent agreement with the previously presented one. This demonstrates that ac–calorimetry can be successfully adapted to high pressure experiments in a clamp pressure device, and opens a new route for thermodynamic measurements.
Acknowledgements
We thank S. Raymond, P. Haen and R. Calemczuk for helpful discussions. This work was partly supported by the Swiss National Science Foundation. During writing the manuscript we were informed of the progress of the Grenoble group [22] who also successfully adapted ac–calorimetry to a high pressure device, using a diamond anvil cell and helium as pressure transmitting medium.
REFERENCES
- [1] Ho, J.C., Phillips, N.E. and Smith, T.F., Phys. Rev. Lett. 17, 1966, 694.
- [2] Phillips, N.E., Ho, J.C. and Smith, T.F., Phys. Lett. A 27, 1968, 49.
- [3] Sullivan, P.F. and Seidel, G., Phys. Rev. 173, 1968, 679.
- [4] Eichler, A. and Gey, W., Rev. Sci. Instrum. 50, 1979, 1445; Eichler, A., Bohn, H. and Gey, W., Z. Phys. B 38, 1980, 21.
- [5] Baloga. J.D. and Garland, C.W., Rev. Sci. Instrum. 48, 1977, 105.
- [6] Wilhelm, H. and Jaccard, D., Solid State Commun. 106, 1998, 239.
- [7] Raymond, S., Haen, P., Calemczuk, R., Kambe, S., Fåk, B., Lejay, P., Fukuhara, T. and Flouquet, J., J. Phys. Condens. Matter 11, 1999, 5547.
- [8] Jaccard, D., Vargoz, E., Alami–Yadri, K. and Wilhelm, H., Rev. High Pressure Sci. Technol. 7, 1998, 412.
- [9] Wilhelm, H., Alami–Yadri, K., Revaz, B. and Jaccard, D., Phys. Rev. B 59, 1999, 3651.
- [10] Kobayashi, T.C., Miyazu, T., Shimizu, K., Amaya, K., Kitaoka, Y., nuki, Y., Shirase, M. and Takabatake, T., Phys. Rev. B 57, 1998, 5025.
- [11] Süllow, S., Aronson, M.C., Rainford, B.D. and Haen, P., Phys. Rev. Lett. 82, 1999, 2963.
- [12] Wilhelm, H. and Jaccard, D., to be published.
- [13] Bireckhoven, B. and Wittig, J., J. Phys. (E) 21, 1988, 841.
- [14] Revaz, B., Ph. D. thesis, University of Geneva, 1998.
- [15] Garnier, P.R. and Salamon, M.B., Phys. Rev. Lett. 27, 1971, 1523.
- [16] Wen, X., Garland, C.W., Shashidhar, R. and Barois, P., Phys. Rev. B 45, 1992, 5131.
- [17] O’Reilly, K.A.Q., and Cantor, B., Proc. R. Soc. Lond. A 452, 1996, 2141.
- [18] Bouquet, F., Marcenat, C., Calemczuk, R., Erb, A., Junod, A., Roulin, M., Welp, U., Kwok, W.K., Crabtree, G.W., Phillips, N.E., Fisher, R.A. and Schilling, A., in Proceedings of the ASI Series E 356, Physics and Materials Science of Vortex States, 1998, p.743, Kluwer Academic Publishers; F. Bouquet, Ph. D. thesis, University of Grenoble 1, 1998.
- [19] Doniach, S., Physica B 91, 1977, 231.
- [20] Rainford, B.D., Adroja, D.T. and Haen, P., ILL Exp. Report No.4–03-898, Grenoble, 1999.
- [21] Regnault, L.P., Jacoud, J.–L., Mignot, J.–M., Rossat–Mignod, J., Vettier, C., Lejay, P. and Flouquet, J., J. Magn. Magn. Mater. 90&91, 1990, 398.
- [22] Demuer, A., Marcenat, C. and Calemczuk, R., (private communication).