[
Local Magnetic Order vs. Superconductivity in a Layered Cuprate
Abstract
We report on the phase diagram for charge-stripe order in La1.6-xNd0.4SrxCuO4, determined by neutron and x-ray scattering studies and resistivity measurements. From an analysis of the in-plane resistivity motivated by recent nuclear-quadrupole-resonance studies, we conclude that the transition temperature for local charge ordering decreases monotonically with , and hence that local antiferromagnetic order is uniquely correlated with the anomalous depression of superconductivity at . This result is consistent with theories in which superconductivity depends on the existence of charge-stripe correlations.
pacs:
74.72.Dn, 74.25.Fy, 71.45.Lr, 75.30.Fr]
Superconductivity in the layered cuprates is induced by doping charge carriers into an antiferromagnetic insulator. The kinetic energy of the mobile carriers competes with the superexchange interaction between neighboring Cu spins [2, 3]. There is increasing evidence for the hole-doped cuprates that this competition drives a spatial segregation of holes which form antiphase domain walls between strips of antiferromagnetically correlated Cu spins [4, 5, 6, 7, 8, 9]. A major controversy surrounds the issue of whether the mesoscopic self-organization of charges and spins is a necessary precursor for high-temperature superconductivity [10, 11, 12], or whether it is simply an alternative instability that competes with superconductivity [13, 14].
To gain further insight into this problem, we have performed a systematic study of the phase diagram of La1.6-xNd0.4SrxCuO4 (LNSCO), a system for which evidence of competition between superconductivity and stripe order has been reported previously [15]. From neutron and x-ray scattering measurements we show that the charge and magnetic ordering temperatures reach their maxima at . For , the charge-ordering transition is limited by a structural phase boundary. The low-temperature structural phase involves a change in the tilt pattern of the CuO6 octahedra, stabilized by the substituted Nd, which can pin vertical charge stripes [16].
At first glance, these results, together with the anomalous depression of the superconducting transition temperature, , at , appear to provide confirmation that charge-stripe order is in direct competition with superconductivity; however, the picture becomes more complicated when one takes into account recent nuclear-quadrupole-resonance (NQR) studies of LNSCO [5, 6]. In this work, a transition (involving the onset of an apparent loss of intensity) has been identified which coincides with the charge ordering determined by diffraction for ; however, in contrast to the diffraction results, the NQR transition temperature, , continues to increase as decreases below . Furthermore, the same transition is observed in La2-xSrxCuO4 (LSCO) for . The implication is that local charge order, not easily detected by diffraction techniques, may occur even in the absence of the Nd-stabilized lattice modulation.
Does really correspond to charge ordering? To test this possibility, we have analyzed the in-plane resistivity, , which should be a sensitive measure of charge ordering. Through a scaling analysis, we have identified a temperature scale that corresponds to a low-temperature upturn with respect to an extrapolated linear variation with . (The signature of the charge ordering is subtle, as befitting its unconventional nature.) We show that corresponds with for both LNSCO and LSCO, thus providing support for the association of with local charge ordering. Furthermore, we show that and are linearly correlated with the size of the lattice distortion at low temperature. Together with the reasonable assumption that the magnitude of the charge-order parameter at low temperature is correlated with the ordering temperature, this result is strong evidence for a monotonic decrease of the charge-order parameter with increasing hole concentration (over the range studied here).
A monotonic variation of the stripe pinning strength means that there is no correlation with the anomalous depression of at . We are left with the suprising conclusion that it is, instead, the static magnetic order alone which has a special association with the anomaly. In making this assertion, we do not argue that ordering the charge is good for superconductivity; to the contrary, is certainly reduced in all of our LNSCO samples compared to comparably-doped LSCO. Rather, our point is that, while pinning charge stripes is not good, it is magnetic order that is truly incompatible with superconductivity. The competition between static local antiferromagnetism and superconductivity is supported by recent theoretical work [17], and is compatible with the spin-gap proximity-effect mechanism for superconductivity [10].
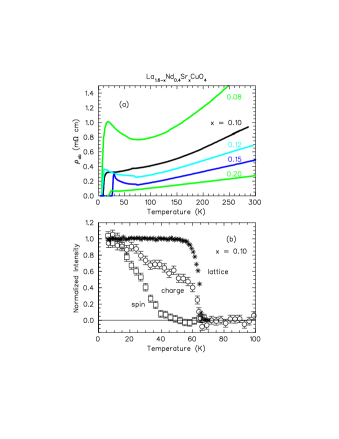
For this study, a series of crystals of La2-x-yNdySrxCuO4, with and to 0.25, was grown by the travelling-solvent floating-zone method [18]. Figure 1(a) shows the electrical resistivity measured parallel to the CuO2 planes by the six-probe method. As previously reported [19], there are upturns in at low temperature for the and 0.15 samples, compositions at which charge order has been observed [19, 16, 20, 4]. In each there is also a small jump near 70 K, where a subtle structural transition takes place from the so-called low-temperature-orthorhombic (LTO) phase to the low-temperature-tetragonal (LTT) or an intervening low-temperature-less-orthorhombic (LTLO) phase [21, 22]. At , charge ordering and the structural transition are essentially coincident [19, 20]; however, charge ordering occurs significantly below the structural phase change at (see Fig. 2) [4].
The resistivity for looks somewhat different. Instead of an increase at the structural transition temperature, decreases below the transition, and continues to decrease in a typically metallic fashion until superconductivity sets in. To test whether stripe order occurs in this sample, we performed a neutron scattering experiment at the NIST Center for Neutron Research (NCNR) [23]. We found that the sample does indeed exhibit charge and spin order. The temperature dependence of the peak intensities for representative superlattice peaks are shown in Fig. 1(b). On warming, the charge order (which has also been confirmed by x-ray diffraction measurements at HASYLAB) seems to be limited by the structural transition at 65 K, while the magnetic order disappears at a lower temperature.
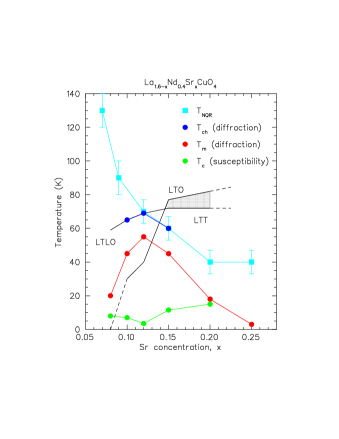
We have also used neutron scattering to determine the magnetic ordering temperatures () in samples with and 0.25. The results are summarized in Fig. 2. (Further details of the neutron studies will be presented elsewhere.) The new results for and 0.10 make it clear that the highest occurs at , where the superconducting transition () is most greatly depressed. Also plotted in the figure are the transition temperatures () deduced from Cu NQR measurements by Singer, Hunt, and Imai [6, 5]. Those temperatures coincide with the charge-order transitions, , for and 0.15 determined by diffraction, but there appears to be a discrepancy for .
The NQR and diffraction results for are not necessarily in conflict, since NQR is an inherently local probe, whereas the diffraction measurements require substantial spatial correlations of the charge order in order to obtain detectable superstructure peaks. But it is also interesting that NQR measurements [6, 5] suggest charge order in pure La2-xSrxCuO4 for , where diffraction studies have not yet detected any charge-related superlattice peaks. If some form of charge ordering is occurring within the LTO phase, one would expect to see an indication of it in the resistivity. As we will show below, it is, in fact, possible to identify a signature of charge order in resistivity measurements.
To analyze the resistivity, we consider first the behavior at higher temperatures. For cuprates doped to give the maximum , it was noted early on [25] that, over a surprisingly large temperature range,
| (1) |
with very close to zero. We find that this formula describes fairly well the results in Fig. 1(a) for K. Values for were obtained by fitting Eq. (1), with , to data in the range K; the same analysis was also applied to resistivity data for La2-xSrxCuO4 crystals with , 0.12, 0.15, and 0.20 [18].
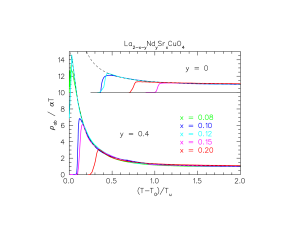
Next, we analyze the upturn in the resistivity at low temperature. The temperature at which the upturn becomes significant varies with , and so does the rate of upturn; it was pointed out previously by Büchner and coworkers [26] that the rate of upturn increases monotonically as one goes from to 0.12 to 0.15. We have found that all of the data can be scaled approximately onto a single curve if is divided by and then plotted against a reduced temperature , where is the characteristic upturn temperature and is the temperature towards which appears to be diverging. The scaled resistivities are shown in Fig. 3; note that the same scaling is useful for samples both with and without Nd. The scaled curve is given approximately by
| (2) |
and we have determined error bars for the parameters and by performing least-squares fits to this function.
The values of are compared with in Fig. 4, where both are plotted vs. the maximum orthorhombic splitting in the LTO phase. Büchner et al. [27] have shown that is a useful measure of the octahedral tilt angle, which changes orientation but not magnitude in the LTLO and LTT phases. For the samples, we used our own neutron measurements of , while we used results from [28] for LSCO.

From Fig. 4 we see that (1) the values of and agree within the error bars, and (2) both values tend to scale with the octahedral tilt angle, independent of the tilt orientation (LTO vs. LTT). The first point reinforces the association of with charge order, while the second indicates that the ordering temperature for local charge ordering is controlled by the tilt angle. (A correlation between tilt angle and reduction was noted previously by Dabrowski et al. [29].) Longer-range charge correlations (those detected by diffraction) appear to be sensitive to the tilt orientation.
The variation of with is shown in the inset of Fig. 4 for . There is a considerable increase in from to 0.15. We suggest that this trend may be associated with a phase locking of charge-density-wave correlations along neighboring charge stripes, a possibility suggested by Kivelson, Fradkin, and Emery [30]. Whether or not this interpretation is correct, there is clearly no correlation between the variations of (or ) and the depression of for , which is greatest at .
The variations of and shown in Fig. 4 strongly indicate that ordering of the charge stripes is not responsible for the strong depression of at . We are then left with the conclusion that the culprit must be the magnetic order, which is maximized at the point where is minimized. That local antiferromagnetic order competes with superconductivity is certainly compatible with the spin-gap proximity-effect mechanism for superconductivity [10]. In that theory, hole pairing is associated with the occurrence of a spin gap; given that antiferromagnetic order competes with singlet correlations and a spin gap, one would then expect to be depressed when magnetic order is present. (Of course, charge order is a prerequisite for magnetic order.) The trade off between local magnetic order and superconductivity is also emphasized in a recent numerical study [17].
One simple reason why might reach a maximum at is suggested by recent analyses of coupled spin ladders [31, 32]. If the charge stripes are rather narrow and centered on rows of Cu atoms, then the intervening magnetic strips would consist of 3-leg spin ladders. Theoretical analyses have shown that even weak couplings between a series of 3-leg ladders will lead to order at sufficiently low temperature, whereas weakly coupled 2- or 4-leg ladders have a quantum-disordered ground state [31, 32]. As deviates from , one would have a combination of even-leg and 3-leg ladders, thus weakening the tendency to order. Although there is no direct experimental evidence concerning the registry of the stripes with the lattice, the picture of a CuO2 plane broken into a series of 3-leg ladders by Cu-centered charge stripes at is appealing in the present case.
One might argue that only longer-range magnetic (or charge) order is relevant for suppressing superconductivity. We believe that a counter-example is given by the case of Zn-doping, where a local suppression of superconductivity is associated with static short-range antiferromagnetic correlations about the Zn sites [33].
In conclusion, we have presented evidence that it is local magnetic order rather than charge-stripe order which is responsible for the anomalous suppression of superconductivity in LNSCO at . While pinning charge stripes also causes some reduction of , charge order appears to be compatible with superconductivity as long as the spin correlations remain purely dynamic.
This research was supported by the U.S.-Japan Cooperative Research Program on Neutron Scattering, a COE Grant from the Ministry of Education, Japan, and U.S. Department of Energy Contract No. DE-AC02-98CH10886. We acknowledge the support of the NIST, U.S. Department of Commerce, in providing the neutron facilities used in this work; SPINS is supported by the National Science Foundation under Agreement No. DMR-9423101. NI and JMT acknowledge the hospitality of the NCNR staff. We thank V. J. Emery and S. A. Kivelson for helpful comments.
REFERENCES
- [1] Present address: Institute for Chemical Research, Kyoto University, Uji 611-0011, Japan; CREST, Japan Science and Technology Corporation (JST), Kawaguchi, Saitama 332-0012, Japan.
- [2] P. W. Anderson, Adv. Phys. 46, 3 (1997).
- [3] V. J. Emery, S. A. Kivelson, and J. M. Tranquada, Proc. Natl. Acad. Sci. USA 96, 8814 (1999).
- [4] T. Niemöller et al., Eur. Phys. J. B 12, 509 (1999).
- [5] A. W. Hunt, P. M. Singer, K. R. Thurber, and T. Imai, Phys. Rev. Lett. 82, 4300 (1999).
- [6] P. M. Singer, A. W. Hunt, A. F. Cederström, and T. Imai, Phys. Rev. B 60, 15345 (1999).
- [7] S. Wakimoto et al., Phys. Rev. B 60, R769 (1999).
- [8] H. A. Mook et al., Nature 395, 580 (1998).
- [9] H. A. Mook and F. Doğan, Nature 401, 145 (1999).
- [10] V. J. Emery, S. A. Kivelson, and O. Zachar, Phys. Rev. B 56, 6120 (1997).
- [11] C. Castellani, C. Di Castro, and M. Grilli, Z. Phys. B 103, 137 (1997).
- [12] M. Vojta and S. Sachdev, Phys. Rev. Lett. 83, 3916 (1999).
- [13] T. M. Rice, Physica C 282–287, xix (1997).
- [14] G. Baskaran, cond-mat/9910161.
- [15] J. M. Tranquada et al., Phys. Rev. Lett. 78, 338 (1997).
- [16] J. M. Tranquada et al., Nature 375, 561 (1995).
- [17] M. Havilio and A. Auerbach, Phys. Rev. Lett. 83, 4848 (1999).
- [18] N. Ichikawa, thesis, University of Tokyo (1999).
- [19] J. M. Tranquada et al., Phys. Rev. B 54, 7489 (1996).
- [20] M. v. Zimmermann et al., Europhys. Lett. 41, 629 (1998).
- [21] J. D. Axe et al., Phys. Rev. Lett. 62, 2751 (1989).
- [22] M. K. Crawford et al., Phys. Rev. B 44, 7749 (1991).
- [23] The sample was studied at spectrometer BT4 with 14.7-meV neutrons; and 0.25 samples were characterized at the NG-5 SPINS spectrometer with 5-meV neutrons.
- [24] J. E. Ostenson et al., Phys. Rev. B 56, 2820 (1997).
- [25] M. Gurvitch and A. T. Fiory, Phys. Rev. Lett. 59, 1337 (1987).
- [26] M. Hücker et al., J. Phys. Chem. Solids 59, 1821 (1998).
- [27] B. Büchner, M. Breuer, A. Freimuth, and A. P. Kampf, Phys. Rev. Lett. 73, 1841 (1994).
- [28] P. G. Radaelli et al., Phys. Rev. B 49, 4163 (1994).
- [29] B. Dabrowski et al., Phys. Rev. Lett. 76, 1348 (1996).
- [30] S. A. Kivelson, E. Fradkin, and V. J. Emery, Nature 393, 550 (1998).
- [31] J. Tworzydło, O. Y. Osman, C. N. A. van Duin, and J. Zaanen, Phys. Rev. B 59, 115 (1999).
- [32] Y. J. Kim et al., Phys. Rev. B 60, 3294 (1999).
- [33] M.-H. Julien et al., Phys. Rev. Lett. 84, 3422 (2000); B. Nachumi et al., ibid. 77, 5421 (1996); T. Nakano et al., Phys. Rev. B 58, 5831 (1998).