[
Flowing sand - a physical realization of Directed Percolation
Abstract
We introduce and investigate a simple model to describe recent experiments by Douady and Daerr on flowing sand. The model reproduces experimentally observed compact avalanches, whose opening angle decreases linearly as a threshold is approached. On large scales the model exhibits a crossover from compact directed percolation to directed percolation; we predict similar behavior for the experimental system. We estimate the regime where “true” directed percolation morphology and exponents will be observed, providing the first experimental realization for this class of models.
pacs:
PACS numbers: 45.70.Ht, 64.60.Ht, 64.60.Ak]
Directed Percolation (DP) is perhaps the simplest model that exhibits a non-equilibrium phase transition between an “active” or “wet” phase and an inactive “dry” one [1]. In the latter phase the system is in a single “absorbing” state; once it reaches the completely dry state, it will always stay there.
Interest in DP stems mainly from universality of the associated critical behavior. It is believed that transitions in all models with an absorbing state are in the DP universality class (unless there are some special underlying symmetries). Even though DP exponents have not yet been calculated analytically, their values were measured for a wide variety of models and are known (especially in 1+1 dimensions) with very high precision [2].
Models in the DP universality class are supposed to describe a wide variety of phenomena, ranging from catalysis to turbulence [3]; nevertheless, so far no physical system has been found that exhibits DP behavior and exponents [4]. We show here that a simple system of sand flow on an inclined plane, recently studied by Daerr and Douady (DD) [5], may well be the first physical realization of a transition in the DP universality class.
The results reported by DD present a puzzle, namely the threshold phenomenon they discovered exhibits “wet” clusters whose shapes differ from those seen in standard DP simulations; they are much more compact. The corresponding model, called Compact Directed Percolation (CDP) is unstable against perturbations towards the standard DP behavior [6]; the latter is the generic case expected to occur. Since DD did no fine-tuning to place their system in the CDP class, their observations are surprising.
This motivated us to look for a simple model, which is defined in terms of dynamic rules that can be plausibly related to the experiments and exhibits features that reproduce the experimentally observed ones. We then investigated whether the transition exhibited by such a model belongs to the DP universality class.
We propose a directed sandpile model, simpler than that of Tadic and Dhar [7]; here after each avalanche the system is reset to a uniform initial state. Our model has a transition from an inactive to an active phase, in which we see avalanches whose compact shapes reproduce the experimental observations and indeed, the resulting critical behavior is close to CDP, rather than to DP. We resolve this by showing that the CDP type critical behavior is a transient: the true critical behavior is of the DP type, but it can be seen only after a very long crossover regime. Our conclusion is that the DD experiment does serve as a possible realization of a DP-type transition. We propose here ways to shorten the crossover regime and to extend the scale on which the experiments are performed.
1 The Douady-Daerr experiment.
Glass beads (“sand”) of diameter -m [5] are poured uniformly at the top of an inclined plane (size ), covered by a rough velvet cloth; the angle of inclination can be varied. As the beads flow down, a thin layer of thickness , consisting of several monolayers, settles and remains immobile. At this thickness the sand is dynamically stable; the value of decreases with increasing angle of inclination.
For each there exists another thickness with , beyond which a static layer becomes unstable. Hence there exists a region in the plane, in which a static layer is stable but a flowing one is unstable. We can now take the system, that settled at , and increase its angle of inclination to , staying within this region of mixed stability. The layer will not flow spontaneously, but if we disturb it, generating a flow at the top, an avalanche will propagate, leaving behind a layer of thickness . These avalanches had the shape of a fairly regular triangle with opening angle . As the increment decreases, the value of decreases as well, vanishing as . This calls for testing a power law behavior of the form
| (1) |
If instead of increasing we lower the plane, i.e., go to , the thickness of our system, , is less than the present thickness of dynamic stability, . In this case an initial perturbation should not propagate, it will rather die out after a certain time (or beyond a certain size of the transient avalanche). As , we expect this decay length to grow with a power law:
| (2) |
Hence by pouring sand at inclination , DD produced a critical system, precisely at the borderline (with respect to changing the angle) between a stable regime , in which perturbations die out, and an unstable one , where perturbations persist and spread. The preparation procedure can be considered as a special kind of self-organized criticality (SOC) which differs from standard SOC models [8] in which a slow driving force (acting on a time scale much smaller than that of the system’s dynamic response) causes evolution to a critical state. Here avalanches are started by hand one by one.
To associate this threshold phenomenon with DP, denote by the percolation probability and by its critical value. We associate the change in tilt with , i.e., assume that near the angle of preparation the behavior of the sand system is related to a DP problem with . The exponent should be compared with the known values for DP and CDP. The exponent in Eq. (1) can also be measured and compared with
| (3) |
2 Definition of the model.
To write down a simple model based on the physics of the flowing sand, we adopt an observation made by DD, that in the regime of interest () grains of the top layer rest on grains of the layers below (rather than on other grains of the top layer). Hence the lower layers provide for the top one a washboard potential, as shown in Fig. 1.
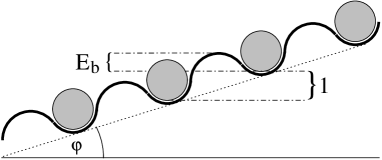
We place the grains of the top layer on the sites of a regular square lattice with row index and columns . At any given time a grain may become active if at least one of its neighbors from the row above has been active at the previous time step. If , the total energy transferred from these neighbors, exceeds the barrier of the washboard, becomes active, “rolls down” and collides with the grains of the next row. The energy it brings to these collisions is , where 1 is our unit of energy, representing the potential energy due to the height difference between two consecutive rows (see Fig. 1). A fraction of its total energy is dissipated; the rest is divided stochastically among its three neighbors from the lower row.
The model is defined in terms of two variables; an activation variable and an energy . The index denotes rows of our square lattice and time; at time we update the states of the grains that belong to row . The model is controlled by two parameters: , the barrier height, and , the fraction of dissipated energy.
The dynamic rules of our model are as follows. For given activities and energies we first calculate the energy transferred to the grains of the next row . To this end we generate for each active site three random numbers, (with ) that add up to 1. The energy transferred to grain , given by
| (4) |
determines its activation:
| (5) |
Then the energies of the next row of grains are set:
| (6) |
The three random numbers represent the fraction of energy transferred from the grain at site to the one at . We add up the energy contributions from these active sites; the fraction is not dissipated; if the acquired energy exceeds , site becomes active, rolls over the barrier and brings to the collisions (at time ) the acquired energy calculated above and its excess potential energy (of value 1).
3 Qualitative discussion of the transition and connection to the experiment.
Let us vary at a fixed value of the dissipation. For small values of an active grain will activate the grains below it with high probability; avalanches will propagate downhill and also spread sideways. For a strongly localized initial activation we should, therefore, see triangular shaped activated regions. As increases, the rate of activation decreases and the opening angle of these triangles should decrease, until reaches a critical value , beyond which initial activations die out in a finite number of time steps (or rows). These expectations are indeed borne out by simulations of the model: the dependence of on the dissipation is shown in Fig. 2.
The physics of the process is captured by a simple mean-field type approximation, in which all stochastic variables are replaced by their average values. Consider an edge separating an active region from an inactive one. At time sites to the left of and itself are wet, whereas are dry. Will site be wet or dry at the next time step? In our mean-field estimate of the answer, assuming that all wet sites at time have the same energy , the energy delivered to site at time is , where we set in Eq. (4) all . At the critical point we expect all energies to just suffice to go over the barrier; hence set . Solving the resulting equation yields a rough estimate of the transition line,
| (7) |
as shown in Fig. 2. It is easy to produce better mean-field type estimates of the transition and to compute the corresponding energy profile of the wet region [9].

To connect our model to the DD experiments note that the tilt angle tunes the ratio between the barrier height and the difference of potential energies between two rows. When the system is prepared at , this ratio is precisely . When one increases the tilt angle to , (measured in units of the potential difference) decreases and we have . As the tilt angle is now reduced, the size of increases, until it reaches its critical value precisely at . Thus increasing in the model corresponds to lowering the tilt angle towards where the system is precisely at its boundary of dynamic stability.
Hence to reproduce the experiment we were looking for (a) fairly compact triangular regions of activation for , and (b) an opening angle of these triangles which should go to zero as approaches from below.
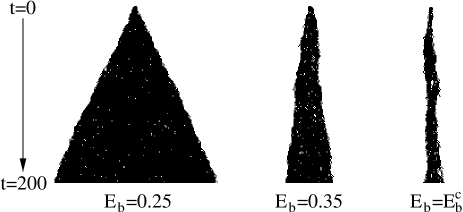
We simulated the model defined in Eqs. (4)-(6) and found that it indeed reproduces these qualitative features of the experiment (see Fig. 3). The avalanches shown were produced for dissipation , activating a single site at , to which an initial energy of was assigned. As long as was not too close to the observed avalanches were compact, triangular and with fairly straight edges. The edges became rough only very close to , such as the one shown on the right hand side of Fig. 3. The opening angle of the active regions decreased as increased towards , as indicated in in the inset of Fig. 2. From these simulations we estimated and the exponent (see Eq. (3))
| (8) |
4 Crossover to directed percolation.
The linear law (8) is consistent with the critical exponents of CDP [11]
| (9) |
These observations pose, however, a puzzle: since one believes that DP is the generic situation, one would expect to find non-compact active regions and DP exponents. In fact, according to the DP conjecture [12] any continuous spreading transition from a fluctuating active phase into a single frozen state should belong to the universality class of directed percolation (DP), provided that the model is defined by short range interactions without exceptional properties such as higher symmetries or quenched randomness. The present model has neither special symmetries nor randomness [13]; it has a fluctuating active phase and exhibits a transition, characterized by a positive one-component order parameter, into a single absorbing state. Hence the phase transition of our model should belong to the DP universality class.

In order to understand this apparent paradox we performed high-precision Monte-Carlo simulations for dissipation (see [9] for further details). We performed time-dependent simulations [14], i.e., we toppled a single grain in the center of the top row and measured the survival probability and the number of active sites . At criticality, these quantities exhibit an asymptotic power law behavior
| (10) |
In the case of CDP these exponents are given by [6, 11] and , whereas DP is characterized by the exponents [2] and . Detecting deviations from power-law behavior in the long-time limit we estimated .
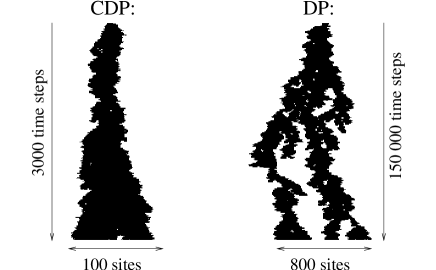
Numerical results, obtained from simulations at , are shown in Fig. 4. After a short transient the system enters an intermediate regime, which extends up to several hundred time steps. Here the active sites form a single cluster and we observe power-law behavior with CDP exponents (dotted lines in Fig. 4). This intermediate regime is followed by a long crossover from CDP to DP, extending over almost two decades up to more than time steps, after which the system enters an asymptotic DP regime (indicated by dashed lines in Fig. 4).
Compared with ordinary DP lattice models, this crossover regime is extremely long. We observed that by increasing the crossover time can be reduced by more than one decade. Hence, for an experimental verification of DP, systems with high dissipation are more appropriate. The present experiments correspond to about 3000 time steps (rows of beads); increasing this to about by using a longer inclined plane and smaller beads should yield DP behavior, provided that deviations of the experiment from the model do not increase with system size.
The crossover from CDP to DP is illustrated in Fig. 5. Two avalanches are plotted on different scales. The left one represents a typical avalanche within the first few thousand time steps. As can be seen, the cluster appears to be compact on a lateral scale up to 100 lattice sites. However, as can be seen in the right panel of Fig. 5, after very long time the cluster breaks up into several branches, displaying the typical patterns of critical DP clusters. Thus, before measuring critical exponents, this feature has to be tested experimentally. To this end the DD experiment should be performed repeatedly at the critical tilt . In most cases the avalanches will be small and compact. However, sometimes large avalanches will be generated which reach the bottom of the plate. If these avalanches are non-compact, we expect DP-type asymptotic critical behavior. Only then is it worthwhile to optimize the experimental setup and to measure the critical exponents quantitatively.
AJD thanks the CICPB and the UNLP, Argentina and the Weizmann Institute for financial support. HH thanks the Weizmann Institute and the Einstein Center for hospitality and financial support. ED thanks the Germany-Israel Science Foundation for support, B. Derrida for some most helpful initial insights and A. Daerr for communicating his results at an early stage.
REFERENCES
- [1] W. Kinzel, in Percolation Structures and Processes, ed. G. Deutscher, R. Zallen, and J. Adler, Ann. Isr. Phys. Soc. 5 (Adam Hilger, Bristol, 1983), p. 425.
- [2] I. Jensen, J. Phys A 32, 5233 (1999).
- [3] Y. Pomeau, Physica D 23, 3 (1986).
- [4] P. Grassberger, Directed percolation: results and open problems, preprint WUB 96-2 (1996), unpublished.
- [5] S. Douady and A. Daerr, Physics of Dry Granular Media, H. J. Herrmann et al., eds., p. 339, Kluwer Academic Publishers, NY (1998); A. Daerr and S. Douady, Nature 399, 241 (1999).
- [6] E. Domany and W. Kinzel, Phys. Rev. Lett. 53, 311 (1984).
- [7] B. Tadic and D. Dhar, Phys. Rev. Lett. 79, 1519 (1997).
- [8] P. Bak, C. Tang and K. Wiesenfeld, Phys. Rev. Lett. 59, 381 (1987).
- [9] H. Hinrichsen, A. Jiménez-Dalmaroni, Y. Rozov, and E. Domany, in preparation.
- [10] J. P. Bouchaud and M. E. Cates, Granular Matter 1, 101 (1998).
- [11] R. Dickman and A. Yu. Tretyakov, Phys. Rev. E 52, 3218 (1995).
- [12] H. K. Janssen, Z. Phys. B 42, 151 (1981); P. Grassberger, Z. Phys. B 47, 365 (1982).
- [13] The experimental system is random, but we have shown, using the standard field-theoretic formulation of DP, that this type of randomness is irrelevant.
- [14] P. Grassberger and A. de la Torre, Ann. Phys. (NY) 122, 373 (1979).