[
Skyrmion Dynamics and NMR Line Shapes in QHE Ferromagnets
Abstract
The low energy charged excitations in quantum Hall ferromagnets are topological defects in the spin orientation known as Skyrmions. Recent experimental studies on nuclear magnetic resonance spectral line shapes in quantum well heterostructures show a transition from a motionally narrowed to a broader “frozen” line shape as the temperature is lowered at fixed filling factor. We present a Skyrmion diffusion model that describes the experimental observations qualitatively and shows a time scale of for the transport relaxation time of the Skyrmions. The transition is characterized by an intermediate time regime that we demonstrate is weakly sensitive to the dynamics of the charged spin texture excitations and the sub-band electronic wave functions within our model. We also show that the spectral line shape is very sensitive to the nuclear polarization profile along the axis obtained through the optical pumping technique.
pacs:
73.40.Hm, 76.60-k, 67.80.Jd, 73.20.Mf, 76.60.Cq]
I INTRODUCTION
In the presence of a strong magnetic field, a two-dimensional interacting electron gas (2DEG) exhibits many different quantum states depending on field strength, electron density, and disorder. At Landau level filling factor , when the number of electrons is equal to the number of available Landau orbitals in the lowest Landau level, the 2DEG is in an itinerant ferromagnetic state where all the electron spins are aligned with the magnetic field.[1] The novel features of this quantum Hall ferromagnet (QHF) state originate from the relative strength of the electron-electron Coulomb energy, , and the Zeeman energy, , which are of order 160 K and 3 K respectively in typical experimental situations. [2] The Pauli exclusion principle combined with the overwhelming cost of Coulomb excitations makes the single-particle spin- electron excitation gapped at filling factor . The low energy (but still gapped) charge excitations of the system are Skyrmion spin textures containing many (4-30) flipped spins and are topologically stable.[1] By paying the lower Zeeman price the spins can align locally creating a more advantageous charge distribution that lowers both the Hartree and exchange Coulomb cost with respect to a single spin flip excitation. Because these excitations are the cheapest way to introduce charge into the system, they are present in the ground state of the system at filling factors close to .[1, 3] This produces a rapid reduction of the electron spin polarization away from which is observed in experiments. [2]
The probe of choice to study the electron spin polarization of the 2DEG is nuclear magnetic resonance (NMR). Measurements of the Knight shift, which is linearly proportional to the electron spin polarization, have unambiguously proven the existence of these exotic topological charge excitations.[2] However, this rich probe keeps providing us with more surprising information about the Skyrmions, continuously challenging the theory of QHF. Recent experiments carried out by N. N. Kuzma et al., [4] using optical pumping techniques to enhance the NMR signal of the 2DEG, have focused on the NMR line shape as a function of temperature and filling factor near (which is also a QHF state). The observed free induction decay signals show a large dependence of the electron polarization on filling factor, indicating that charged spin excitations are more important near than previously expected from theory.[5] Near this filling factor, as the temperature is lowered, the Knight shift increases with decreasing temperature (although having a local minimum) until it reaches a saturation level at very low temperatures. The spectral line shape ranges from the motionally narrowed regime, where the polarization shows a sharp peak due to the average polarization seen by each nucleus, to the frozen [6] regime, where the peak is much broader due to the presence of frozen spin textures in the ground state and the nuclei seeing different electron polarizations depending on their location. The interesting regime is the intermediate one where the dynamical time scale of the Skyrmions is comparable to the inverse frequency of the Knight shift. This is the regime which contains the greatest wealth of information about Skyrmion dynamics. The situation is complicated by the fact that the Knight shift varies strongly with position in the direction across the quantum well. Nuclei at the edges of the well see a lower electron density and hence a smaller Knight shift. As a result, these nuclei can still be in the motionally narrowed regime when nuclei in the center of the well are already close to the frozen regime. This subtlety is taken into account in our analysis.
Because the spin stiffness at is so small [7] the Skyrmions will be very small and the continuum field theoretic approach will be poorly controlled. We therefore focus on the case of filling factors near where measurements are currently underway. [8],[9] We present a simple model for the Skyrmion dynamics near in this paper. We find that the spectral line shape, besides being dependent on the transport relaxation time of the Skyrmions, is very sensitive to the nuclear spin polarization density along the direction and, to a lesser extent, the electron density profile in the z-direction.
We organize this paper as follows. In Sec. II we introduce the theoretical background needed for our model calculations. In Sec. III we present our model and results. In Sec. IV we discuss the implications of the results and possible new outlooks on this problem.
II THEORY
In the free induction decay NMR experiments, after the nuclei in the wells are polarized by optical pumping,[2],[10] the nuclear spins are tipped by a pulse and allowed to precess freely. [2, 4] These spins will precess at the Larmor frequency produced by the local magnetic field. This local magnetic field is composed of the external one plus a contribution from the electron polarization due to the Fermi contact hyperfine coupling which enters the nuclear spin Hamiltonian in the same way as the external magnetic field [11]
| (1) |
where is the nuclear magneton, is the nuclear spin in units of at position , is the applied magnetic field, and is the effective local magnetic field contribution due to the electronic polarization with and being the spin and position of the th electron.
The last term in eq. (1) is the one responsible for the observed Knight shift. For the purposes of computing the Knight shift, it is adequate to replace by its expectation value
| (2) |
where is the electron envelope function obtained from a self-consistent local spin-density approximation calculation, and is the average electron spin polarization at position for a given filling factor and temperature. If we assume that the electron envelope function is only a function of (the growth direction) we can further parameterize the local Knight shift as , where is the electron density along the z-direction (normalized to unity at its maximum) and is a constant that can be fitted to the experimental spectra at the lowest temperatures.
Next, we must connect these expressions to the observed intensity spectrum , which is the time Fourier transform of the induced voltage produced in the tipping coil due to the precessing nuclear spins in the quantum wells. In the absence of in-plane spin nuclear decay, for a given nuclear spin, the time evolution of the spin’s expectation value (relative to the evolution with zero Knight shift) is given by
| (3) | |||||
| (4) |
where now we have allowed the electronic polarization to vary with time. [11, 12] The induced voltage is proportional to the time derivative of , which is approximately whenever , with being the bare nuclear precession rate. However, for nuclear spins in a solid the in-plane magnetization decays as a gaussian due to nuclear dipole-dipole interactions. This yields the final expression for the intensity
| (5) |
where is the polarization density of nuclear spins (not the number density of nuclei), and with being the full width half maximum (FWHM) of the unshifted NMR signal. In the samples used in the experiments , and therefore . Any model describing the observed spectra has to contain realistic estimates of , , and . Of these three the first two are the ones that have been studied most extensively. [3, 7, 13, 14]-[18] In a previous model presented by Kuzma et al. [4] to describe the transition near , a two polarization model for was used, and and were approximated by sinusoidal shapes. Here we attempt to improve upon this model by carefully examining the approximations used for each quantity.
At zero temperature , the electron polarization, is exactly unity at as mentioned in section I. However, as the filling factor goes away from from , Skyrmions begin to appear in the ground state of the system. These charged spin texture excitations reduce the polarization locally and a realistic approximation for the shape of the Skyrmion is needed to obtain a reasonable . There have been many studies on the shape of the Skyrmions. [3, 7, 13, 14]-[18] Most analytical approaches describing the Skyrmion excitations have taken the route of effective field theories such as the modified O(3) non-linear sigma model (NL), [14] where a Zeeman term and a Coulomb interaction term are inserted in the classical NL model. [3, 7, 15] The magnetization profile of a Skyrmion obtained from this theory, in the limit of zero Zeeman energy, is given by
where determines the size of the Skyrmion, and is the projection of on the plane (denoted by henceforth). At larger distances away from the Skyrmion’s center the Zeeman term dominates and the magnetization goes as , with near . [15] This analytical approach has been very successful in explaining qualitatively the physics of the QHF, however it has not been able to predict quantitatively the shape of the Skyrmion excitations at experimentally accessible parameters. In GaAs/AlxGa1-xAs heterostructures, at around 10 T, the number of spin flips, , per unit charge introduced near is [2] . Single Skyrmion microscopic calculations using techniques such as Hartree-Fock[16] (HF), exact diagonalization, and variational wave functions,[17] have been more successful at obtaining quantitative agreement with experiments. These, however, are not as transparent as the classical model in describing the physics behind the excitations. Also, Brey et al. [18] have performed HF calculations of the skyrme crystals formed at filling factors near which most accurately describe the spin polarization observed in experiments. [2, 18] The failure of the NL model to predict the correct Skyrmion shape for small originates in the truncation of the gradient expansion. The HF calculations are in essence self-consistent mean field calculations with the order of the gradient expansion taken to infinity and hence are more successful at predicting the small Skyrmions that change shape on a much shorter length scale. [17] As described in the next section, we use a phenomenological form for fitted to the Hartree Fock calculations.

The electron density along the z-direction , is obtained from the electronic spin-split energy levels of the GaAs heterostructures in the presence of a strong tilted field (as is used in the experiments). These charge distributions are calculated using a local spin-density approximation. The density profiles of the two spin states and two lowest levels, measured with respect to the valence band for a -wide GaAs single quantum well, are shown in Fig. 1. The parameters have been chosen to match the experiments [2] done near .
The nuclear polarization profile estimate , comes from considering the experimental set up. After a train of rf pulses which destroys the thermally induced nuclear polarization, the sample is radiated with circularly polarized light tuned to the band gap in the well. This excites 100% polarized electrons to the lowest unoccupied level (spin down) and in the recombination process the nuclear system absorbs part of the angular momentum transferred to the sample. Hence, the optical pumping can produce an enhancement in the nuclear polarization by as much as a factor of 100.[2] This optical pumping is necessary, at least at higher temperatures, to make the NMR signal visible. The problem is that, even though the initial excitation process is understood, the recombination process is much more complicated. In such a process, Skyrmions and anti-Skyrmions are being created constantly and this may have an effect on the nuclear polarization profile which is not well understood at present.
One may ask why at such low temperatures (1.6 K) and being so deep in the insulating phase of the quantum Hall state one can even observe motional narrowing of the NMR line shapes. We can answer this question in reverse. Given the information from the experiments,[2, 4] what longitudinal resistivity can we infer? The onset of the frozen regime indicates that and , with D being the diffusion constant, and the density of Skyrmions and electrons respectively, and the disorder broadening of the Landau level which can be estimated to be at least of the order of K and is possibly much larger. [19] This information can be inserted in the Einstein relation for the conductivity
| (6) | |||||
| (7) |
which gives a lower bound on the inverse conductivity . Hence, we see that the dynamics of the Skyrmions can appear to be fast on the NMR time scale even deep in the insulating regime.
III THE MODEL AND RESULTS
When calculating the spectral intensity from eq. (3) it is useful to first think about the different time scales in the problem and how relevant each one is in calculating the NMR spectral line shape. At the experimental fields used (7.05 T) the bare nuclear precession rate is of order 100 MHz, the extra precession rate created by the electron spins (the Knight shift) is of order 20 KHz, the nuclear spin-lattice relaxation rate ranges from 4 mHz to 45 mHz, and the in-plane spin relaxation rate due to the nuclear dipolar coupling is approximately 3.5 KHz.[2] Hence, in the calculations that follow, we shall ignore the spin-lattice relaxation rate and place our zero of frequency at the bare NMR resonance. Furthermore, since we assume perfect cubic symmetry of the GaAs crystal, we omit any effects on the spectral calculation due to any nuclear quadruple splitting.
Rather than doing a full microscopic calculation for in the presence of disorder, we take a more modest aim and focus on the transition where the spectral line shape goes from the frozen regime to the motionally narrowed regime. For the ground state of the 2DEG at is believed to be in a skyrme square lattice state. [18] In practice, the skyrme lattice is melted in most of the accessible temperature ranges. [15, 20] However, at the low experimental temperatures considered here (T K), although the long length scale correlations vanish, we expect the short length scale correlations to contain crystal-like features. To model this we introduce a Skyrmion square lattice with the unit cell size given by the appropriate filling factor. We take the magnetization profile of the Skyrmion to be:
which, by choosing and appropriately, can resemble closely the HF calculations previously done.[16] For we used and . Although in the HF calculations due to the zero point fluctuations, we find that this has little effect on the spectral line shape, and we hence keep our simpler functional form in the model calculations. Also, in any experimental situation, the part of the spectrum due to this small region of fully reversed spins tends to be weak. To model the time dependence of , instead of allowing the Skyrmions to undergo correlated thermally induced motion about their lattice points, we make the whole lattice move together to simplify the numerical calculations. Hence, the lattice is only allowed to move collectively in a random walk by performing a jump of average distance with a probability in the time interval to . The diffusion time across a unit cell of size , , is held constant for a given temperature and and are varied to test the sensitivity of the spectral line shape to the microscopic details of the dynamics. The motionally narrowed regime occurs when and each nucleus experiences the average electron polarization in the sample. In the limit the Skyrmions are spatially frozen on the experimental time scale, with random motion being rare. This frozen regime of the spectral line shape, observed at the lowest temperatures, contains information on the actual shape and static distribution of the Skyrmion excitations and the nuclear density profile. The intermediate regime, , occurs when the FWHM of the spectrum reaches its peak value. In this regime we find the greatest sensitivity of the line shape to the choice of for a fixed .
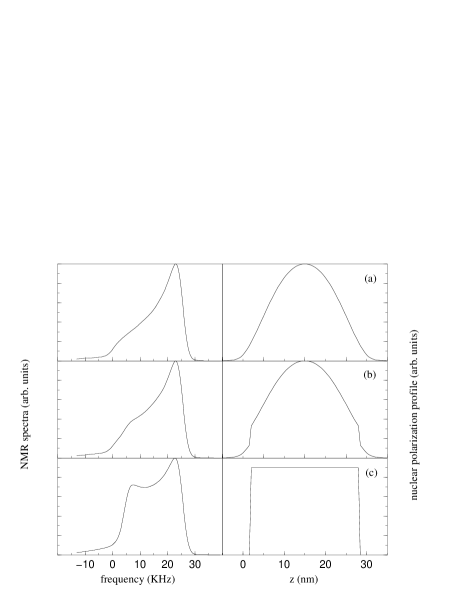
The adjustable parameter , is fixed by fitting the peak frequency of the spectral line shape to the one observed experimentally in the frozen regime. The temperature is gauged by and calibrated by the onset of the motionally narrowed and frozen regimes observed in the experiments. We approximate the nuclear magnetization density by the electronic density from the lowest unoccupied level (E1 in Fig. 1), since the induced polarization due to optical pumping is proportional to the local electronic density of the electrons excited in such process. [10] This gives a much more accurate profile than the ones approximated by simple sinusoidal shapes. [4] One striking result of our model is the high sensitivity of the spectral line shape to the nuclear magnetization density. This sensitivity is illustrated in Fig. 2 where we show different spectral line shapes at for several nuclear polarization profiles. This result strongly suggest that the details of the line shape will be difficult to understand from first principles without a better microscopic understanding of the optical pumping process and its effect on the nuclear polarization profile, together with other processes that may be affecting this profile.
In Fig. 3 we show the spectral line shapes at different diffusion times (temperatures). The maximum FWHM is obtained between 40 and 50 s. Also, note that , which corresponds to the maximum in the spectra, decreases monotonically as the temperature (or ) increases. It is important to note that at temperatures where the Skyrmion dynamics begin to ‘freeze’ in the NMR time scales, the peak of the spectrum (what is usually understood by the Knight shift) is no longer a good measure of the global average electron polarization, . Instead, in order to avoid dynamic effects, one should measure the first moment of the spectra when measuring , since
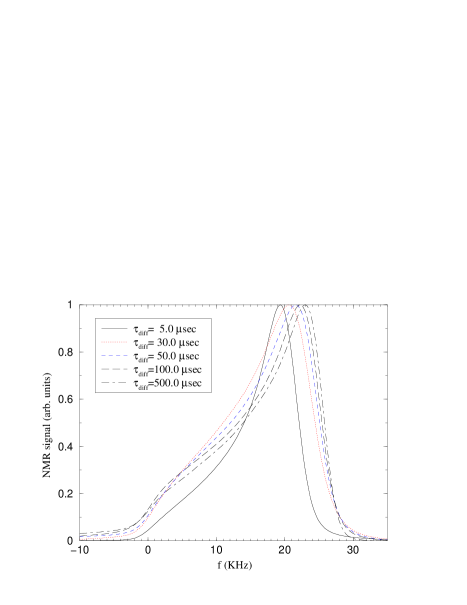
| (8) |
where here we have rather than as used in Fig. 3 and 4.
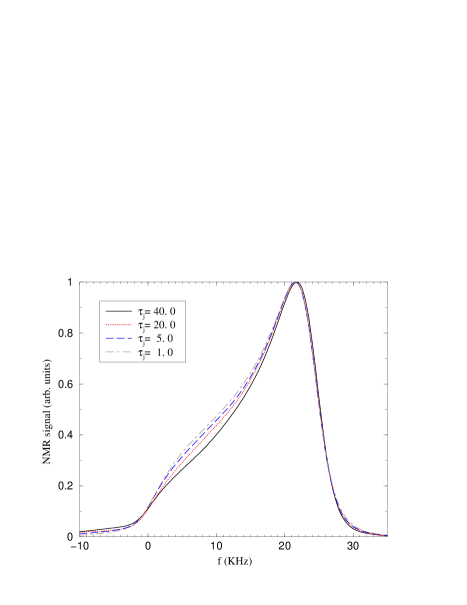
The sensitivity of the line shape to the choice of at (corresponding to the maximum FWHM) is shown in Fig. 4. This sensitivity, although weak, is completely absent at other ’s in the other regimes.
IV CONCLUSION
Our model illustrates qualitatively the behavior of the NMR spectra as a function of temperature for K. It accurately predicts a peak in the FWHM as a function of temperature. It also shows a monotonic increase of the Knight shift with decreasing temperature, reaching a plateau at the lowest temperatures (largest ), however, it does not reproduce the local minimum in the Knight shift as a function of temperature observed near . [4] Since the spin stiffness near is very small, we do not expect this model to be valid near such filling factor, where the Skyrmions are small and not well understood as is the case near .
We have also demonstrated that a full understanding of the NMR line shape must involve a better understanding of the nonequilibrium nuclear polarization profile. This profile is affected primarily by the optical pumping and possibly by other thermal relaxation processes. We also have shown that to measure the behaviour of the average electron polarization at these temperatures, one must measure the first moment of the intensity spectrum rather than its peak. We emphasize that our model does not attempt to calculate the highly quantum-mechanical motion of the Skyrmions. This motion may involve a semi-classical percolation in the case of heavy nonlocalized Skyrmions or variable range hopping in the case of highly localized Skyrmions in a random potential. Our phenomenological model does capture the appropriate time scales in the experiments which should be an essential result of a more sophisticated treatment of the problem.
The authors would like to thank René Côté and M. Abolfath for providing the HF data for comparison, and Allan MacDonald, S.E. Barrett, S. Melinte, V. Bayot, and S. Das Sarma for helpful discussions. This work was supported by grant NSF DMR 9714055, by grant INT-9602140, by the Ministry of Education of the Czeck Republic under grant ME-104 and by the Grant Agency of the Czeck Republic under grant 202/98/008J.
REFERENCES
- [1] For an introduction to Skyrmions and related topics see S.M. Girvin, The Quantum Hall Effect: Novel Excitations and Broken Symmetries in Les Houches Summer School 1998 (to be published by Springer Verleg and Les Editions de Physique, 1999), and references therein. S.M. Girvin and A.H. MacDonald, in Perspectives in Quantum Hall Effects: Novel Quantum Liquids in Low-Dimensional Semiconductor Structures, edited by S. Das Sarma and A. Pinczuk (Wiley, New York, 1997).
- [2] R. Tycko, S. E. Barrett, G. Dabbagh, L. N. Pfeiffer,and K.W. West, Science 268, 1460 (1995); S. E. Barrett, et al. Phys. Rev. Lett. 74, 5112 (1995).
- [3] S.L. Sondhi, A. Karlhede, S.A. Kivelson, and E.H. Rezayi, Phys. Rev. B. 47, 16419 (1993).
- [4] N.N. Kuzma, P. Khandelwal, S.E. Barret, L.N. Pfeiffer, and K.W. West, Science 281, 686 (1998); P. Khandelwal, et al. Phys. Rev. Lett. 81, 673 (1998)
- [5] R.K. Kamilla, X.G. Wu, and J.K. Jain, Solid State Comm. 99 , 289 (1996).
- [6] Here “frozen” is understood as having a dynamical scale much longer than the one in the experiments.
- [7] K. Moon, H. Mori, K. Yang, S.M. Girvin, A.H. MacDonald, L. Zheng, D. Yoshioka, and S.-C. Zhang, Phys. Rev. B 51, 5138 (1995).
- [8] S.E. Barrett, private communication.
- [9] S. Melinte and V. Bayot, private communication.
- [10] S.E. Barrett, R. Tycko, L.N. Pfeiffer, and K.W. West, Phys. Rev. Lett. 72 1368 (1994).
- [11] C.P. Slichter, Principles of Magnetic Resonance (Springer-Verlag, New York, ed. 3, 1990).
- [12] Here we assume the spin lines up along the x-direction after the pulse. Also, we are neglecting any transient in-plane electronic polarization which can be shown to give a negligible contribution to the spectral line shape.
- [13] Kyungsun Moon and Kieran Mullen, Phys. Rev. B 57, 14833 (1998).
- [14] R. Rajaraman, Solitons and Instantons (North-Holland, Amsterdam, 1989).
- [15] C. Timm, S.M. Girvin, and H.A. Fertig, Phys. Rev. B 58, 10634 (1998).
- [16] H. A. Fertig, L. Brey, R. Cote, A.H. MacDonald, A. Karlhede, and S. L. Sondhi, Phys. Rev. B 55, 10671 (1997); H.A. Fertig, L. Brey, R. Cote,and A.H. MacDonald, Phys. Rev. B 50, 11018 (1994).
- [17] M. Abolfath, J.J. Palacios, H.A. Fertig, S.M. Girvin, and A.H. MacDonald, Phys. Rev. B 56, 6795 (1997).
- [18] L. Brey, H.A. Fertig, R. Cte, and A.H. MacDonald, Phys. Rev. Lett. 75, 2562 (1995).
- [19] S. Das Sarma and F. Stern, Phys. Rev. B 32, 8442 (1985); S. Das Sarma and X.C. Xie, Phys. Rev. Lett. 61, 738 (1988); X.C. Xie, Q.P. Li, and S. Das Sarma, Phys. Rev. B 42, 7132 (1990).
- [20] R. Cte, A. H. MacDonald, L. Brey, H.A. Fertig, S.M. Girvin, and H.T.C. Stoof, Phys. Rev. Lett. 78, 4825 (1997).