Threshold effect during dissolution of 3He inclusions in solid 4He
Threshold effect during dissolution of
3He inclusions
in solid 4He
Abstract
A pressure jump has been found at the onset of the dissolution of bcc inclusions in separated solid 3He - 4He mixture if the crystal is overheated above a certain critical value. This effect can be explained in the framework of a multistage dissolution process model.
PACS numbers: 67.80.Gb, 64.70.Kb.
1 INTRODUCTION
The interest in the investigation of the phase separation kinetics of solid 3He - 4He mixtures has been remaining for a long time. This interest is stimulated by the prospect to discover new additional features of the 3He impurities quantum motion in solid helium. In particular, the diffusion coefficient of impurities during the phase separation can differ from one measured in NMR experiments in a homogeneous crystal due to the influence of a finite concentration gradient and the distinction of U-processes contribution. However, the available experimental data on the phase separation kinetics appear to be badly reproducible and do not allow one to make any comparisons with the results obtained in the study of the quantum diffusion.
A good reproducibility of the experimental data was attained quite recently. [1, 2] The correlation was established between the results obtained in the investigation of the separation kinetics and in the NMR experiments in a homogeneous mixture [1]. Nevertheless, it was shown in [2, 3] that the correlation of these data has a more complicated character. The impurity motion mechanism during the separation of solid 3He - 4He mixtures remains uncertain. This calls for continuing the investigation and in particular clearing up the bcc phase inclusions dissolution kinetics, which has been scarcely studied. The revealed in [2] essential difference between inclusions growth and dissolution processes adds interest to such investigations.
This work is devoted to a detailed investigation of the 3He inclusions dissolution, which takes place at sharp warming the separated solid mixture.
2 KINETICS OF DISSOLUTION OF 3He INCLUSIONS IN 4He MATRIX
The time dependences of the pressure at a constant volume in a sample after heating has been measured. The experimental setup and technique are discussed in detail in [2]. The initial concentration of the mixture was 2.05 % of 3He. The molar volume of the sample before separation was 20.44 cm3/mole ( bar). All the experiments were carried out with the sample after stabilization of its properties by the many times repeated cycles of the inclusions growth (at mK) and dissolution (at mK) with achievement of equilibrium at each temperature.
The main set of experiments included measurements of dependences P(t) at sharp (within several seconds) heating of the sample from the same initial temperature 103 mK to various final temperatures mK. Results are partially presented in Fig.1. The shape of these curves is essentially conditioned by the value of . On small heating (Fig.1a) the pressure change proved to be exponential as in the most of experiments on the separation kinetics of solid 3He - 4He mixtures:
| (1) |
where is difference of equilibrium pressure values in the sample at the initial and final temperatures.
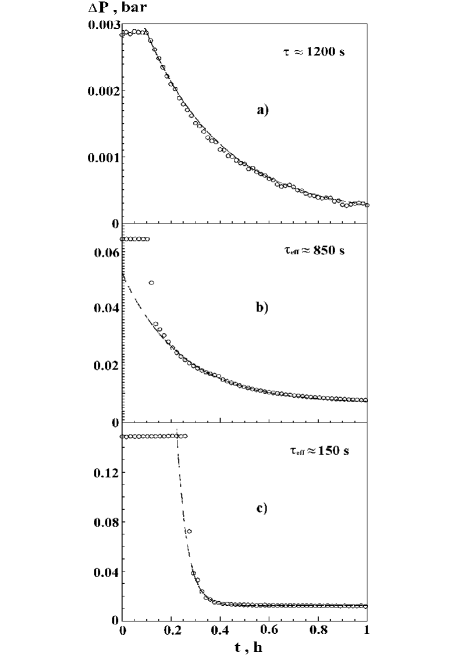
At intermediate values of mK (Fig.1b) two different parts of the dependence P(t) are observed: almost vertical part (corresponding time is of the order of the time of reaching thermal equilibrium) and smoother one described by the time constant , which is of the same order as that observed at small . The time constant is some effective value obtained at fitting the smooth part of P(t) by one exponent. In fact, this portion of can be described by two exponents within our experimental accuracy. And finally, the pressure relaxation occurs very fast at high temperatures of (Fig.1c).
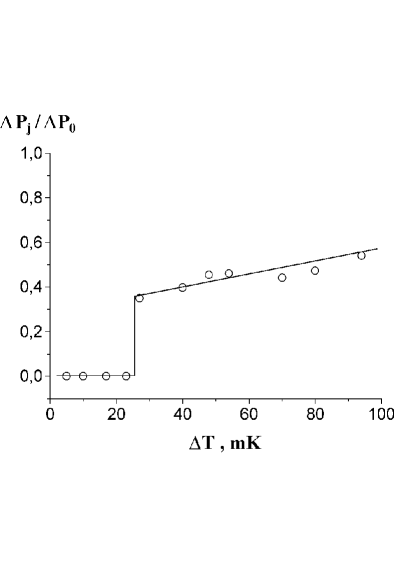
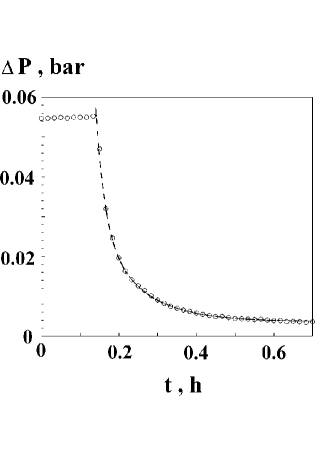
The ratio of the pressure jump to the total pressure change versus is of threshold character (see Fig.2). A pressure jump appears at some critical value . However, the obtained value mK is likely to be characteristic only of mK. As it has been found in two experiments carried out with this sample that at warming the crystal from 150 mK to 230 mK the dissolution occurs without a pressure jump (see Fig.3) in spite of the fact that the value of is essentially more than 25 mK. From these two experiments it follows that it makes no sense to consider a critical chemical potential difference since in this case it is several times larger than that corresponding to the obtained .
3 MODEL OF THE DISSOLUTION PROCESS
It is possible to explain qualitatively the observed effects, assuming that the 3He inclusions dissolution process consists of several stages. The essential feature of this model is the presence of a strain layer in the vicinity of the inclusions boundary due to the great difference between molar volumes of the inclusions and the matrix. The elastic potential gradient appearance may result in the mismach of energy levels in neighboring lattice sites and a restriction on impuritons quantum diffusion [4]. In particular, this circumstance is revealed at low temperatures when the effective diffusion coefficient, which characterizes the separation process, turns out much less than the quantum diffusion coefficient measured in NMR experiments [3]. Therefore, quick enough substance transport near the droplets is possible only after the elimination of the strain layer.
It can be realized at the first stage of the process, when the 3He inclusions saturation with 4He atoms occurs. The diffusion penetration of 4He inward the 3He inclusion, considered as a sphere of radius , will occur for the characteristic time
| (2) |
where the corresponding diffusion coefficient describes 4He atoms transport in solid 3He by random tunnel jumps. may be presented as [4]
| (3) |
where is the distance between the nearest neighbours and is the exchange integral, which characterizes the tunneling frequency of 4He atoms in 3He matrix. One would expect the magnitude of to be close to the tunneling frequency of 3He in 4He crystal , which is precisely determined in quantum diffusion experiments. Extrapolating well-known values [5] of to the molar volume cm3/mole, which is characteristic of droplets, one can find s-1. It gives the magnitude of cm2/s. Then, for m (data of S.C.J. Kingsley et al.[6]) we obtain s.
Hence, the first stage of the dissolution is very fast. But the pressure change at this stage must be very small because it is proportional to the product of the concentration change of 4He in a droplet (according to the separation phase diagram [8]) times the volume fraction occupied by the inclusions. The corresponding value of is estimated to be not larger than 2% of the full pressure change .
Nevertheless, this stage can strongly affect the droplets dissolution process. When leaving a strained layer around droplets, 4He atoms destroy it and make, therefore, possible free motion of the impuritons, which determines the second stage of the process. The characteristic time for this stage is determined by the velocity of the 3He atoms egress from inclusions which can be estimated by analogy with evaporation of liquid. The number of atoms, evaporating from a unit of surface per unit of time, is determined by [7]
| (4) |
where is the mean velocity of atoms in vapor and is density of the atoms.
In our case (see[4]) ( is impuritons bandwidth in hcp phase). The density of 3He atoms in mixture , which is proportional to the concentration, serves as .
| (5) |
where is density of the atoms of the mixture.
Then, it is possible to find out evaporation time for a droplet of radius , neglecting the difference in molar volumes of the inclusions and surrounding mixture
| (6) |
and assuming in Eq.(6) m (data of S.C.J.Kingsley et al.[6]), s-1 (from [5]) and % (from separation phase diagram[8]) gives s. This stage turns out quick enough too.
The spherical layer, which is rich in 3He, is formed around the droplet after this stage. For % 3He the mean free path of 3He impuritons in the mixture will be (from [9]). The formation of such a layer with the estimated thikness of the order of several ( cm) can provide the value of the pressure jump observed in the experiment. One can see from Fig.2 that , where the full pressure change is proportional to the concentration change after heating the two-phase crystal of . According to the phase separation diagram [8] % 3He for . So, about 10 % of the 3He atoms in the crystal transfer from the inclusions to the matrix and this leads up to the pressure decrease . Therefore, the observed jump can be provided by only about 4 % 3He atoms.
The propagation of 3He on a larger distance should occur by diffusion due to the great probability of U-processes at impuritons collisions. The characteristic time for this third stage of the dissolution will be of the same order of magnitude as that obtained in other situations of the phase separation of solid 3He - 4He mixtures (see, for example, [3]).
The threshold effect in the proposed model takes place when the strain layer around the 3He droplet preventing diffusion is completly eliminated as a result of the first stage, namely the dissolution of 4He. Since the quantity of dissolved 4He is uniquely determined by the equilibrium concentration difference at the initial and at final temperatures, the critical conditions correspond to such a difference of temperatures at which the concentration difference provides the full elimination of the strain layer.
The equilibrium 4He concentration difference in the inclusion at the final temperature 130 mK, which corresponds to the critical pressure jump and the initial temperature mK is about 0.2 %. The spherical layer of thickness cm must be dissolved in the inclusion for providing such a value of the concentration difference. The critical value is achieved by dissolution of 34 atom layers. It is a value reasonable enough value for the layer thickness in which the quantum diffusion may be impeaded. It should be pointed out that dissolution of 4He is connected with decreasing density, and it provides some additional removal of strains.
The second necessary condition to observe the pressure jump is a impuritons long mean free path in the mixture at the initial concentration (temperature). The result of the above mentioned experiments with the sample warmed from 150 mK testifies in favor of this confirmation. The equilibrium concentration of 3He at 150 mK is about one order of magnitude more than that at 100 mK. Accordingly, the mean free path of impuritons is of the same times less, and the process of inclusions ”evaporation” cannot cause the perceptible pressure jump. Apparently it speeds up dissolving the inclusions essentially and provides the effect comparable with the following diffusion as a result the dependence of turns out a sum of two exponents, which is illustrated in Fig.3.
4 CONCLUSION
Thus, dissolving droplets under heating from mK to mK can be considered to consist of three stages: 4He dissolution in bcc 3He inclusion, which removes the strain layer around the droplet; formation of a rich 3He region around the inclusion; diffusion dissolution of 3He. The first and the second stages last for several seconds, but the third one lasts for about the time observed in other cases.
The first stage of the process will not have the above indicated concentration limitation and can provide the perceptible pressure change under higher overheating, when the sample is outside the phase separation region. It has been confirmed experimentally that in this case dependence is described by a sum of two exponents.
Unequal processes of the droplets growth and dissolution [2] are natural enough in the context of the considered model because the first of them includes only the slowest stage. In doing so, the quantum diffusion process turns out restricted at the expense of the strain layer near the droplet boundary. In this connection it should be noted that the lack of the sharp pressure jump in the experiment on dissolving the droplets, which is illustrated in Fig.6. in [2], is related with warming the sample much slower (as compared with the procedure used in the present work).
At present the experimental data which contradict the supposed dissolution model are obviously unknown. One will be able to say with a fair degree of confidence about its reality only after the verification of predictions made on its basis. Such predictions may be the following: expected decrease in the pressure jump and gradual disappearance of this jump owing to reducing the mean free path of impuritons at increasing ; increase in the value of for the liquid 3He droplets (at a lower pressure). It must cause increasing the strain near the droplet boundary due to the density difference enhancement.
Our experiments will be continued in this direction. A theoretical treatment of the questions considered would be desirable.
ACKNOWLEDGMENTS
The discussions with A.F. Andreev, Yu.M. Kagan, and K.E. Nemchenko are gratefully acknowledged. This work has been supported in part by the International Program on Science and Education (Grants QSU 082169 and QSU 082048).
References
- [1] V.A. Shvarts, N.P. Mikhin, E.Ya. Rudavskii, A.M. Usenko, Yu.A Tokar, and V.A. Mikheev, Fiz. Nizk. Temp. 21, 717 (1995) [Low Temp. Phys. 21, 556 (1995)].
- [2] A.N. Ganshin, V.A. Maidanov, N.F. Omelaenko, A.A. Penzev, E. Ya. Rudavskii, and A.S. Rybalko, Fiz. Nizk. Temp. 24, 815 (1998) [Low Temp. Phys. 24, 611 (1998)].
- [3] A.N. Ganshin, V.A. Maidanov, N.F. Omelaenko, A.A. Penzev, E. Ya. Rudavskii, and A.S. Rybalko, Fiz. Nizk. Temp. 24, 1117 (1998).
- [4] A.F.Andreev and I.M. Lifshits, JETP 56, 2056 (1969); Ju. Kagan and M.I. Clinger, Phys. C 7, 2791 (1974).
- [5] V. N. Grigor’ev, Fiz. Nizk. Temp. 23, 5 (1997) [Low Temp. Phys. 23, 1 (1997)].
- [6] S.C.J. Kingsley, V. Maidanov, J. Saunders, and B. Cowan, J. of Low Temp. Phys., 113, 1017 (1998).
- [7] Ya.I. Frenkel, Kinetic theory of liquids [in Russian] (Academy of Science of the USSR, Moscow-Leningrad, 1956).
- [8] D.O. Edwards, S. Balibar, Phys. Rev. B, 39, 408 (1989).
- [9] A. R. Allen, M. G. Richards, and J. Schratter, J. of Low Temp. Phys. 47, 289 (1982).