Linear and non-linear dielectric spectroscopy
on ammonium doped Rochelle salt
U. Schneider, P. Lunkenheimer, J. Hemberger and A. Loidl
Experimentalphysik V, Universität Augsburg, D-86135 Augsburg, Germany
Abstract In this work we present a thorough investigation of the mixed system of Rochelle salt doped with ammonium, with for [NaKNHC4H4OH2O]. This interesting system is known to exhibit a rich phase diagram with a variety of polar and non-polar phases. However, most of the earlier investigations date back many decades and the experimental advances made since then should enable new insight into the physical nature of its phase diagram. We studied single crystals of 18 doping concentrations using linear and non -linear frequency-dependent dielectric response spectroscopy. In the low field measurements a variety of relaxation features are detected and analyzed in detail. The results for two concentrations of and are described qualitatively with a simple model. Possibly the most important outcome of the present work is the detection of a new electrically ordered phase for concentrations .
Keywords ferroelectric material; Rochelle salt; dielectric spectroscopy; hysteresis
PACS Numbers 77.22.Ej, 77.22.Gm, 77.80.Bh
1 INTRODUCTION
Rochelle salt (NaK C4H4OH2O) was first synthesized in 1655 by the pharmacist Pierre Seignette in La Rochelle (France). Therefore the name Seignette salt is also in use in the literature. Although it enjoyed a rapid distribution for medical and chemical purposes [1] from the very beginning, its unusual physical properties, especially the large piezoelectric coefficient, were discovered in the late 18th-century only [2]. Its extraordinary ferroelectric properties along the crystallographic a -axis were revealed even later by Valasek [3] who transferred the terminology of magnetic phase transitions (Curie -temperature) into the physics of dielectric materials. In his work he found two second-order phase transition temperatures at 297 K and 255 K which indicate a narrow temperature range where ferroelectric (FE) order exists.
As reported in literature [7, 8, 9, 10, 11], on doping the pure compound, NaK-tartrate***The name tartrate is derived from french crème de tartre for the crystalline furring deposit in containers of wine., with ammonium, the temperature range of the FE phase is reduced till the order is fully suppressed at approximately . Mixed crystals up to remain paraelectric (PE) down to lowest temperatures. For ammonium concentrations there is a FE phase below a second order transition which was reported to prevail down to lowest temperatures [10]. Between and the pure NaNH4-tartrate compound this FE phase is no longer present and a new phase appears with a first order phase transition. This phase shows a polar order that cannot be reversed by electrical fields kV/cm but by applying additional mechanical stress.
The crystal structure of the non-polar phases of pure NaK-tartrate was determined to be orthorhombic () [4]. The structure of the polar phase was found to be monoclinic () [5]. Despite numerous theoretical approaches there is no overall consensus concerning the explanation of the strange re-entrant behaviour. To enhance our understanding of this puzzling feature we were especially interested in investigating the dipolar reorientation in the low temperature PE phase below the second phase transition of the pure NaK-tartrate and the doping range of ammonium with between the two FE phases. We applied both ordinary broadband dielectric spectroscopy to examine the frequency-dependent linear response and high-field spectroscopy to detect the non-linear hysteretic response. Various samples of 18 different doping concentrations, were investigated covering all characteristic regions of the phase diagram.
Finally we will show that the simple model of Blinc et al. [6] can be used to describe the doping range of qualitatively.
2 EXPERIMENTAL DETAILS
The crystals were grown from an aqueous solution. The crystallographic axes were identified according to the geometrical properties reported in literature (e.g. [10, 12]). The average size of the raw crystals was about 1 cm3. They were polished down to a thickness along the a -axis mm with an area in the b-c -plane of mm2. For applying dielectric spectroscopy to these samples, both faces were covered with silver paint.
We used commercially available closed-cycle 4He refrigerators for cooling. The frequency-dependent linear dielectric measurements were performed with an autobalance bridge (HP4284) using pseudo 4-point technique. The frequency range covered is Hz MHz. The high-field non-linear measurements were made with a home-made setup [13] designed according to Sawyer and Tower [14].
3 RESULTS AND DISCUSSION
Frequency-dependent linear measurements were performed in the whole ammonium doping range of for the filed along the crystalline axis. The various PE and FE phases showing up in the phase diagram are discussed in detail below. In the following, the presentation of the spectral results will be restricted to certain concentrations, which exhibit dielectric properties, typical for the respective phases. In Figure 1
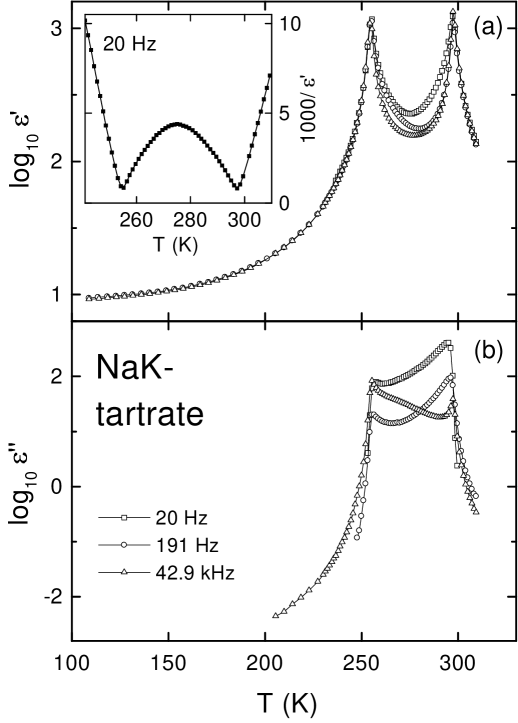
we present the temperature dependent data of both, the real and the imaginary part of the dielectric function, ’”, of pure NaK-tartrate for three frequencie s. Clearly the two second-order phase transitions at K and K appear as sharp anomalies in ’ (Figure 1a). In the temperature range of the ferroelectric phase for both, ’ and ” (Figure 1b) there are indications of relaxational behaviour which, however, cannot be analyzed further due to the underlying strong temperature dependence in the vicinity of the phase transitions. Moreover, for ” one can observe unusually high losses due to domain wall movement. The inset in Figure 1a shows the inverse of ’ for Hz. This plot reveals Curie-Weiß behaviour at and while at its detection is hampered by the relatively close vicinity of both phase-transition temperatures and the relaxation behaviour mentioned above. The re-entrant phase transitions, PEFEPE, prevail up to an ammonium concentration of .
As an example for the doping range of we present the data for in Figure 2.
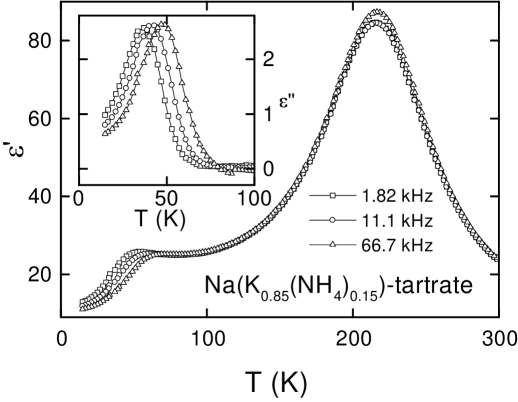
In this range there is no phase transition. The FE correlations, which produce the ordered phase for doping levels below %, are reduced below a critical limit (see section 4). In Figure 2 the real part ’ shows a relatively flat, broad peak at about 217 K, but no FE ordering is detected in the nonlinear results (not shown), which reveal simple PE loss-loops. At low temperatures, between 10 and 90 K there is a pronounced relaxation feature. It shows up as sigmoidally shaped curves in ’ and as peaks in ” (inset of Figure 2), both shifting to higher temperatures with increasing frequency. The temperature evolution of the corresponding relaxation times will be discussed below.
The doping range was reported to exhibit a ferroelectrically ordered phase [7, 8, 9, 10, 11]. All samples investigated in this range show qualitatively the same characteristics. Figure 3
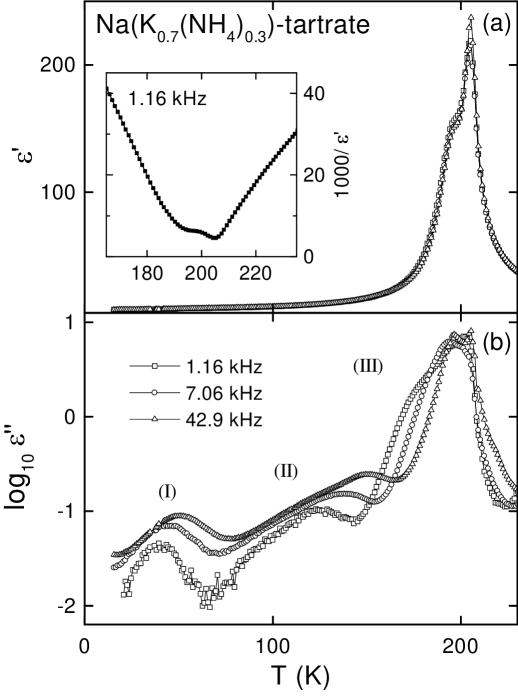
shows the data of a typical crystal (30 % doping) within this range. Like the pure NaK-tartrate this sample shows a sharp peak in ’ (Figure 3a) due to a second-order transition at 205 K. On closer inspection of the data a shoulder on the low temperature side of this peak can be identified at 187 K, which indicates a second phase transition. This feature is even more pronounced in the inverse representation shown in the inset. This additional transition is detected in all data on crystals in this doping range. The imaginary part in Figure 3b shows at least three relaxation processes, namely in the temperature ranges of K (I), K (II) and K (III) superimposed to the transition anomalies. The three relaxations can be clearly marked by their dispersive behaviour which will be discussed in detail below.
For a new phase transition appears. The data on pure NaNH4-tartrate are presented in Figure 4.
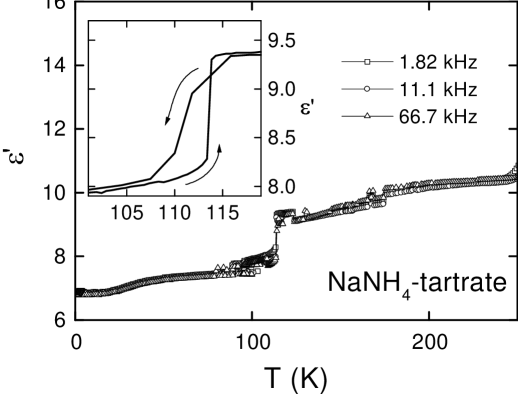
The transition at 112 K from the PE to an ordered phase is of first order as can be deduced from the hysteretic step in ’ (inset of Figure 4).
We will now focus on the variety of relaxation processes mentioned above. At the temperature of the peak maximum in ” the relaxation rate can be estimated to be equal to the measuring frequency. The temperature dependent , determined in this way for the collection of evaluated processes is shown in Figure 5
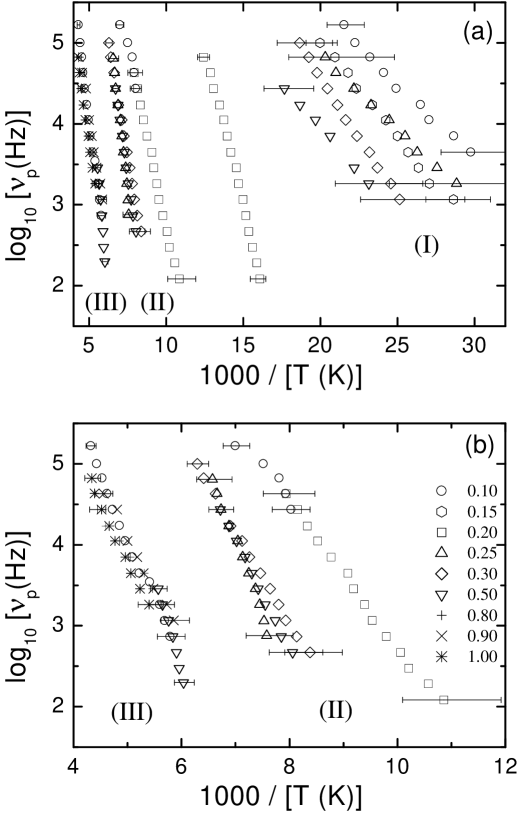
in an Arrhenius representation. One may classify three groups of separate processes in the inverse temperature ranges of (I), (II) and (III) in units of 1000/K (with the exception of one relaxation in the doped samples). Within the error bars the various data sets can be fitted†††The fits are not shown to improve readability of the plots. by straight lines (nearly parallel within one group), indicating thermally activated behaviour according to
| (1) |
Here is the attempt frequency and denotes the energy barrier. The fits result in similar parameters for each group. In Figure 6
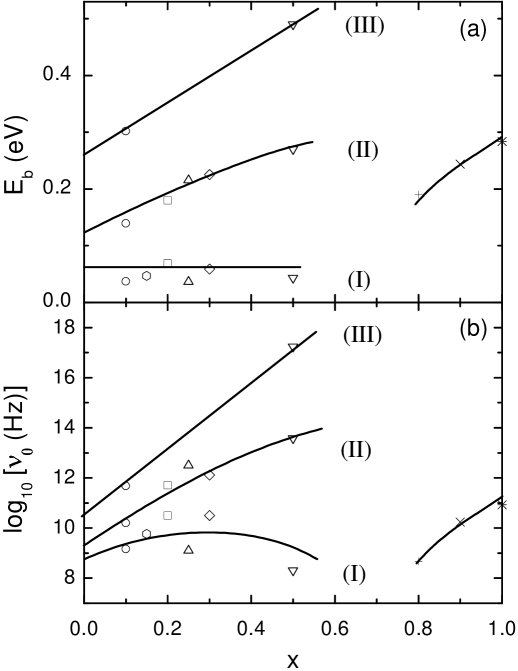
we plot the values of these parameters versus the doping concentration . The lines are drawn to demonstrate the continuous development of the parameters within the three groups (I), (II) and (III) up to . The lines, connecting the Arrhenius parameters of the three concentrations above , also belong to the group (III) in terms of the absolute values of the relaxation times, while their Arrhenius parameters deviate considerably from those of the other members of this group. The involved errors for the values shown in Figure 6 are about 25 % resulting from the error bars given in Figure 5. Within these limits all parameters follow the behaviour sketched by the lines in Figure 6 reasonably well. Presumably the observed relaxations result from intra-molecular motions, e.g. of the carboxyle groups or the hydrogen bonds. This finding is (for group I) also corroborated by the relatively small doping dependence of the plotted parameters. From the extremely high values of the attempt frequencies of group (III), deviations from Arrhenius behaviour can be expected at high temperatures, indicating a collective nature of the probed motion. Assuming an increase of disorder upon doping the width of the associated random bonds distribution is proportional to a characteristic ”freezing” temperature which thus shifts to higher temperatures for higher doping concentrations. The Arrhenius fit therefore yields a higher value for in the same temperature interval and an increased overestimation of . For all relaxation processes observed, the inspection of ” (not shown) reveals a half width of the loss peaks much broader than expected for Debye relaxation. Such behaviour is usually ascribed to a distribution of relaxation times.
In the following we will discuss the high field results of two samples with the doping concentrations and . In Figure 7
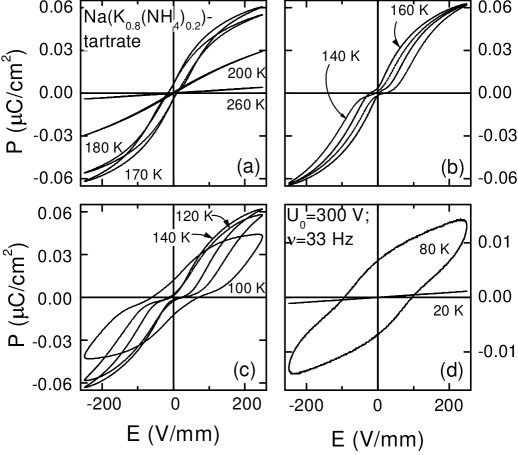
the field dependent polarization for the 20 % doped sample is presented for various temperatures. At temperatures K linear behaviour is observed. At 200 K a hysteresis loop starts to open up, typical for a transition to FE order. Below 160 K a frequency independent wasp waisted contraction of the curves near the origin is observed. This effect can be attributed to an overlay of the present FE order with anti ferroelectric (AFE) correlations [15, 16, 17]. Another possible reason for this phenomenon found also in magnetically ordering materials might be a reorientation of domains about 90∘ as proposed by Weber et al. for cobalt films on copper [18]. However, the shoulder, observed in ’ as discussed above (Figure 3a) speaks in favour of the first interpretation. It clearly indicates a second-order transition. Below about 140 K the polarization becomes significantly reduced, which can be ascribed to growing coercitive fields with decreasing temperature leading to an incomplete reorientation of the polarization.
Figure 8
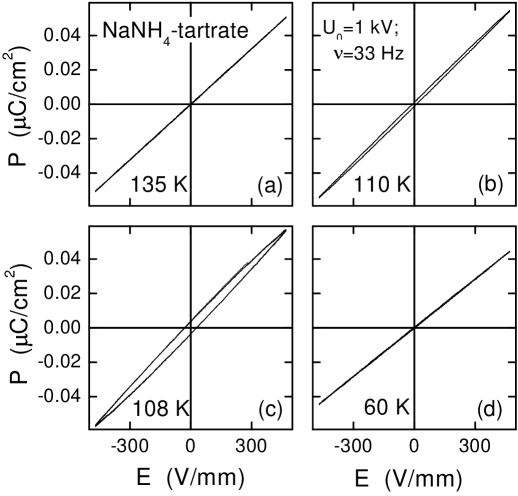
shows the high field response of pure NaNH4-tartrate: even with the highest applied fields (just below the threshold limit) no electrical ordering can be introduced. An abrupt change to ellipsoidally shaped loops can be observed around the temperature of the first-order phase transition at 112 K indicating an enhanced dielectric loss in this region.
Finally we will describe the modified phase diagram for the full ammonium concentration range of in Figure 9.
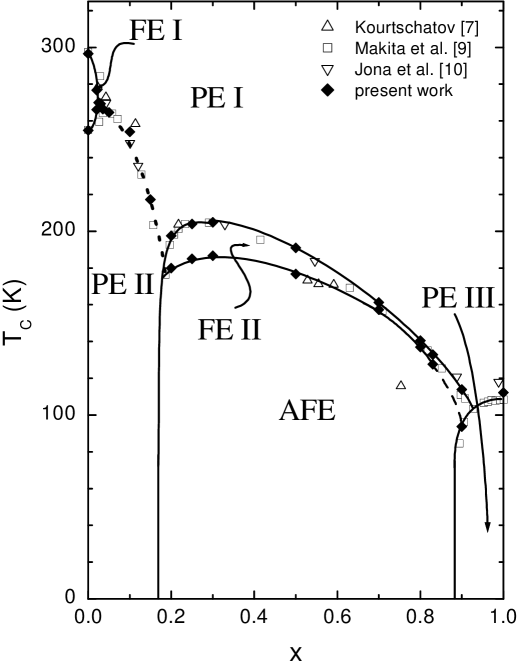
All previously published phase transitions are reproduced and refined on the basis of our results. With decreasing temperature we observe a succession of PEFEPE phases for , denoted as PE I, FE I and PE II. Above there is no indication for any ordering: the FE I phase vanishes successively on increasing doping concentration; the dotted line in the phase diagram indicates the position of a flat, broad maximum in ’. A possible microscopic explanation for this feature is discussed in the following section. In the range of however, our data justify a modification of the phase diagram: while there is indeed a ferroelectric phase transition as reported before, this phase (FE II) is followed by another régime with anti -ferroelectric correlations at lower temperatures (AFE). We therefore introduce a new phase line in Figure 9. This result is supported by the fact that this behaviour was reproduced in different samples and in measurements using two different experimental setups. Above we observe a ”polar” phase (PE III) where no order can be induced electrically by fields below the threshold limit. The detailed physical nature of this phase is still unresolved.
4 MODEL CALCULATIONS
There has been a tremendous effort [6, 19, 20, 21, 22, 23, 24, 25, 26] to explain the reason of the puzzling behaviour of the pure NaK-tartrate compound, namely showing two second order transitions and a ferroelectric phase between them, taking into account dipole-dipole and dipole-charge interaction between sublattices. From vibrational spectroscopy of soft-mode behaviour [27, 28] there is strong evidence in favour of the model of coupled oscillators of Reference [24, 28]. In the present paper we apply the simple model of Blinc and Žekš [6, 21] which considers the interaction of the hydroxyl groups. The model, which is sometimes called pseudo-spin model, is based on an asymmetric double-well potential with two intertwined sublattices being mirror images of each other. Omitting a tunneling parameter for the present case, because of the high temperatures at which the transition takes place, the Hamiltonian of this arrangement may be expressed as follows:
where the are pseudo spin- operators with the indices 1 and 2 denoting the two sublattices; the tensors and stand for the effective interaction constants of the dipoles in the same or in the other sublattice. is a measure for the symmetry of the double wells and is the dipole moment interacting with an external field. These assumptions and a mean-field approximation lead to a self-consistent system of two equations. For a detailed derivation the reader may refer to [21]. From this model we get the scalar parameters and which determine that the system is stable for a certain set of parameters
| for | or | with |
|---|---|---|
| and for | with |
Here is the dominant term which leads to an antiparallel alignment of the sublattices for all temperatures and all applied external fields. The asymmetry term is also responsible for an antiparallel tendency of the sublattices. The parameter describes an antiparallel influence of overnext neighbours resulting in a ferroelectric tendency for the whole system in the temperature range around the value of .
Describing the physics of the model qualitatively one may explain the mechanism as follows. The parts of the molecule now called ”particles” which are responsible for the polar order are located in double well potentials. There is no net polarization in the ground state (i.e. the dipoles of both sublattices are opposite and equal); and there are excited states with a finite dipole moment. Furthermore there may be an interaction between the dipoles of the excited states which favours a parallel alignment.
At all molecules are in the ground state. Therefore there is no total polarization. If the dipole-dipole interaction is large enough, the excitation energy of the particles can be compensated by the gain in total energy due to the alignment of the dipoles. In this scenario the state of ferroelectric order is favoured with respect to the total energy of the system.
Now, the dipole-dipole interaction may be just below the critical value for this scenario. For we have to take both the energy and the entropy into account: at a finite temperature there is a probability for a certain number of particles to be in the excited state (i.e. resulting in a net polarization). From this follows, that the effective magnitude of the polarization is equal to the original magnitude multiplied by this probability. On the other hand, the influence of the dipole-dipole interaction is decreasing with rising temperature. Therefore, at , a ferroelectric phase is only possible if the probability for the excited states increases more rapidly than the influence of the order decreases. At high temperatures the order will vanish in any case.
We will now apply the model to data of two ammonium concentrations: the sample of pure NaK-tartrate () and the sample with , the latter being in the range where no FE ordering occurs any more. We take the data for the lowest frequency measured, namely 20 Hz, to be close to the static limit of the theoretical model. Figure 10
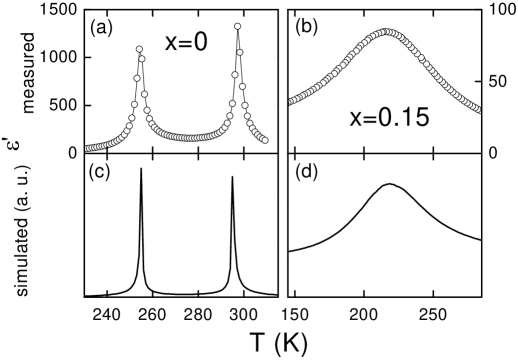
shows that the theoretical result is in good qualitative agreement with our measurements. We yield the parameters shown in Table 1.
| parameter | ||
|---|---|---|
| K | K | K |
| L | K | K |
| K | K |
From this table it is obvious that the set of parameters does not have to be changed very much to describe the régime of suppressed FE order. For the description of the doped sample the effective parameters and , as well as the effective asymmetry parameter are lowered by about %.
5 CONCLUSIONS
We have presented results from low and high field frequency-dependent dielectric measurements on 18 different ammonium doping concentrations of the compound NaKNHC4H4OH2O. Characteristic spectra of concentrations representative for the various phases in the complex phase diagram were shown. In the low field dielectric measurements a richness of relaxational features was found over the whole doping range and systematically analyzed. The detected relaxation processes were classified roughly into three groups. Presumably two of these groups represent single particle intramolecular motions, whereas the third one is of collective nature. From the hysteresis loops of the high field measurements we have provided striking evidence for a new phase showing anti-ferroelectric correlations in the doping range of . This finding is corroborated by the detection of an anomaly in the temperature dependent dielectric permittivity obtained from the low field measurements. A new phase boundary is introduced into the established phase diagram showing the systematic doping dependence of the new phase. Finally we demonstrated for the first time that the simple model by Blinc and Žekš can be used to describe not only the data on pure Rochelle salt, but the whole range up to an ammonium content of at least qualitatively. This is a remarkable fact and may improve the understanding of the re-entrant behaviour of the pure Rochelle salt vanishing upon doping.
ACKNOWLEDGEMENTS
We want to express our gratitude towards A. Maiazza at the Technische Universität Darmstadt for growing the high-quality Rochelle salt crystals this work is based upon. We are indebted to H. Ries for help with the high field non-linear measurements. One of the authors (U.S.) also wants to acknowledge fruitful discussions with J. Petzelt and S. Kamba at the Institute of Physics in Prague and A. Volkov at the General Physics Institute in Moskow.
References
- [1] P. J. Macquer, Dictionnaire de chymie (Paris, 1777), 3, p. 122.
- [2] F. Pockels, Lehrbuch der Kristalloptik (Teubner Verlag, Leipzig, 1906).
- [3] J. Valasek, Phys. Rev. 17, 475 (1921).
- [4] C. A. Beevers and W. Hughes, Proc. Roy. Soc. 177A, 251 (1941).
- [5] B. C. Frazer, Phys. Rev. 94, 1435 (1954).
- [6] R. Blinc and B. Žekš, Adv. Phys. 21, 693 (1972).
- [7] I. V. Kourtschatov, Le champ moléculaire dans les diélectriques (Le sel de Seignette) (Herman et Cie, Paris, 1936).
- [8] Y. Takagi and Y. Makita, J. Phys. Soc. Jpn. 13, 272 (1958).
- [9] Y. Makita and Y. Takagi, J. Phys. Soc. Jpn. 13, 367 (1958).
- [10] F. Jona and G. Shirane, Ferroelectric crystals (Pergamon Press, Oxford, 1962) and references therein.
- [11] F. Sandy and R. V. Jones, Phys. Rev. 168, 481 (1967).
- [12] W. P. Mason, Piezoelectric crystals and their applications in ultrasonics (van Nostrand, New York, 1950).
- [13] J. Hemberger, unpublished.
- [14] C. B. Sawyer and C. H. Tower, Phys. Rev. 35, 269 (1930).
- [15] J. Grindlay, An introduction to the phenomenological theory of ferroelectricity (Pergamon, Oxford, 1970) and references therein.
- [16] G. H. Haertling, Ferroelectrics 75, 25 (1987).
- [17] Y. Xu, Ferroelectric Materials and Their Applications (Elsevier, New York, 1991) and references therein.
- [18] W. Weber, C. H. Back, A. Bischof, Ch. Würsch and R. Allenspach, Phys. Rev. Lett. 76, 1940 (1996).
- [19] T. Mitsui, Phys. Rev. 111, 1259 (1958).
- [20] Y. Takagi and Y. Ishibashi, J. Phys. Soc. Jpn. 33, 1381 (1972).
- [21] R. Blinc and B. Žekš, Soft modes in ferroelectrics and antiferroelectrics (Elsevier, New York, 1974).
- [22] Y. Takagi, Y. Ishibashi and A. Sawada, J. Phys. Soc. Jpn. 38, 497 (1975).
- [23] D. G. Sannikov, Sov. Phys. Solid State 20(10), 1728 (1979).
- [24] G. V. Kozlov, E. B. Kryukova, S. P. Lebedev and A. A. Sobyanin, Sov. Phys. JETP 67(8), 1689 (1989).
- [25] K. Okada, Ferroelectrics 95, 87 (1989).
- [26] K. Okada, J. Phys. Soc. Jpn. 58, 905 (1989).
- [27] S. Kamba, G. Schaak and J. Petzelt, Phys. Rev. B 51, 14998 (1995).
- [28] A. A. Volkov, private communication.