Butterfly-like spectra and collective modes of antidot superlattices in magnetic fields
Abstract
We calculate the energy band structure for electrons in an external periodic potential combined with a perpendicular magnetic field. Electron-electron interactions are included within a Hartree approximation. The calculated energy spectra display a considerable degree of self-similarity, just as the “Hofstadter butterfly.” However, screening affects the butterfly, most importantly the bandwidths oscillate with magnetic field in a characteristic way. We also investigate the dynamic response of the electron system in the far-infrared (FIR) regime. Some of the peaks in the FIR absorption spectra can be interpreted mainly in semiclassical terms, while others originate from inter(sub)band transitions.
pacs:
73.20.Dx, 73.20.MfRecent years have witnessed a considerable amount of research effort directed towards understanding of the physics of two-dimensional electron systems (2DES) whose dimensionality is further restricted by man-made periodic potentials and perpendicular magnetic fields. These include quantum dot arrays and antidot superlattices. Concentrating on the latter ones, one distinguishes two principal directions of experimental work: transport studies and far infrared (FIR) spectroscopy. Some of the transport measurements[3, 4] have been performed in search of evidence for a self-similar energy spectrum, the so called Hofstadter butterfly.[5] A main theme in the FIR absorption experiments has been to detect and classify the rich variety of collective modes that occur in these systems.[6, 7, 8]
Along with the experimental work, theorists have addressed the same issues.[9, 10, 11, 12, 13, 14, 15] The main difficulty lies in the fact that while the superlattice is periodic, the Hamiltonian (including a vector potential) is not. Most recent calculations of superlattice electronic structure have used the Ferrari basis to deal with this matter.[16] We will instead apply ray-group-theoretical techniques[17, 18, 19, 20] to effectively reduce the calculational complexity.
With this approach, we are able to go beyond earlier calculations. We find the band structure for interacting electrons in general “rational” magnetic fields [i.e., the flux through a unit cell is , where is a flux quantum and ]. Consequently, we are able to trace even fine-scale features of the butterfly and at the same time study the effects screening has on it. We also explore the FIR response. The resulting spectra are rather rich. Along with absorption peaks caused by collective modes, and known from experiments,[6, 7] we find additional ones of mostly quantum-mechanical origin.
The antidot superlattice considered here is of simple square symmetry , with lattice parameter . The effective one-particle Hamiltonian is
| (1) |
where the vector potential (symmetric gauge) describes the perpendicular magnetic field and , denotes the reciprocal lattice vectors. We use GaAs parameters and work with short-period superlattices with Å and electron density cm-2. A typical magnetic field T gives four flux quanta per unit cell, filling factor , and the cyclotron energy meV, where . The last term in Eq. (1) is a sum of the external superlattice potential, described by a few principal Fourier components,[21] and the Hartree potential. As for electron spin, we keep the twofold degeneracy in mind when counting states, but neglect other effects such as Zeeman splitting and exchange interaction.
The electronic states we set out to solve for will satisfy the modified Bloch conditions
| (2) |
when the magnetic flux through a unit cell equals an integer number of flux quanta . Here
| (3) |
are magnetic translation operators forming a ray group, [22] and the eigenstates can still be classified by different values of the crystal momentum , in the first Brillouin zone. [17] Actually, one finds sets of linearly independent functions each transforming according to the same irreducible representation. This manifests itself as the splitting of the Landau band into subbands. For rational fields with flux per unit cell, the irreducible representations of the group (3) are -dimensional and the states -fold degenerate. This calls for a generalized treatment[17, 19, 23] which we have implemented but do not further describe here.
The next important step towards a solution is a canonical coordinate transformation.[19] We switch to dimensionless units[24] to be used hereafter, and introduce
| (4) |
This preserves the canonical commutators, maps the kinetic energy of the Hamiltonian in the symmetric gauge onto a harmonic oscillator in , and makes the magnetotranslations act only on ,
| (5) |
The periodic potential mixes the and degrees of freedom (in these coordinates it behaves like a magnetic translation operator)
| (8) | |||||
Using projection-operator techniques we find the symmetry-adapted -dependent functions
| (9) |
labeled by the magnetic crystal momentum in the first magnetic Brillouin zone (i.e., ) and the subband index . Now the Ansatz
| (10) |
for the eigenstates allows for subband mixing, and the -dependence is accounted for by an expansion in harmonic oscillator eigenfunctions . Inserted into the Schrödinger equation, the Ansatz yields the eigenvalue problem determining the electron states
| (12) | |||||
The subband and Landau-level mixing coefficients are
| (13) | |||||
| (14) |
Equation (12) must be iterated together with the Poisson equation updating the Hartree potential until self-consistency is reached.
Figure 1 shows the splitting of the first four Landau levels as a function of the dimensionless inverse flux . With a reasonable computational effort we could treat rational fields with and all possible ’s. This is enough to clearly resolve the intricate subband clustering. [5]
It is easy to see that the bandwidths in Fig. 1 decrease with increasing magnetic flux; however, the decrease is not monotonous. Instead they have maxima for flux values 6, 3, and 2, (see the inset) when there are 1, 2, and 3 completely filled Landau levels, respectively. Then the 2DES cannot screen the external potential very effectively, and the Fourier coefficients are larger than for other flux values. Thus, since the bandwidth is set by a competition between the band-narrowing effects of the magnetic field and the band broadening tendencies of the potential, this leads to a cusped behavior of the band top and bottom at integer filling factors. For the filling factors we also observe the same qualitative behavior while quantitative predictions of the Hartree theory in this region may be inaccurate. We note that there exist other (unrelated to electron-electron interaction) mechanisms which also lead to nonmonotonous bandwidths.[15]
Electron-electron interaction also contributes to diminishing the symmetry of the butterfly as strong coupling between different bands does.[13, 15] The second and third bands in Fig. 1 which are traversed by the chemical potential show reduced regularity if compared to well-separated noninteracting bands in Fig. 3 (a) of Ref. [15], whereas our fourth band, well above , would exhibit a considerable resemblance to Hofstadter’s one-band picture when properly rescaled.
Turning to the dynamic response of the 2DES, we calculate the density-density response function within the random-phase approximation (RPA) by solving the set of equations
| (15) |
Here is the independent particle response function which we can evaluate knowing the electron eigenstates already calculated. The FIR absorption of the long wavelength ( in the first Brillouin zone) light is proportional to .[25]
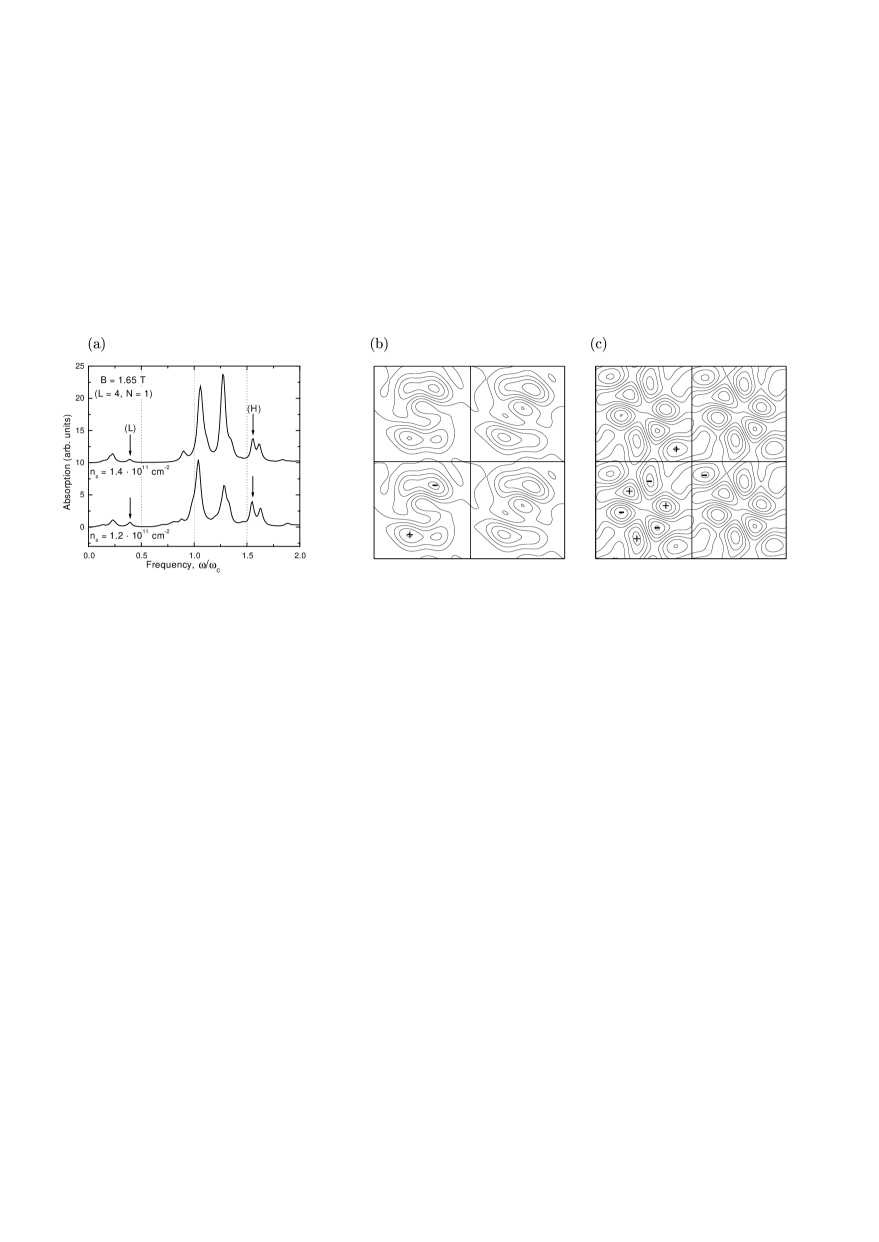
The so calculated spectra typically exhibit several conspicuous peaks. In Fig. 2 (a), we display spectra calculated for electron densities cm-2 and cm-2, respectively, and wave vector . Following the suggestion of Ref. [12] to classify the different peaks by studying the corresponding charge fluctuations; we also trace their development in time to pick out the ones that are stable with respect to changing electron density. Here we try to concentrate on a few of these plots and give a thorough discussion of them. To this end we calculate the time-dependent, induced charge density at the absorption-peak frequencies in four adjacent unit cells, and plot snapshots thereof in Fig. 2 (b) and (c). The antidots are situated at the intersections of the thick lines and the “+”(“-”) signs mark the locations of the charge density maxima (minima).
The two spectra shown in Fig. 2 (a) calculated for different electron densities are very similar. At the same time, however, the induced charge densities at the different peaks can in general change quite a lot with changing electron density. There are a few exceptions to this, most notably the peaks marked (H) and (L) and indicated by arrows. As we will see, one can give a clear, semiclassical interpretation to these modes.
Thus, Fig. 2 (b) shows the charge density corresponding to the (H) peak in Fig. 2 (a). One sees a dipole which, looking at a sequence of snapshots, rotates around the center of each lattice cell (i.e., between four antidots) in the direction of cyclotron motion. This mode, which can be anticipated on general grounds, emerges in simple theoretical models[9] and has been detected experimentally.[6, 7]
In the low frequency region we find a more complicated collective mode [peak (L) in Fig. 2 (a)] depicted in Fig. 2 (c). A dipolar charge distribution is rotating around each antidot in the direction of cyclotron motion, and a “ring” of three charge density maxima and three minima between the antidots is rotating in the opposite direction. During each period one sees some small charge transfer between the two structures. We interpret this mode as a pair of coupled (inter)edge magnetoplasmons with angular momenta and around an antidot and the center of a cell, respectively. The dynamics of this mode is mainly determined by an equilibrium between the Lorentz force and restoring electrostatic forces. From this follows that the magnetoplasmon propagates in opposite directions around a charge density maximum (a cell center) and a minimum (an antidot).[26] Note also that this mode is an example of mixing of states with angular momenta differing by a multiple of four in a square lattice.
Both peaks, (H) and (L), show absorption of light polarized in the direction of the cyclotron resonance in agreement with experiment.[7] The existing theoretical explanation,[9] however, is based on a model with circularly symmetric unit cells and cannot describe the interplay of modes centered at different places of the unit cell. Besides the modes discussed until now the 2DES absorbs energy at a number of other frequencies. The corresponding induced charge distributions are more complex than the ones displayed in Figs. 2 (b) and (c). These excitations are to a large extent of a quantum-mechanical nature, i.e., the result of intersubband and inter-Landau-level transitions (see also Ref. [11]). In this context, it is also clear that our spectra obtained for short-period superlattices are not completely comparable to the ones found experimentally. There are two main reasons for this, the potential has a stronger influence on electron motion, and we have not treated disorder broadening.
In conclusion, we have developed a theory that makes it possible to study the electronic structure of a 2DES in a combined periodic potential and strong magnetic field in a detailed fashion treating electron-electron interactions at the mean-field level. The so calculated energy spectra show clear traces of a self-similar structure like the Hofstadter butterfly, however, considerably modified by screening effects. The dielectric response of the 2DES in the FIR regime reveals a rich spectrum of excitations. Some of the peaks in these spectra can be interpreted in terms of semiclassical collective excitations, while others mainly are of a quantum-mechanical origin.
We thank Carlo Canali, Carl-Olof Almbladh, and Koung-An Chao for valuable discussions. One of us (P.J.) is supported by the Swedish Natural Science Research Council (NFR).
REFERENCES
- [1] Electronic address: egidijus@teorfys.lu.se
- [2] Electronic address: epj@teorfys.lu.se
- [3] R. R. Gerhardts, D. Weiss, and U. Wulf, Phys. Rev. B43, 5192 (1991).
- [4] K. Ensslin and P. M. Petroff, Phys. Rev. B41, 12 307 (1990); A. Lorke, J. P. Kotthaus, and K. Ploog, ibid. 44, 3447 (1991); D. Weiss, M. L. Roukes, A. Menschig, P. Grambow, K. von Klitzing, and G. Weimann Phys. Rev. Lett.66, 2790 (1991); R. Fleischmann, T. Geisel, and R. Ketzmerick, ibid. 68, 1367 (1992).
- [5] D. R. Hofstadter, Phys. Rev. B14, 2239 (1976); M. Ya. Azbel’, Zh. Eksp. Teor. Fiz. 46, 929 (1964) [Sov. Phys. JETP 19, 634 (1964)].
- [6] K. Kern, D. Heitmann, P. Grambow, Y. H. Zhang, and K. Ploog, Phys. Rev. Lett.66, 1618 (1991).
- [7] K. Bollweg, T. Kurth, D. Heitmann, E. Vasiliadou, K. Eberl, and H. Brugger, Phys. Rev. B52, 8379 (1995).
- [8] A. Lorke, I. Jejina, and J. P. Kotthaus, Phys. Rev. B46, 12 845 (1992).
- [9] G. Y. Wu and Y. Zhao, Phys. Rev. Lett.71, 2114 (1993).
- [10] D. Huang and G. Gumbs, Phys. Rev. B47, 9597 (1993).
- [11] V. Gudmundsson and R. R. Gerhardts, Phys. Rev. B54, 5223 (1996).
- [12] V. Gudmundsson, Phys. Rev. B57, 3989 (1998).
- [13] G. Petschel and T. Geisel, Phys. Rev. Lett.71, 239 (1993).
- [14] V. Gudmundsson and R. R. Gerhardts, Phys. Rev. B52, 16 744 (1995).
- [15] D. Springsguth, R. Ketzmerik, and T. Geisel, Phys. Rev. B56, 2036 (1997).
- [16] R. Ferrari, Phys. Rev. B42, 4598 (1990).
- [17] E. Brown, Phys. Rev. 133, A1038 (1964).
- [18] J. Zak, Phys. Rev. 136, A1647 (1964).
- [19] H.-J. Schellnhuber, Phys. Rev. B25, 2358 (1982).
- [20] H.-J. Schellnhuber and G. Obermair, Phys. Rev. Lett.45, 276 (1980); G. M. Obermair and H.-J. Schellnhuber, Phys. Rev. B23, 5185 (1981); H.-J. Schellnhuber, G. M. Obermair, and A. Rauh, ibid. 23, 5191 (1981).
- [21] In the FIR calculations we use and make the potential profile steeper and, most likely, more realistic by setting , with meV. Plotting the butterfly we reduce the potential to meV in order to prevent the bands from overlapping since this is known to reduce the self similarity.[13]
- [22] M. Hamermesh, Group Theory and its Application to Physical Problems, (Dover, New York, 1989), Chap. 12.
- [23] Rational fields increase the analytic but not the numerical complexity of the problem.
- [24] Distances are measured in terms of the magnetic length , momenta in , and energies in .
- [25] C. Dahl, Phys. Rev. B41, 5763 (1990).
- [26] P. K. H. Sommerfeld, P. P. Steijaert, P. J. M. Peters, and R. W. van der Heijden, Phys. Rev. Lett.74, 2559 (1995).