Operation characteristics of piezoelectric quartz tuning forks in high magnetic fields at liquid Helium temperatures
Abstract
Piezoelectric quartz tuning forks are investigated in view of their use as force sensors in dynamic mode scanning probe microscopy at temperatures down to 1.5 K and in magnetic fields up to 8 T. The mechanical properties of the forks are extracted from the frequency dependent admittance and simultaneous interferometric measurements. The performance of the forks in a cryogenic environment is investigated. Force-distance studies performed with these sensors at low temperatures are presented.
Piezoelectric quartz tuning forks have been introduced in scanning probe microscopy by Günther, Fischer and Dransfeld in Ref. [1] for use in scanning near field acoustic microscopy and later by Karrai and Grober in Ref. [2] as the distance control for a scanning near field optical microscope (SNOM). Several other implementations of tuning forks have been reported, e.g. in SNOMs [3, 4, 5, 6], scanning force microscopes (SFMs) [7, 8], magnetic force microscopes [9] and in the acoustic near field microscope [10]. The operation in a cryogenic environment was reported by Karrai and Grober in their pioneering work in Ref. [2]. To our knowledge operation characteristics at temperatures below 10K were not reported to date. In this paper we present results on piezoelectric tuning fork sensors in our low temperature SFM which operates in the sample space of a 4He cryostat [11].
In our studies we utilized commercially available tuning forks (see inset of Fig. 1a) which are usually employed in watches with a standard frequency of Hz. These forks are fabricated from wafers of -quartz with the optical axis oriented approximately normal to the wafer plane.
The tuning fork can either be mechanically driven by an additional piezo element or electrically excited through the tuning fork electrodes [13]. Similar to Ref. [7] we drive the oscillation electrically by applying an AC-voltage of typically mV to the tuning fork contacts. For the investigation of the tuning fork behavior we measure the complex admittance of the fork with a two-channel lock-in amplifier. When employed as the sensor for dynamic force measurements the tuning fork is part of a phase-locked loop described in Ref. [11].
Figure 1b shows a typical resonance in the admittance of a tuning fork measured at room temperature at a pressure of mbar. The admittance exhibits an asymmetric resonance at 32768Hz and a sharp minimum at about 30Hz above this resonance. The current through the fork consists of two parts [13]: is the current created by the mechanical (harmonic) oscillation of the fork arms through the piezoelectric effect of the quartz. is the capacitive current through the fork. The behavior of the admittance can therefore be modeled with the equivalent circuit shown in the inset of Fig. 1b.
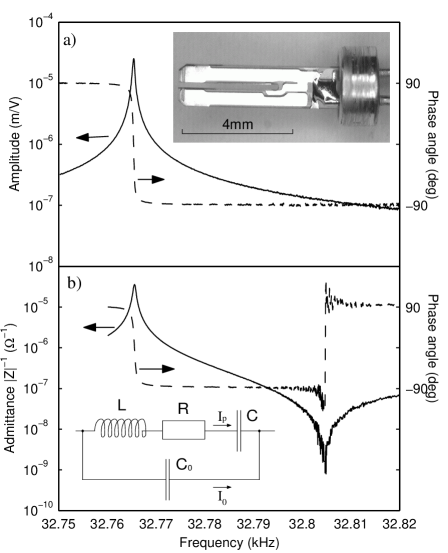
The LRC series resonator with a resonance frequency around Hz and a quality factor which is typically of the order of allows the current to pass. Using a mechanical model one can relate , and with the effective mass of one arm , the damping constant , the spring constant and the driving force via , , [12]. The capacitance is mainly determined by the geometrical arrangement of the contacts on the crystal, the dielectric properties of the quartz and by cable capacitances. The fit to the measured admittance in Fig. 1a (which could not be distinguished in the plot from the measured curve) leads to pF, , H, k, Hz and .
In addition to the electrical resonance we measured the mechanical resonance amplitude of one of the tuning fork arms (see Fig. 1a) utilizing the interferometer setup usually used for optical cantilever deflection detection in a scanning force microscope [14]. From a combination of both measurements (Fig. 1a and 1b) and using the relation [13] we determined the effective mass mg, the quality factor , the spring constant N/m and the piezoelectric coupling constant C/m. The effective mass calculated from the density of quartz and the dimensions of a tuning fork arm according to Ref. [13] turns out to be 0.36 mg, in good agreement with our measured value. A linear relation between the driving voltage and the oscillation amplitude was found in the interferometer measurement down to amplitudes of 1 nm as well as in large-amplitude measurements performed under an optical microscope up to amplitudes of about 100 m.
For the use in our SFM we remove the tuning forks from their casing and glue a thin metallic wire (diam. 10m - 50m) in the direction of the oscillatory motion to the end of one prong. The wire is then etched electrochemically to form a sharp tip. If the wire is electrically connected to one of the tuning fork contacts its length is about 500m. In cases where we connect the wire to a separate contact pad the wire can be up to 3mm long. The additional weight fixed to the tuning fork arm is in the range between 1.5g and 50g. In order to obtain the most sensitive force gradient detection it is important to keep the relative mass increase as small as possible. After this modification the resonance of the tuning forks are always shifted to lower frequency, in most cases less than 100Hz and typical quality factors under ambient conditions are reached.
In our SFM we operate the tuning forks in the gas flow of a variable temperature 4He cryostat. Alternatively the sample space can be flooded with liquid He and the microscope is then operated either in normal fluid 4He or in a mixed normal-superfluid phase (below 2.2K) [15]. Table I shows tuning fork resonance characteristics obtained under these different conditions. Compared to operation in the gas the resonance frequency of the fork is shifted by more than 500Hz to lower frequencies in the normalfluid liquid. At the same time the -value of the resonator decreases due to the significantly increased friction in the liquid. At temperatures below 2.2K the quality factor increases again as a result of the formation of superfluid 4He which tends to suppress friction effects [15]. The explanation of the reduction of the resonance frequency in the superfluid is an open question. These measurements demonstrate the robustness of the tuning fork properties when external conditions are severly changed. With a conventional cantilever for scanning force microscopy it is difficult to achieve -values of this order in liquid 4He. However, even with the tuning forks, operation in liquid He is cumbersome because the resonance frequency fluctuates strongly. During scanning the tuning fork is typically operated at a constant frequency shift of 100 mHz and deviations of more than a few mHz induced by the environment are intolerable.
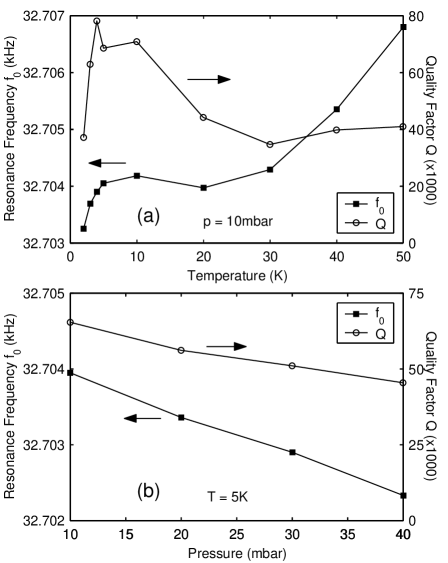
The temperature coefficient of the resonance frequency below 5K was determined to be at a constant pressure of 10 mbar (see Fig. 2). The pressure coefficient was at 5 K. This means that frequency shifts of the order of 10mHz are produced by temperature instabilities of about 50mK or pressure instabilities of about 0.2mbar. In addition, we measured the dependence of the resonance frequency on an external magnetic field in the range between 0 and 8 T. The detected frequency shift was smaller than 100mHz.
| (K) | |||
|---|---|---|---|
| helium gas ( mbar) | 32634 | 22665 | |
| liquid helium | 4.2 | 32110 | 2153 |
| superfluid helium | 1.56 | 32056 | 7583 |
In order to demonstrate the power of the piezoelectric tuning fork sensing of tip-sample interactions we show in Fig. 3 a set of measuements of the frequency shift versus distance of the tip to the Au surface measured at 2.5K and zero tip-sample voltage. From the quality of topographical images taken with this tip just before these measurements we deduce a tip radius of several hundred nanometers.

The oscillaton amplitude was varied by a factor of 10 from one curve to the next, starting from a sub-nm value. A larger oscillation amplitude averages over a larger -range in the repulsive as well as in the attractive region of the interaction such that the frequency shift at a given distance decreases with increasing amplitude. Such a behavior was quantitatively described by Giessibl [16] for an attractive van der Waals-potential of the form , where is a positive integer.
In the following we discuss several aspects of the utilization of tuning forks in SFMs at cryogenic temperatures. The typical values of the spring constants of tuning forks are much higher than the ones of conventional SFM cantilevers. This has several implications for their use in a dynamic mode SFM: first, a given force gradient leads to a smaller shift of the resonance frequency than in conventional cantilevers, since typically , no matter whether small or large oscillation amplitudes are used [16]. Care has to be taken in the design of the control electronics to make sure that frequency shifts of at least 10mHz can be measured to compensate this disadvantage. Second, there is no danger for the tip to snap into contact with the sample, since the condition is met for all tip-sample spacings. This makes the tuning fork an ideal tool to investigate tip-sample interactions as a function of distance. And last but not least, the high spring constant makes tuning forks ideal for specific applications, e.g. for nanolithography in the non-contact mode [17] or as carriers for all kinds of scanning nano-sensors which may be harder to implement on conventional SFM cantilevers. These issues will be discussed in future publications.
The -values obtained with our tuning forks at pressures around 1mbar are generally of the same order as the best cantilevers when operated under UHV-conditions. The robustness of against pressure changes is also significantly higher than that of conventional cantilevers. Compared to piezoresistive cantilevers which tend to heat systems at low temperatures with powers in the 1mW range tuning forks do not produce any significant amount of heating power and are therefore ideal for future applications in 3He-systems or dilution refrigerators.
In conlusion, we have demonstrated the operation of piezoelectric tuning forks as sensors for dynamic mode scanning force microscopy at cryogenic temperatures and discussed their performance. The robustness of this sensor allows to achieve very high quality factors even under the otherwise problematic conditions of non-UHV environments. The force gradient detection method is well suited for force distance studies.
Financial support by ETH Zürich is gratefully acknowledged.
REFERENCES
- [1] P. Günther, U. Ch. Fischer, K. Dransfeld, Appl. Phys. B 48, 89 (1989).
- [2] K. Karrai, R. D. Grober, Appl. Phys. Lett. 66, 1842 (1995).
- [3] W. A. Atia, Ch. C. Davis, Appl. Phys. Lett. 70, 405 (1997).
- [4] A. G. T. Ruiter, K. O. van der Werf, J. A. Veerman, M. F. Garcia-Parajo, W. H. J. Rensen, N. F. van Hulst, Ultramicroscopy 71, 149 (1998), A. G. T. Ruiter, J. A. Veerman, K. O. van der Werf, and N. F. van Hulst, Appl. Phys. Lett. 71, 28 (1997)
- [5] J. Salvi, P. Chevassus, A. Mouflard, S. Davy, M. Spajer, D. Courjon, K. Hjort, L. Rosengren, Rev. Sci. Instr. 69, 1744 (1998).
- [6] D. P. Tsai, Y. Y. Lu, Appl. Phys. Lett. 73, 2724 (1998).
- [7] H. Edwards, L. Taylor, W. Duncan, A. J. Melmed, J. Appl. Phys. 82, 980 (1997).
- [8] F. J. Giessibl, Appl. Phys. Lett. 73, 3956 (1998).
- [9] M. Todorovic, S. Schultz, J. Appl. Phys. 83, 6229 (1998).
- [10] R. Steinke, M. Hoffmann, M. Böhmisch, J. Eisenmenger, K. Dransfeld, P. Leiderer, Appl. Phys. A 64, 19 (1997).
- [11] J. Rychen, T. Ihn, P. Studerus, A. Herrmann, K. Ensslin, Rev. Sci. Instr. 70, 2765 (1999).
- [12] J. Rychen, T. Ihn, and K. Ensslin, in preparation.
- [13] K. Karrai, R. D. Grober in Near Field Optics, eds. M. A. Paesler, P. J. Moyer, SPIE Proceedings Series, Vol. 2535, p.69 (1995).
- [14] H. J. Hug, B. Stiefel, P. J. A. van Schendel, A. Moser, S. Martin, and H.-J. Güntherodt, submitted to RSI.
- [15] K. Karrai, private communication
- [16] F. J. Giessibl, Phys. Rev. B 56, 16010 (1997).
- [17] R. Held, T. Vancura, T. Heinzel, K. Ensslin, M. Holland, W. Wegscheider, Appl. Phys. Lett. 73, 262 (1998).