Electronic Spectra and Their Relation to the Collective Mode in High- Superconductors
Abstract
Photoemission spectra of reveal that the high energy feature near , the “hump”, scales with the superconducting gap and persists above in the pseudogap phase. As the doping decreases, the dispersion of the hump increasingly reflects the wavevector characteristic of the undoped insulator, despite the presence of a large Fermi surface. This can be understood from the interaction of the electrons with a collective mode, supported by our observation that the doping dependence of the resonance observed by neutron scattering is the same as that inferred from our data.
pacs:
71.25.Hc, 74.25.Jb, 74.72.Hs, 79.60.BmIn the high temperature copper oxide superconductors, a small change in doping takes the material from an antiferromagnetic insulator to a d-wave superconductor. This raises the fundamental question of the relation of the electronic structure of the doped superconductor [1] to that of the parent insulator [2]. Here we examine this by using angle resolved photoemission spectroscopy (ARPES). We find that the spectral lineshape and its dispersion evolves as a function of doping from one which resembles a strong coupling effect of superconductivity in the overdoped limit to one which resembles the insulator in the underdoped limit. The connection between these two limits can be understood in terms of a collective mode [3, 4] which has the same wavevector characteristic of the magnetic insulator, and whose energy decreases as the doping is reduced. This is supported by our observation that the mode energy inferred from ARPES as a function of doping correlates strongly with that obtained directly from neutron scattering data [5], and points to the intimate relation of magnetic correlations to high superconductivity.
The experiments were carried out using procedures and samples described previously [6], as well as films grown by RF magnetron sputtering [7]. The doping level was controlled by varying oxygen stochiometry, with samples labeled by their onset . Spectra were obtained with a photon energy of 22 eV and a photon polarization directed along the CuO bond direction. Spectra had energy resolutions (FWHM) of 17, 26, or 34 meV with a momentum window of radius 0.045/a. Energies are measured with respect to the chemical potential, determined using a polycrystalline Pt or Au reference in electrical contact with the sample.
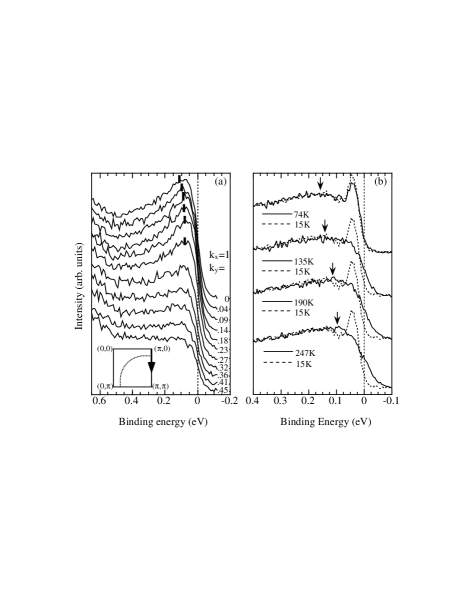
We begin with the evolution of the spectra of (Bi2212) near the point of the Brillouin zone (inset of Fig. 1a). In the underdoped region of the phase diagram (that lies between the undoped insulator and optimal doping, corresponding to the highest ), one observes a pseudogap ( meV) which is very likely associated with pairing above , a precursor to superconductivity [8, 6]. For temperatures above the pseudogap temperature scale [6] we see a broad peak which is chopped off by the Fermi function, as shown in Fig. 1a for an underdoped 83K sample at 200 K. In this respect, the one-particle spectral function of the underdoped compounds, which is completely incoherent, is similar to that observed in the overdoped compounds. While there is only weak dispersion from for , there is definite loss of integrated spectral weight [9] and one can identify the “Fermi surface” crossing [10].
As the temperature is reduced below , but still above , we see that the spectral function remains completely incoherent, as shown in Fig. 1b for an underdoped 89K sample. The leading edge pseudogap[8, 6] which develops below is difficult to see on the energy scale of Fig. 1b (the midpoint shift at 135K is 3 meV). However, a higher energy feature (the “high energy pseudogap”) can easily be identified by a change in slope of the spectra as a function of energy (see Fig. 2). On further reduction of the temperature below , a coherent quasiparticle peak begins to grow at the position of the leading edge gap, accompanied by a redistribution of the incoherent spectral weight leading to a dip and hump structure [11, 9]. The peak-dip-hump lineshape and the dispersion of these features will play a central role in our discussion.
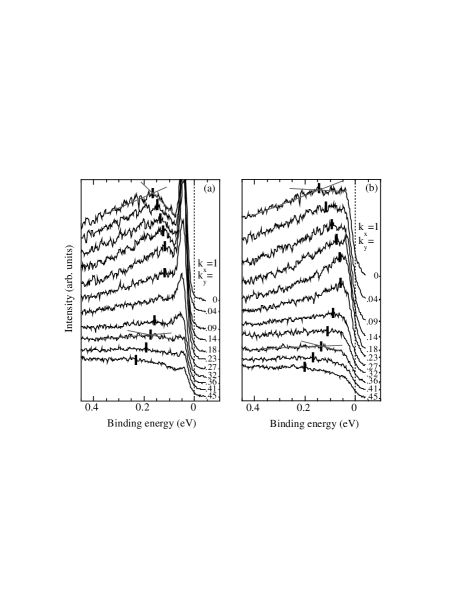
The high energy pseudogap feature is closely related to the hump below , as seen from a comparison of their dispersions. We show data along for an underdoped 75K sample in the superconducting state (Fig. 2a) and in the pseudogap regime (Fig. 2b). Below , the sharp peak at low energy is essentially dispersionless, while the higher energy hump rapidly disperses from the point towards the Fermi crossing [10] seen above . Beyond this, the intensity drops dramatically, but there is clear evidence that the hump disperses back to higher energy. In the pseudogap state, the high energy feature also shows strong dispersion [8, 12], much like the hump below , even though the leading edge is non-dispersive like the sharp peak in the superconducting state.
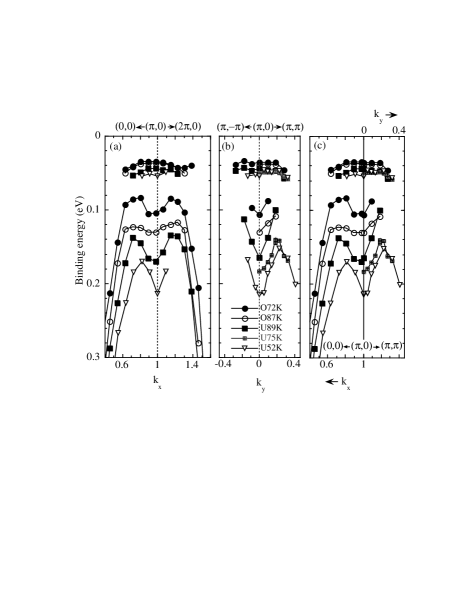
In Fig. 3 we show the dispersion of the sharp peak and hump (below ), for a variety of doping levels, in the vicinity of the point along the two principal axes. The sharp peak at low energies is seen to be essentially non-dispersive along both directions for all doping levels, while the hump shows very interesting dispersion. Along (Fig. 3a), the hump exhibits a maximum, with an eventual dispersion away from the Fermi energy, becoming rapidly equivalent to the binding energy of the broad peak in the normal state as one moves away from the region near [13]. In the orthogonal direction (Fig. 3b), since the hump initially disperses towards the Fermi crossing, which is known to be a weak function of doping[10], one obtains the rather dramatic effect that the dispersion becomes stronger with underdoping. We also note that there is an energy separation between the peak and the hump due to the spectral dip. In essence, the hump disperses towards the spectral dip, but cannot cross it, with its weight dropping strongly as the dip energy is approached. Beyond this point, one sees evidence of the dispersion bending back to higher binding energy for more underdoped samples.
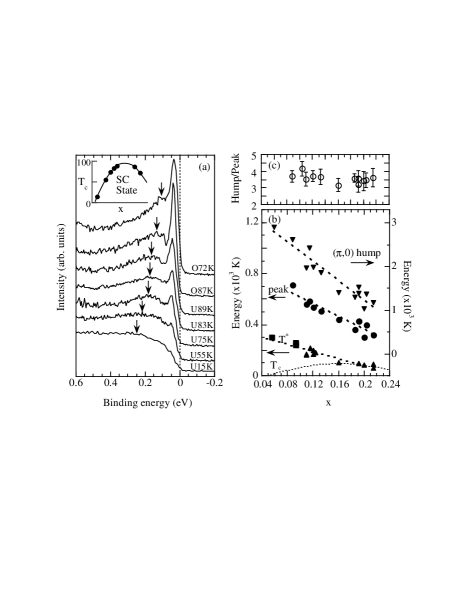
Fig. 4a shows the evolution of the low temperature spectra at the point as a function of doping. The sharp quasiparticle peak moves to higher energy, indicating that the gap increases with underdoping [14] (although this is difficult to see on the scale of Fig. 4a). We see that the hump moves rapidly to higher energy with underdoping [15]. These trends can be seen very clearly in Fig. 4b, where the energy of the peak and hump are shown as a function of doping for a large number of samples. Finally, we observe that the quasiparticle peak loses spectral weight with increasing underdoping, as expected for a doped Mott insulator; in addition the hump also loses spectral weight though less rapidly.
The hump below is clearly related to the superconducting gap, given the weak doping dependence of the ratio between the hump and quasiparticle peak positions at , shown in Fig. 4c. Tunneling data find this same correlation on a wide variety of high- materials whose energy gaps vary by a factor of 30 [16]. We have additional strong evidence [1, 13] that the peak and hump do not arise from two different “bands”.
Thus, the peak, dip and hump are features of a single spectral function, and imply a strong frequency dependence of the superconducting state self-energy (a “strong-coupling effect”). The hump represents the energy scale at which the spectral function below matches onto that in the normal state (as evident from the data in the bottom curve of Fig. 1b). However, the existence of the dip requires additional structure in the self-energy. We had suggested that this structure can be naturally understood in terms of electrons interacting with a sharp collective mode [13, 17] below , which also leads to an explanation of the non-trivial dispersion, as discussed below. It was speculated that the mode was the same as that observed directly by neutron scattering in [3, 4], and more recently in Bi2212 [18, 19].
To motivate the analysis below that firmly establishes the mode interpretation of ARPES spectra and its connection with neutron data, we need to recall [13, 17] that the spectral dip represents a pairing induced gap in the incoherent part of the spectral function at occurring at an energy , where is the superconducting gap and is the mode energy. We can estimate the mode energy from ARPES data from the energy difference between the dip () and the quasiparticle peak ().
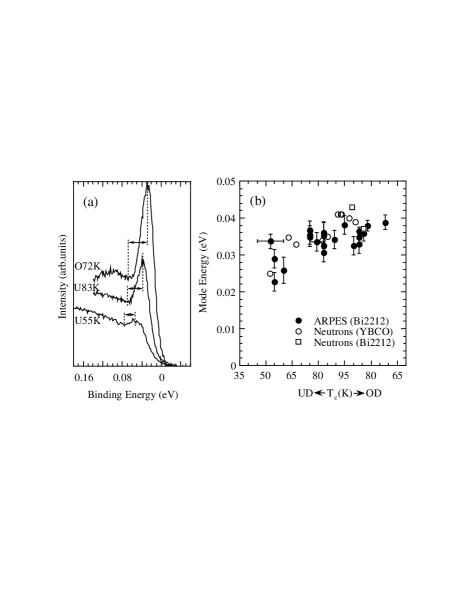
In Fig. 5b we plot the mode energy as estimated from ARPES for various doping levels as a function of and compare it with neutron measurements. We find striking agreement both in terms of the energy scale and its doping dependence [5]. We note that the mode energy inferred from ARPES decreases with doping, just like the neutron data, unlike the gap energy (Fig. 4b), which increases. This can be seen directly in the raw data, shown in Fig. 5a. Moreover, there is strong correlation between the temperature dependences in the ARPES and neutron data. While neutrons see a sharp mode only below , a smeared out remnant persists up to [20]. As the sharpness of the mode is responsible for the sharp spectral dip, one then sees the correlation with ARPES where the dip disappears above , but with a remnant of the hump persisting to .
An important feature of the neutron data is that the mode only exists in a narrow momentum range about , and is magnetic in origin[4]. To see a further connection with ARPES, we return to the results of Fig. 3. Note the dispersion along the two orthogonal directions are similar (Fig. 3c), unlike the dispersion inferred in the normal state[1]. As these two directions are related by a translation (), we see that the hump dispersion is clearly reflecting the nature of the collective mode. This dispersion is also consistent with a number of models [21, 22] in the literature which identify the high energy feature in the pseudogap regime as a remnant of the insulating magnet. We note, though, that the mode is due to quasiparticle pair creation and thus not just a continuation of the spin wave mode from the antiferromagnet [23].
This brings up a question that is at the heart of the high problem: how can a feature which can be understood as a strong coupling effect of superconductivity, as discussed above, turn out to have a dispersion that resembles that of a magnetic insulator? The reason is that the collective mode has the same wavevector, , which characterizes the magnetic order of the insulator. It is easy to demonstrate that in the limit that the mode energy goes to zero (long range order), one actually reproduces a symmetric dispersion similar to that in Fig. 3c, with the spectral gap determined by the strength of the mode[21]. This is in accord with the increase in the hump energy with underdoping (Fig. 4b) tracking the rise in the neutron mode intensity[5]. Since the hump scales with the superconducting gap, the obvious implication is that the mode is intimately connected with pairing, a conclusion which can also be made by relating the mode to the superconducting condensation energy [24]. That is, high superconductivity is likely due to the same magnetic correlations which characterize the insulator and give rise to the mode.
This work was supported by the National Science Foundation DMR 9624048, and DMR 91-20000 through the Science and Technology Center for Superconductivity, the U. S. Dept. of Energy, Basic Energy Sciences, under contract W-31-109-ENG-38, the CREST of JST, and the Ministry of Education, Science, and Culture of Japan. The Synchrotron Radiation Center is supported by NSF DMR 9212658. JM is supported by the Swiss National Science Foundation, and MR by the Swarnajayanti fellowship of the Indian DST.
REFERENCES
- [1] H. Ding, et al., Phys. Rev. Lett. 76, 1533 (1996).
- [2] B. O. Wells, et al., Phys. Rev. Lett. 74, 964 (1995); F. Ronning, et al., Science 282, 2067 (1998).
- [3] J. Rossat-Mignod, et al., Physica C 185-189, 86 (1991).
- [4] H. A. Mook, et al., Phys. Rev. Lett. 70, 3490 (1993); H. F. Fong, et al., ibid. 75, 316 (1995).
- [5] Neutron results are reviewed by P. Bourges, in The gap symmetry and fluctuations in high superconductors, ed. J. Bok, et al. (Plenum, New York, 1998), 349.
- [6] H. Ding, et al., Nature 382, 51 (1996).
- [7] Z. Konstantinovic, Z. Z. Li, and H. Raffy, Physica B 259-261, 567 (1999).
- [8] D. S. Marshall, et al., Phys. Rev. Lett. 76, 4841 (1996).
- [9] M. Randeria, et al., Phys. Rev. Lett. 74, 4951 (1995).
- [10] H. Ding, et al., Phys. Rev. Lett. 78, 2628 (1997).
- [11] D. S. Dessau, et al., Phys. Rev. Lett. 66, 2160 (1991).
- [12] P. J. White, et al., Phys. Rev. B 54, R15669 (1996).
- [13] M. R. Norman, et al., Phys. Rev. Lett. 79, 3506 (1997).
- [14] J. M. Harris, et al., Phys. Rev. B 54, R15665 (1996); H. Ding, et al., J. Phys. Chem. Solids 59, 1888 (1998).
- [15] R. B. Laughlin, Phys. Rev. Lett. 79, 1726 (1997).
- [16] J. Zasadzinski, et al., Proc. SPIE 2696, 338 (1996).
- [17] M. R. Norman and H. Ding, Phys. Rev. B 57, R11089 (1998).
- [18] H. A. Mook, F. Dogan, and B. C. Chakoumakos, preprint cond-mat/9811100.
- [19] H. F. Fong, et al., Nature 398, 588 (1999).
- [20] P. Dai, et al. Phys. Rev. Lett. 77, 5425 (1996).
- [21] A. P. Kampf and J. R. Schrieffer, Phys. Rev. B 42, 7967 (1990).
- [22] R. Preuss, W. Hanke, C. Grober, and H. G. Evertz, Phys. Rev. Lett. 79, 1122 (1997); J. Schmalian, D. Pines, and B. Stojkovic, ibid. 80, 3839 (1998); X.-G. Wen and P. A. Lee, ibid. 76, 503 (1996); Z.-X. Shen and J. R. Schrieffer, ibid. 78, 1771 (1997).
- [23] E. Demler and S.-C. Zhang, Phys. Rev. Lett. 75, 4126 (1995).
- [24] E. Demler and S.-C. Zhang, Nature 396, 733 (1998); P. Dai, et al., Science 284, 1344 (1999).
- [25] M. R. Presland, et al., Physica C 176, 95 (1991).