Similarity of slow stripe fluctuations between Sr-doped cuprates and oxygen-doped nickelates.
Abstract
Stripe fluctuations in La2NiO4.17 have been studied by 139La NMR using the field and temperature dependence of the linewidth and relaxation rates. In the formation process of the stripes the NMR line intensity is maximal below 230 K, starts to diminish around 140 K, disappears around 50 K and recovers at 4 K. These results are shown to be consistent with, but completely complementary to neutron measurements, and to be generic for oxygen doped nickelates and underdoped cuprates.
PACS numbers: 76.60.-k, 74.72.Dn, 75.30.Ds, 75.40.Gb
Evidence is accumulating that the electron systems in doped Mott-Hubbard insulators exhibit quite complex ordering phenomena[3]. In two dimensional (2D) systems this takes the form of stripe phases, where the excess charges bind to antiphase boundaries in the Néel state[4]. It was recently demonstrated by Hunt et al.[5] that in a large temperature regime where the stripe order appears to be complete according to diffraction experiments, the stripe system is still slowly fluctuating. This follows from NMR experiments, showing both motional narrowing at higher temperatures and a wipe-out of the NMR signal upon cooling down, caused by the characteristic fluctuation frequency becoming of the order of the NQR linewidth/splitting of a few MHz. Here we will demonstrate that these fluctuations are not unique to cuprate stripes, and thereby unrelated to intricacies associated with the proximity of the superconducting state. We present a NMR study of the stripe phase in oxygen doped La2NiO4. It seems well established that the excess oxygen enters as an interstitial that shows a tendency to order three dimenionally, creating a larger unit cell[6, 7, 8, 9]. It should therefore be regarded as a rather clean system compared to the Sr-doped nickelates[10]. We find that this ‘clean’ nickelate system exhibits a fluctuation behavior which closely parallels the fluctuations of the cuprate stripes: although scattering experiments in La2NiO4.13[9] show charge- and spin freezing at =220 K and =110 K, our NMR experiments in La2NiO4.17 indicate that the stripes only become static at a temperature of 2 K. Interestingly, these slow fluctuations seem absent in the ’dirty’ Sr-doped nickelate La5/3Sr1/3NiO4[11] (with the same 1/3 hole doping content as our oxygen doped nickelate), where SR[12] measurements reveal the onset of static spin order at the same temperature (200 K) as the (quasi)elastic peaks develop in the neutron scattering[13]. These observations suggest that the slow stripe fluctuations, characteristic for the cuprates and oxygen doped nickelates, are in first instance unrelated to quenched disorder; at the same time, that disorder is excessively effective in pinning these slow, intrinsic fluctuations in the insulator but not in the (super)conductor.
Below we analyze the field and temperature dependence of the 139La linewidth and relaxation rates for La2NiO4+δ with . 139La has a nuclear spin , which makes NMR sensitive to both charge and spin, and allows the study of charge and spin order and also the dynamics at time scales longer than . The measurements were performed on two single crystals from different batches that were prepared under atmospheric condition in a mirror oven at 1100 K[14]. Slices from both samples were analyzed by microprobe techniques; on the average the oxygen contents were found to be the same. Samples for the measurements were cut from those parts that had a homogeneous oxygen content and had a typical weight of 50 mg. Thermogravity (TGA) analysis of the oxygen concentration gave = 0.17. The same value follows from the volume of the unit cell as determined by X-ray[15]. Samples of batch 1 show a peak in the susceptibility () around 110 K, which is also seen in the 2/15-doped compounds[9] and is associated with oxygen order[16]. The absence of this peak in the other sample (batch 2) points to local differences in the two samples. Apart from the peak, the susceptibility of both samples show the same Curie like dependence on down to 80 K. Below that temperature down to 4 K increases smoothly, resembling (but not identical to) Curie-Weiss behavior with an antiferromagnetic exchange interaction. The -data above 100 K give a Ni moment of about one [14, 16]. The NMR results of the two batches are qualitatively identical with small differences in the freezing (see below) temperatures. The results presented relate to the samples of batch 2.
Line profiles as function of temperature were determined by frequency sweeps at fixed field (9.4 T and 4.7 T) or field sweeps at fixed frequency. Both methods give the same results. As detuning is not needed, the latter data have a better accuracy and are analysed in the following. Below 250 K, the () transition becomes visible and is seen to be split into two lines, A and B, Fig.1. In the same figure we show the results for the () transition, which develops a second component at about 230 K[17]. As we will further clarify, these lines have the same origin and correspond with La sites which are inequivalent because of different electrical field gradients[18]. We are facing the ambiguity that these differences can originate either in the distribution of the excess oxygen, or that it might reflect the inhomogeneous charge distribution associated with the stripes in the NiO2 planes: in both cases a similar pattern is expected[10]. At present we are further investigating these matters; important for the present context is that both lines reveal a very similar temperature dependence suggesting that both sites communicate with the same electronic system as we will now demonstrate.

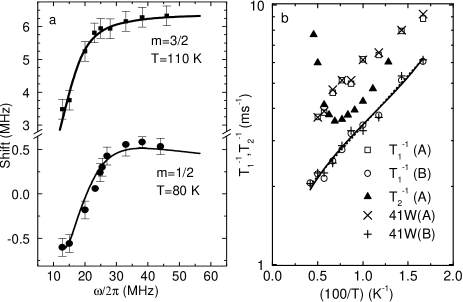
The field dependence of the two lines was measured in detail for both transitions. Only the position of B depends on field as illustrated for the and in Fig.2a. The -dependences of the spin-lattice relaxation rates () are shown in Fig.2b for the two lines, together with the spin dephasing rate () for the A line. is measured by a –––– sequence and analyzed with the multi-exponential expression of Narath[19]. The effective relaxation rates correspond to 41, the fundamental transition probability. The magnetic character of the relaxation mechanism below 200 K was checked by comparing the relaxation rates for the and transitions. When analyzed by the magnetic expression they gave the same . (A) is about twice as fast as (B).
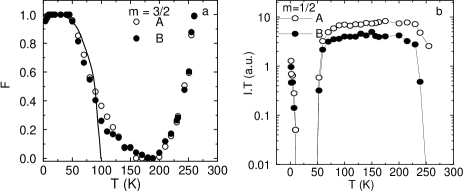
The intensity ratio of B to A depends on the cooling history, being larger when cooling proceeds slower. In Figs. 1-3 we show the results obtained after slowly cooling down. With decreasing temperature the intensity of the resonance lines first increases, then saturates around 150 K to disappear completely around 50 K. Fig.3 gives the dependence of the normalized intensity (log. scale) and of the wipe-out fraction (the intensities are integrated over the linewidth, corrected for the apparent ’s), defined as the ratio of the experimentally observed and the Curie extrapolated value.
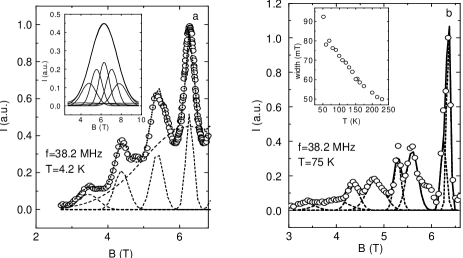
At lower temperatures the A and B lines resurrect again; at 4.2 K the linewidths at 38.2 MHz (A MHz, B MHz) are about 3 times larger than at 75 K, see fig.4. Also in zero field line B () is only broadened, not split, with a width which is comparable (3 MHz) to that found in field for the same transition. This width is an order of magnitude higher than the calculated effect of the dipolar field. There is only a faint -dependence in the position of the two lines. Above 50 K the width of A is increased by 50%, while that of line B is even less dependent.
Let us now turn to the interpretation of the data. Consistent with the neutron and susceptibility measurements in La2NiO4.13[9], we find in La2NiO4.17 the following temperature regimes:
(i) K. Only a narrow NMR line is visible with strongly reduced intensity. All visible La-sites experience the same (averaged) electrical field gradient. Oxygen motion explains the activated relaxation rates of the lines (not shown here, see ref.[17]) with an activation energy of K, and the increase of (A), shown in fig.2.
(ii) 250 K230 K. Due to oxygen/charge ordering the transition comes up with two lines A and B with an intensity ratio close to 2. Due to the small intensity this splitting is not yet visible in the line.
(iii) 230 K140 K. Below 230 K the same two inequivalent sites (A and B), that can be distinguished in the transition, broaden the line, Fig. 1. The field dependence of the line pattern is well explained by a quadrupolar interaction, drawn lines in Fig.2[10]. The saturation of the intensity ratio of two to one for the unshifted to shifted line around 230 K is expected for site ordered stripes[17, 18].
(iv) 140 K50 K. Slow motion of spins or charges wipes out most of the NMR intensity. The nuclei that can still be observed show additional line broadening and a relaxation rate, which is reminescent to the -dependence of in La2Cu1-xLixO4[20] or Sr doped La2CuO4[21] above the spin freezing temperature. can be fitted with an activated process with K (dotted line in Fig. 2) or a power law dependence with (drawn line in Fig. 2) and a spin freezing temperature of about 45 K. As the -dependence of the rates of A and B spins look identical, the ratio of a factor 2 is due to the strength of the hyperfine coupling to the electron spins. When analyzed in the renormalized classical limit[22], the activation energy equals the exchange constant . The magnetic correlation length above K is of the order of the lattice constant , and an order of magnitude larger around 40 K. In any case the relaxation rates are not related to the wipe-out process, see Figs.3,2. The same behavior is observed in the cuprates and it suggests[5] that the bulk of the stripe system is subjected to fluctuations on the MHz scale (the invisible fraction) while local events occur characterized by spin fluctuations on a much shorter time scale. Finally, it appears that the functional depenence of the wipe-out factor on is similar to that of the -wave BCS order parameter (see Fig. 3)[5].
(v) 50 K15 K. Wipe out of the NMR intensity is complete. The whole La-nuclear system experience the fluctuations on MHz time scales and the rare sites dealt with in the previous paragraph have disappeared completely.
(vi) 15 K. After emerging again, the La NMR lines are appreciably broadened with a width that is at least a few times larger for A than for B spins. This signals the onset of truly static order and it is noticed that even at the lowest temperatures where we measured (2 K) only 10% percent of the intensity has recovered. The line width reflects the static disorder (inhomogeneous broadening) and one would be tempted to ascribe this to spin glass behavior. Interestingly, we find that the width of does not depend on the field strength as expected for disorder originating in the charge sector[23].
When we compare our data with NMR data in underdoped La2-xSrxCuO4[5], the similarities in the wipe out process are striking. In all samples stripe structures are clearly seen in the neutron data, but seem to be absent in the NMR data. This apparent contradiction is solved if the wipe-out effect seen in the NMR data is associated with slow dynamics in the stripe system. Almost all cuprates, studied in ref.[5], are superconductors - the only non-superconducting sample with 0.04Sr content behaving anomalously as it shows no stripe fluctuations. In the cuprates at low doping, where the superconducting fraction seems to be very low, the wipe out fraction starts to grow typically below 50 K and equals around 20 K. Near optimal doping (0.15Sr content) is [5]. In the underdoped cuprates static magnetic hyperfine fields changes the NQR frequencies completely below 10 K[5], the same ordering temperature as seen by SR[24]. Here the comparison between cuprates and nickelates is elucidating. The nickelates are very poor conductors[25] and show no superconductivity. As mentioned above, in neutron scattering on the nickelates with oxygen doping of [9] charge order is observed around 210 K while spins order around 110 K: we find that static order only occurs at temperatures less than 10 K. The wipe out fraction of one is in agreement with the trend in the cuprate data. The onset of the wipe-out process around 140 K makes the combined action of spin and charge motion in the already formed stripes structure a plausible explanation for its origin. More specifically, the general pattern seems susceptible to an explanation in terms of dislocation melting. As is well understood in the context of two dimensional melting[26], dislocation unbinding leads to an overall fluid character of the system, and such a transition can occur also when the density of topological defects is low, i.e. in a regime where the time scales are large. However, we also found the fast spin relaxations in the fraction of the system which is still visible in NMR when the wipe out is nearly complete. We are tempted to ascribe those to the dislocations: we envisage that in the core region of the dislocations the spin system is strongly frustrated.
We end by mentioning the puzzling aspect related to the role of quenched disorder in the Sr doped nickelates, compared to oxygen doped systems we have been studying. Especially for hole doping of 1/3, the difference between oxygen (O4.17) and Sr doped (Sr0.33) nickelates is manifest[12]: in the neutron scattering spin ordering in O4.15 is seen around 110 K (the wipe out process in our samples starts around 140 K), while in Sr-doped samples this temperature is around 200 K (both in SR, NMR and NS). The differences go further. No strong wipe-out features are present for Sr0.33[11], and the intensity ratio of the two NMR lines differs from ours. We believe these effects to be linked to the effect of the ”quenched” Sr-dopant in this insulator, and we find an analogy with what happens in highly two-dimensional type II superconductors. As is well known in that field, pinning centers can suppress the formation of a flux liquid, i.e enhance the vortex melting temperature appreciably above the Kosterlitz-Thouless melting temperature.
In summary, our NMR study of stripes in oxygen doped La2NiO4 shows a striking similarity with the behavior found previously in cuprate superconductors. The stripe system is apparently a slowly fluctuating strongly correlated fluid over an extended range of temperatures. Since this behavior also occurs in the insulating nickelate, these fluctuations are uncorrelated to the proximity with the superconducting state, while it also appears as unlikely that it is completely driven by quenched disorder. We suspect that our findings are related to the peculiar character of the stripe phase itself.
We gratefully acknowledge fruitful discussions with S. Mukhin about theoretical aspects, with P.C. Hammel about the NMR results in La5/3Sr1/3NiO4, and D.E. MacLaughlin about NMR in spin-glass systems. One batch of the single crystals was prepared by Y.M. Mukovskii at the Steel and Alloys Institute in Moscow.
REFERENCES
- [1] permanent address: Physics Department, California State University, 5151 State University Drive, Los Angeles CA90032.
- [2] also at the University of Amsterdam.
- [3] V. J. Emery and S. A. Kivelson, Physica C 209, 597 (1993); id. 266, 44 (1996); J. Zaanen, J. Phys. Chem. Sol. 59, 1769 (1998) and ref’s therein.
- [4] J. Zaanen and O. Gunnarson, Phys. Rev. B 40, 7391 (1989); H.J. Schulz, Phys. Rev. Lett. 64, 1445 (1990); U. Löw, V.J. Emery, K. Fabricius, and S.A. Kivelson, Phys. Rev. Lett. 72, 1918 (1994).
- [5] A.W. Hunt, P.M. Singer, K.R. Thurber, and T. Imai, Phys. Rev. Lett. 82, 4300 (1999).
- [6] J.D. Jorgensen, B. Dabrowski, S. Pei, and D.G. Hinks, Phys. Rev. B 40, 2187 (1989).
- [7] J.Rodriguez-Carvajal, M.T. Fernández-Diaz, and J.L. Martinez, J. Phys. Cond. Matter 3, 3215 (1991).
- [8] A. Mehta and P.J. Heaney, Phys. Rev. B 49, 563 (1994).
- [9] J.M. Tranquada, P. Wochner, A.R. Moodenbaugh, and D.J. Buttrey, Phys. Rev. B 55, R6113 (1997); J.M. Tranquada, P. Wochner, and D.J. Buttrey, Phys. Rev. Lett. 79, 2133 (1997). .
- [10] Detailed consequences of the excess oxygen location [8, 9] for the NMR/NQR spectrum will be dealt with in a forthcoming paper.
- [11] Y. Yoshinari, P.C. Hammel, and S.-W. Cheong, Phys. Rev. Lett. 82, 3536 (1999).
- [12] Th. Jestädt et al., Phys. Rev. B. 59, 3775 (1999).
- [13] S.-H. Lee and S-W. Cheong, Phys. Rev. Lett. 79, 2514 (1997).
- [14] O.O. Bernal et al., Physica C 282-287, 1393 (1997).
- [15] D.E. Rice and D.J. Buttrey, J. Solid State Chem. 105, 197 (1993).
- [16] N.J. Poirot et al., J. Solid State Chem. 138, 260 (1998).
- [17] I.M. Abu-Shiekah et al., cond-mat/9805124.
- [18] In [17] the line splitting is wrongly ascribed to a magnetic effect; the decomposition of the line into two lines must be made in accordance with the line.
- [19] A. Narath, Phys. Rev. 162, 333 (1967).
- [20] B.J. Suh et al., Phys. Rev. Lett. 81, 2791 (1998).
- [21] F.C. Chou et al., Phys. Rev. Lett. 71, 2323 (1993). .
- [22] S. Tyĕ, B.I. Halperin, and S. Chakravarty, Phys. Rev. Lett. 62, 835 (1989).
- [23] S.A. Kivelson, E. Fradkin, and V.J. Emery, Nature 393, 550 (1998).
- [24] Ch. Niedermayer et al., Phys. Rev. Lett. 80, 3843 (1998).
- [25] P. Odier, N.J. Poirot, P. Simon, and D. Desousa Meneses, Eur. Phys. J. AP 5, 123 (1999).
- [26] J.M. Kosterlitz and D.J. Thouless, J. Phys. C 6, 1181 (1973).