[
Transport on an annealed disordered lattice
Abstract
We study the diffusion on an annealed disordered lattice with a local dynamical reorganization of bonds. We show that the typical rearrangement time depends on the renewal rate like with . This implies that the crossover time to normal diffusion in a slow rearrangement regime shows a critical behavior at the percolation threshold. New scaling relations for the dependence of the diffusion coefficient on the renewal rate are obtained. The derivation of scaling exponents confirms the crucial role of singly connected bonds in transport properties. These results are checked by numerical simulations in two and three dimensions.
pacs:
PACS numbers: 5.70.Jk, 72.60.+g, 82.70.Kj]
“Dynamic percolation” (“stirred percolation”) [1, 2] was introduced as a model of transport in environments that evolve in time, e.g. microemulsions or polymers (for further applications see [3]). The simplest version of the model is defined on a -dimensional regular lattice. Each pair of nearest neighbor sites is connected by a bond, which can be either conducting or insulating. We note the proportion of conducting bonds. Time evolution of the environment is achieved by a reorganization of bonds, defined below. Diffusion of a tracer particle in such a network is conveniently described by the ant-in-the-labyrinth paradigm [4]. Two basic algorithms are available. The “blind” ant chooses its direction randomly at each time step and moves only if the corresponding bond is conducting. The “Myopic” ant chooses among the conducting bonds. Both algorithms lead to the same scaling behavior of the diffusion coefficient. Two qualitatively different dynamic percolation models appeared in the literature. The global reorganization model is the simplest. After some renewal time , the assignment of conducting bonds is updated throughout the lattice. The behavior of this model is well understood [3], as it is closely related to the ordinary percolation. If is the mean square distance traveled on the quenched lattice during the time , the diffusion coefficient on the stirred lattice will be . The case of local reorganization, which is studied in this article, is more realistic, because the evolution of the network is continuous. The state of a bond evolves through a Poissonian process with a characteristic time . At each iteration a conducting bond is cut with a probability , and a randomly chosen non conducting bond becomes conducting, to insure that the proportion of conducting bonds is conserved. No exact result is available for the dependence of the diffusion coefficient on and , except in some particular one dimensional situations [5]. Approximative solutions of the problem in any dimension can be obtained by means of a time-dependent version of the effective-medium approximation developed in [2].
Here, we study the scaling of the diffusion coefficient in the vicinity of the percolation threshold of the quenched network. Several different scaling formulas for were proposed in the literature. They were derived for models with slightly different local evolution rules, but the details in the local rules are not relevant for the critical behavior around [6]. As discussed below, our simulation results do not support current predictions. We derive a new scaling formula for the diffusion coefficient, which we confirm by extensive numerical simulations. The behavior at the percolation threshold is studied first, before we treat the general case of the behavior around .
The mean square displacement in the vicinity of on a quenched percolation network is given by [7]
| (1) |
where is the anomalous-diffusion exponent, and
At early times, anomalous diffusion is observed. The crossover to a normal diffusion (if ) or to a localization regime (if ) appears at a time of the order of , which is the only relevant timescale of the problem. In the case of dynamically disordered lattices, another timescale, related to the cluster rearrangement process, has to be taken into account. We define this typical “rearrangement” time as crossover time from anomalous to normal diffusion at the percolation threshold. It is only a function of the evolution rate , and we assume a dependence in the form . The mean square displacement in the presence of dynamical disorder is thus described by a scaling formula depending on two parameters, and [1]:
| (2) |
At the percolation threshold, diverges, and the preceding expression reads
| (3) |
where as and as . The diffusion coefficient is obtained in the limit by
| (4) |
Eq. (4) contains an unknown parameter . Several values of were proposed in the literature. In [6], the problem was mapped on the continuous random walk, and the lower and upper bounds for were predicted. In [1] is considered. The only justification for this value is the assumption that the global and local rearrangement models have the same behavior. We have performed Monte Carlo simulations to evaluate numerically. The diffusion coefficient can only be measured for small values of , where the crossover time is small. In order to explore a broader range of values, we have determined from the finite size scaling relation (3). We measured for between and in two dimensions, and between and in three dimensions. In two dimensions the best data collapse with parameter is obtained for (Fig. 1), in three dimensions for (Fig. 2). Identical results were obtained with both the myopic and the blind ant algorithms.


As a matter of fact, the value of can be evaluated as a function of known critical exponents using simple assumptions about the geometry of clusters. Clusters are composed of well connected blobs, interconnected by singly connected bonds (“red bonds”) [8]. If a red bond is cut, the cluster breaks into two parts. We argue that the crossover time corresponds to a removal (or addition) of a red bond in the region visited by the tracer particle. The red bonds are the only possible paths where a particle can escape from a blob, hence they control the diffusion. For a particle visits on average a hypersphere of a diameter . The “network” of red bonds is fractal, and their number inside the hypersphere grows as [9]. The crossover corresponds to the average time for the first of red bonds to be cut. Hence , giving
| (5) |
In two dimensions, where , [10] and [11] we obtain . In three dimensions is obtained, using , [12] and [13]. These values of are in excellent agreement with numerical results. Relation (5) predicts that for , so in this limit the local and the global reorganization rules lead to the same scaling.
Knowing the value of , the complete scaling law for in the vicinity of the percolation threshold can be deduced from (2). The ratio separates two different regimes. In the fast rearrangement regime () a tracer particle does not see the finiteness of cluster sizes, hence the scaling of is given by (4). In the slow rearrangement regime () two cases have to be considered. For and , known results for the diffusion on the quenched network [7] should be recovered, hence
| (6) |
For the situation is more complicated. At , the network is not yet reorganized and anomalous diffusion crossovers to a localization regime on a finite cluster exactly in the same way as for the quenched network. The mean square displacement is thus . For it grows as
For a diffusive regime is reached, and it is evident that in this case. Thus the scaling function behaves as for , where the coefficient reads
| (7) |
The final expression was obtained replacing by (5). Then in two dimensions and in three dimensions. The scaling relation for can thus be written as a function of a unique parameter
| (8) |
with for , for . It is readily seen that the crossover time has itself a critical behavior near with an exponent . This fact has been already predicted in [14] but a different exponent was proposed. The scaling of in the slow rearrangement regime is simply deduced from (8),
| (9) |
The complete scaling law for consistent with (4) (6) and (9) reads
| (10) |
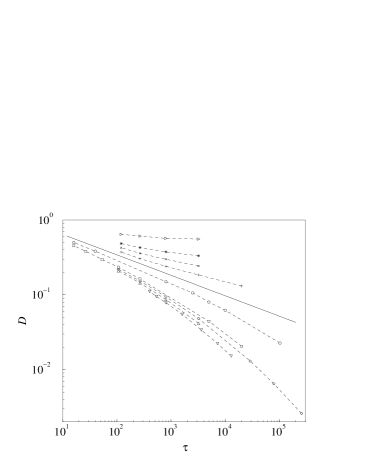
with
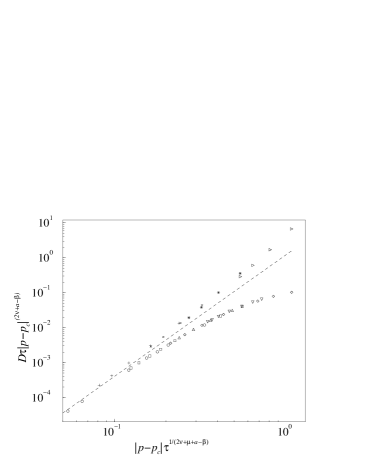
To verify this relation, we have calculated the diffusion coefficient in two dimensions for different values of and for in the range and , using the algorithm of the myopic ant. Results are presented in Figure 3. They are well rescaled by the relation (10) (Fig. 4). The best collapse seems to be reached for a slightly smaller value of () than predicted by (7) (). However, the collapse is not very sensitive on the precise value of , because the slow rearrangement regime is not explored in our range of (). It is difficult to attain this regime using a simple random walk, since the crossover time to the diffusive behavior becomes too important for large values of . This is the reason why we used the following algorithm to verify Eq. (9).

We start from a given site belonging to a cluster of sites. We suppose that the evolution of the network is quasistatic : before the network is rearranged, the particle is thermalized, so that the probability to find it on a given cluster site equals . Thus we assign at first the probability to each cluster site. We then exchange one conducting bond with an insulating bond, find a new cluster distribution and thermalize the probability distribution on each cluster. We iterate this procedure and measure the mean square displacement. The Hoshen-Kopelman algorithm [15] was used to obtain the distribution of clusters. To get good statistics, an average over more than 2000 realizations was performed, so we were limited to networks of relatively small size (up to sites). Since the diffusive regime is not attained on such a small network, we used the finite size scaling formula (8). We measured for ranging from 0.4 to 0.46. For higher values of , clusters are too large, and much bigger networks have to be used. The data collapse is obtained for (Figure 5), that is for a value slightly smaller than predicted by (7). The same effect as in the case of the data collapse of is thus encountered. The discrepancy is due to fact that we are already out of the critical region, so corrections to the exponents and should be taken into account. For values of far from , the probability of having a large cluster, corresponding to a long jump, grows more slowly than near , and the growth of the diffusion coefficient with is thus also slower.
In conclusion, we have derived a new scaling law for the diffusion coefficient in the case of a simple model of stirred percolation. The dependence of the scaling exponents on the basic exponents of the percolation theory was found. We showed that the distribution of red bonds controls the transport in the network. Results are supported by extensive numerical simulations. In the slow rearrangement regime for the diffusion coefficient scales as , where in three dimensions. The value of the scaling exponent in microemulsions () [17, 18, 19] thus cannot be explained by this simple model, as suggested earlier [16]. It is plausible that the difference is due to interparticle interactions present in microemulsions. They play an important role in the formation of clusters [20] and they might also influence the dynamics of the reorganization of the environment.
I would like to thank Jérôme Chave for many fruitful conversations and Hugues Chaté for a careful reading of the manuscript. I also thank Roger Bidaux and Marc A. Dubois for useful discussions.
REFERENCES
- [1] R. Kutner and K. W. Kehr, Philos. Mag. A 48, 199 (1983).
- [2] A. K. Harrison and R. Zwanzig, Phys. Rev. A 32, 1072 (1985).
- [3] A. Nitzan and M. A. Ratner, J. Phys. Chem. 98, 1765 (1994).
- [4] P. G. de Gennes, La Recherche 7, 919 (1976).
- [5] E. Hernández-García, L. Pesquera, M. A. Rodríguez, and M. San Miguel, J. Stat. Phys. 55, 1027 (1989).
- [6] A. L. R. Bug and Y. Gefen, Phys. Rev. A 35, 1301 (1987).
- [7] S. Havlin and D. Ben-Avraham, Adv. Phys. 36, 695 (1987).
- [8] A. Coniglio, J. Phys. A 15, 3829 (1982).
- [9] A. Coniglio, Phys. Rev. Lett. 46, 250 (1981).
- [10] D. Stauffer and A. Aharony, Introduction to Percolation Theory (Taylor&Francis, 1992).
- [11] D. J. Frank and C. J. Lobb, Phys. Rev. B 37, 302 (1988).
- [12] D. G. Gingold and C. J. Lobb, Phys. Rev. B 42, 8220 (1990).
- [13] J. Adler, Y. Meir, A. Aharony and A. B. Harris, Phys. Rev. B 41, 9183 (1990).
- [14] A. R. Kerstein and B. F. Edwards, Phys. Rev. B 33, 3353 (1986).
- [15] J. Hoshen and R. Kopelman Phys. Rev. B 14, 3438 (1976).
- [16] G. S. Grest, I. Webman, S. A. Safran, and A. L. R. Bug, Phys. Rev. A 33, 2842 (1986).
- [17] M. Laguës, J. Phys. (Paris) Lett. 40, L-331 (1979).
- [18] S. Bhattacharya, J. P. Stokes, M. W. Kim, and J. S. Huang, Phys. Rev. Lett. 55, 1884 (1985).
- [19] C. Cametti, P. Codastefano, P. Tartaglia, J. Rouch and S. H. Chen, Phys. Rev. Lett. 64, 1461 (1990).
- [20] S. A. Safran, I. Webman and G. S. Grest, Phys. Rev. A 32, 506 (1985).