[
Optical spectroscopic study of the interplay of spin and charge in -NaV2O5
Abstract
We investigate the temperature dependent optical properties of -NaV2O5, in the energy range 4 meV-4 eV. The symmetry of the system is discussed on the basis of infrared phonon spectra. By analyzing the optically allowed phonons at temperatures below and above the phase transition, we conclude that a second-order change to a larger unit cell takes place below 34 K, with a fluctuation regime extending over a broad temperature range. In the high temperature undistorted phase, we find good agreement with the recently proposed centrosymmetric space group Pmmn. On the other hand, the detailed analysis of the electronic excitations detected in the optical conductivity, provides direct evidence for a charge disproportionated electronic ground-state, at least on a locale scale: A consistent interpretation of both structural and optical conductivity data requires an asymmetrical charge distribution on each rung, without any long range order. We show that, because of the locally broken symmetry, spin-flip excitations carry a finite electric dipole moment, which is responsible for the detection of direct two-magnon optical absorption processes for . The charged-magnon model, developed to interpret the optical conductivity of -NaV2O5, is described in detail, and its relevance to other strongly correlated electron systems, where the interplay of spin and charge plays a crucial role in determining the low energy electrodynamics, is discussed.
]
I Introduction
After many years of intensive experimental and theoretical work on CuGeO3 another inorganic compound, -NaV2O5, has been attracting the attention of the scientific community working on low-dimensional spin systems, in general, and on the spin-Peierls (SP) phenomenon, in particular. In fact, in 1996 the isotropic activated behavior of the magnetic susceptibility has been observed at low temperatures on -NaV2O5.[2] Moreover, superlattice reflections, with a lattice modulation vector , were found in an x-ray scattering experiment,[3] and a spin gap =9.8 meV was observed, at the reciprocal lattice point , with inelastic neutron scattering.[3] The SP picture was then proposed to explain the low temperature properties of this compound, with a SP transition temperatures =34 K.[2] In this context, -NaV2O5 seemed to be a particularly interesting material, as far as the full understanding of the SP phenomenon is concerned, because on the basis of the structural analysis reported by Carpy and Galy in 1975, suggesting the noncentrosymmetric space group ,[4] it was assumed to be described by the one-dimensional (1D) spin-1/2 Heisenberg (HB) model better than CuGeO3. In fact, for the latter compound it has been established both experimentally[5] and theoretically[6] that the 2D character of the system cannot be neglected.
On the other hand, on the basis of experimental results later obtained, the interpretation of the phase transition is still controversial. First of all, the reduction of upon increasing the intensity of an externally applied magnetic field, expected for a true SP system, has not been observed.[7, 8] For instance, Büchner et al.,[7] performing low temperature magnetization and specific heat measurements in magnetic field T, obtained K, i.e., almost a factor of 7 smaller that what expected on the basis of Cross and Fisher theory.[9, 10] Furthermore, they claimed that the entropy reduction experimentally observed across the phase transition is considerably larger than the theoretical expectation for a 1D antiferromagnetic (AF) HB chain with only spin degrees of freedom and meV (i.e., value obtained for -NaV2O5 from magnetic susceptibility measurements[2]). In order to explain these findings, degrees of freedom additional to those of the spin system should be taken into account, contrary to the interpretation of a magnetically driven phase transition.[7]
This already quite puzzling picture became even more complicated when the crystal structure and the symmetry of the electronic configuration of -NaV2O5, in the high temperature phase, were investigated in detail. In fact, on the basis of new x-ray diffraction measurements[11, 12, 13] it was found that the symmetry of this compound at room temperature is better described by the centrosymmetric space group than by the originally proposed .[4] On the other hand, the intensities and polarization dependence of the electronic excitations detected in optical conductivity spectra gave a direct evidence for a broken-parity electronic ground state,[14, 15] in apparently better agreement with the noncentrosymmetric space group . The solution of this controversy and the assessment of the symmetry issue are of fundamental importance for the understanding of the electronic and magnetic properties of the system and, ultimately, of the phase transition.
In this paper we present a detail investigation of the interplay of spin and charge in -NaV2O5, on the basis of optical reflectivity and conductivity data in the energy range 4 meV-4 eV. We will start from the discussion of the newly proposed high temperature crystal structure,[11, 12, 13] and its implications on the physics of this compound (section II). A group theoretical analysis for the two different space groups will be reported and later compared to the experimentally observed far-infrared phonon spectra. In section III, we will present a theoretical model which we will use to interpret qualitatively and quantitatively the optical conductivity spectra of -NaV2O5. In section IV, we will analyze the data obtained with optical spectroscopy at different temperatures above and below K (throughout the paper, we will refer to the transition temperature as because the interpretation of the phase transition is still controversial). In particular, we will concentrate on:
(i ) Analysis of the temperature dependent phonon spectra, in relation to the x-ray diffraction data, in order to: First, learn more about the symmetry of the material in both high and low temperature phase. Second, detect signatures of the lattice distortion and study the character of the phase transition.
(ii ) Detailed study of the very peculiar electronic and magnetic excitation spectra. In particular, we will show that we could detect a low frequency continuum of excitations which, on the basis of the model developed in section III, we ascribe to ‘charged bi-magnons’, i.e., direct two-magnon optical absorption processes.
Finally in section V, we will discuss the relevance of our findings to the understanding of the nature of the phase transition in -NaV2O5. In particular we will try to assess whether the picture of a charge ordering transition, accompanied by the opening of a magnetic gap, is a valid alternative to the originally proposed SP description. In fact, this alternative interpretation has been recently put forward,[16, 17, 18, 19, 20] on the basis of temperature dependent nuclear magnetic resonance (NMR) data.[16]
II The Symmetry Problem in -NaV2O5
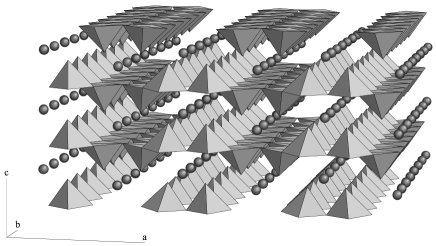
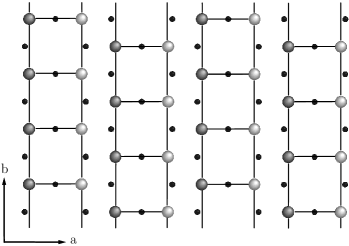
The interpretation of the phase transition at 34 K as a SP transition[2] is based on the noncentrosymmetric space group originally proposed by Carpy and Galy for the high temperature phase of -NaV2O5.[4] Following their crystallographic analysis, the structure can be constructed from double-rows (parallel to the b axis) of edge sharing pyramids, one facing up and the other down, with respect to the a-b plane (see Fig. 1). These double rows are connected by sharing corners, yielding a planar material. The planes are stacked along the c axis, with the Na in the channels of the pyramids. In the a-b plane (see Fig. 2), we can then identify linear chains of alternating V and O ions, oriented along the b axis. These chains are grouped into sets of two, forming a ladder, with the rungs oriented along the a axis. The rungs are formed by two V ions, one on each leg of the ladder, bridged by an O ion. The V-O distances along the rungs are shorter than along the legs, implying a stronger bonding along the rung. In the a-b plane the ladders are shifted half a period along the b axis relative to their neighbors. The noncentrosymmetric space group , allows for two inequivalent V positions in the asymmetric unit. These sites were interpreted as different valence states, V4+ and V5+, represented by dark and light gray balls, respectively, in Fig. 2. In this structure it is possible to identify well-distinct 1D magnetic V4+ (S=1/2) and non-magnetic V5+ (S=0) chains running along the b axis of the crystal, and alternating each other along the a axis. This configuration would be responsible for the 1D character (Bonner-Fisher-type[21]) of the high temperature susceptibility[22] and for the SP transition, possibly involving dimerization within the V4+ chains.[2] Moreover, due to the details of the crystal structure, only one of the three orbitals of V4+, i.e., the orbital, is occupied.[13] As a result, the insulating character of -NaV2O5, which has been observed in DC resistivity measurements,[23, 24] would be an obvious consequence of having a 1D 1/2-filled Mott-Hubbard system.
However, recent redeterminations of the crystal structure[11, 12, 13] showed that the symmetry of -NaV2O5 above is better described by the centrosymmetric space group Pmmn: The suggested structure is very similar to the one proposed by Carpy and Galy[4] (a small difference is the somewhat more symmetric eight-fold coordination of Na[11]). On the other hand, one major difference was found, namely, the presence of a center of inversion in the unit cell. The evidence is the very low -value of 0.015, and the fact that no lower value of can be obtained when the x-ray diffraction data are refined omitting the inversion center.[11] In particular, this result suggests the existence of only one kind of V per unit cell, with an average valence for the V ions of +4.5. This finding has important implications for the understanding of the electronic and magnetic properties of -NaV2O5. In fact, we have now to think in the framework of a 1/4-filled two-leg ladder system: It is still possible to recover an insulating ground state assuming that the d electron, supplied by the two V ions forming a rung of the ladder, is not attached to a particular V site but is shared in a V-O-V molecular bonding orbital along the rung.[13] In this way, we are effectively back to a 1D spin system (a two-leg ladder with one spin per rung in a symmetrical position). However, in case of a SP phase transition, singlets would have to be formed by electrons laying in molecular-like orbitals and a rather complicated distortion pattern would have to take place: Not simply the dimerization within a real 1D chain (as, e.g., in CuGeO3), but a deformation of the plaquettes, formed by four V ions, within a ladder.
Regarding the controversy about the x-ray structure determination for -NaV2O5 above , it is important to stress that, even though it is now well established that the ‘most probable’ space group is the centrosymmetric Pmmn (on the basis of the statistics of the refinement), deviations from centrosymmetry up to 0.029 Å are unlikely but cannot be excluded.[11] Moreover, one has to note that x-ray diffraction measurements are sensitive to the charge distribution of core electrons and not of valence electrons. Therefore, if a local breaking of symmetry in the distribution of the V d electrons were present on a local scale without the long range order required by the noncentrosymmetric space group (as suggested by the optical conductivity data we will present in section IV D), it would not be detectable in an x-ray diffraction experiment: X-rays would just see the ’space-average’ given by the centrosymmetric space group Pmmn.
A Group Theoretical Analysis
An alternative way to assess the symmetry issue is to investigate the Raman and infrared phonon spectra, comparing the number of experimentally observed modes to the number expected for the two different space groups on the basis of group-theory. Obviously, a large number of modes has to be expected because each unit cell contains two formula units, corresponding to 48 degrees of freedom, which will be reflected in 48 phonon branches.
In the space group Pmmn the site groups in the unit cell are: for the 2 Na and the 2 O(1) atoms, and for the 4 V, the 4 O(2), and the 4 O(3). Following the nuclear site group analysis method extended to crystals,[25] the contribution of each occupied site to the total irreducible representation of the crystal is:
| (1) | |||
| (2) | |||
| (3) |
Subtracting the silent modes (3) and the acoustic modes (), the irreducible representation of the optical vibrations, for the centrosymmetric space group Pmmn, is:
| (5) | |||||
corresponding to 24 Raman (,,,) and 18 infrared (,,) active modes.
In the analysis for the noncentrosymmetric space group , we have to consider only the site group for all the atoms in the unit cell: 2 Na, 2 V(1), 2 V(2), 2 O(1), 2 O(2), 2 O(3), 2 O(4), and 2 O(5). Therefore, the total irreducible representation is:
| (6) |
Once again, subtracting the acoustic modes (there is no silent mode in this particular case), the irreducible representation of the optical vibrations, for the noncentrosymmetric space group , is:
| (8) | |||||
corresponding to 45 Raman (,,,) and 37 infrared (,,) active modes.
As a final result, we see that the number of optical vibrations, expected on the basis of group theory, is very different for the two space groups. Moreover, whereas in the case of Pmmn the phonons are exclusively Raman or infrared active, for , because of the lack of inversion symmetry, there is no more distinction between gerade and ungerade and certain modes are, in principle (group theory does not say anything about intensities), detectable with both techniques.
III Charged-Magnon Model
In the context of the extensive work done, in the last few years, on 2D S=1/2 quantum AF and their 1D analogs, it has been shown both experimentally and theoretically[26, 27, 28, 29, 30, 31] that also optical spectroscopy, besides elective techniques like Raman and neutron scattering, can be a very useful probe in studying the spin dynamics in this systems. For example, in the 2D-system La2CuO4 (1D-system Sr2CuO3) where two-magnon (two-spinon) excitations are in principle not optically active because of the presence of a center of inversion that inhibits the formation of any finite dipole moment, phonon-assisted magnetic excitations were detected in the mid-infrared region.[26, 29] These magneto-elastic absorption processes are optically allowed because the phonon there involved is effectively lowering the symmetry of the system.
Let us now concentrate on a system where a breaking of symmetry is present because of charge ordering. We show that, in this case, magnetic excitations are expected to be directly optically active and detectable in an optical experiment as charged bi-magnons: Double spin-flip excitations carrying a finite dipole moment. We will do that investigating the spin-photon interaction in a single two-leg ladder with a charge disproportionated ground state. On the basis of this model we will later interpret the optical conductivity spectra of -NaV2O5.
A Model Hamiltonian
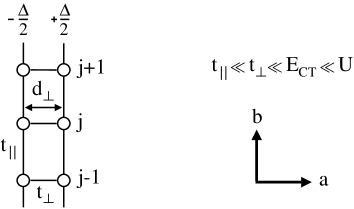
In this section we discuss the single two-leg ladder depicted in Fig. 3, where and are the hopping parameters for the rungs and the legs, respectively, is the length of a rung, and -/2 and +/2 are the on-site energies for the left and the right leg of the ladder, respectively. We work at quarter filling, i.e., one electron per rung. The total Hamiltonian of the system is:
| (9) | |||||
| (11) | |||||
| (12) | |||||
| (13) |
where () creates an electron with spin on the left-hand (right-hand) site of the j th rung, is the on-site Hubbard repulsion, () is counting the double occupancies on the right-hand (left-hand) site, is the charge displacement operator, and is the potential energy difference between the two sites. Considering only at quarter filling one immediately realizes that is not only breaking the left-right symmetry of the system (for the symmetric ladder ), but it is also introducing a long range charge ordering with one electron per site on the left leg of the ladder. Working in the limit we can consider each rung as an independent polar molecule (with one electron) described by the Hamiltonian . The two solutions are lob-sided bonding and antibonding wave functions , and , with:
| (14) |
where is the splitting between these two eigenstates. The excitation of the electron from the bonding to the antibonding state is an optically active transition with a degree of charge transfer (CT) from the left to the right site which is the larger the bigger is . It is possible to calculate the integral of the real part of the optical conductivity for this excitation, quantity that can be very useful in the analysis of optical spectra. We start from the general equation:[32]
| (15) |
where V is the volume, is the electron charge and i is the site index. As for a single rung , we obtain the following expression, which is exact for one electron on two coupled tight-binding orbitals:
| (16) |
where N is the volume density of the rungs. Comparing Eq. 16 and the expression for with the area and the energy position of the CT peak observed in the experiment, we can extract both and .
In the ground state of the Hamiltonian , each electron resides in a orbital, with some admixture of . Let us now introduce the coupling of the rungs along the legs, considering and a small fragment of the ladder with only two rungs. We have now to take into account the spin degrees of freedom: If the two spins are parallel, the inclusion of has no effect, due to the Pauli-principle. If they form a state, the ground state can gain some kinetic energy along the legs by mixing in states where two electrons reside on the same rung. We start from the singlet ground state for the two rungs:
| (17) |
with eigenvalue , and we study the effect of using a perturbation expansion in , to the second order. However, does not coincide with any of the singlet eigenstates of the system consisting of two electrons on one rung with the Hamiltonian . In order to obtain the exchange coupling constant between two spins on neighboring rungs, we have first to calculate the set of spin-singlet eigenstates for the two electrons on one rung, and then to evaluate the fractional parentages of with respect to that set. The Hilbert subspace of two-electron spin-singlet states is spanned by the vectors:
| (18) | |||||
| (19) | |||||
| (20) |
On this basis the Hamiltonian of the j th rung is:
| (21) |
A significant simplification of the problem occurs in the large limit which, moreover, elucidates the physics of exchange processes between a pair of dimers in an elegant and simple way. We therefore take the limit . The solutions for are:[33] The (anti)-symmetric linear combinations of and with energy , and with energy . The triplet states have energy 0. For a general value of , still obeying , the only relevant eigenstate for the calculation of the exchange processes between neighboring dimers is , with energy . The other two states with energy of order are projected out in this limit.
We can now go back to the problem of two rungs with one electron per rung, and consider the hopping along the legs treating as a small perturbation with respect to . We proceed by calculating the corrections to by allowing a finite hopping parameter between the rungs. Using lowest order perturbation theory, the ground state energy of a spin-singlet is:
| (22) |
We proceed by calculating the coefficients of fractional parentage by projecting on the two-electron single eigenstates of a single rung:
| (24) | |||||
Calculating the second order correction to for the =0 state, in the limit where , and realizing that the correction for the =1 spin configuration is zero, we obtain the exchange coupling constant :
| (25) |
B Interaction Hamiltonians and Effective Charges
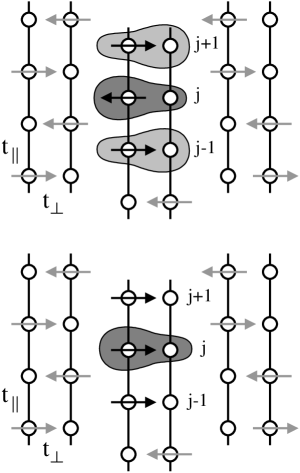
Let us now consider three rungs of the ladder (see Fig. 4) to understand the role of spin-flip excitations in this system. Because of the energy gain , in the ground state we have antiparallel alignment of the spins (Fig. 4, left-hand side).
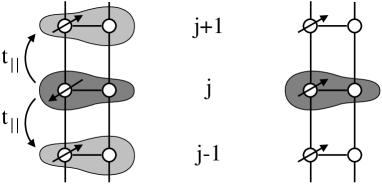
The j th electron is described by the lob-sided bonding wave function and, because of the virtual hopping to the nearest-neighbor (nn) rungs, by states where two electrons reside on the same rung. Working in the limit these states have one electron in the and one in the state on the same rung. Therefore, the charge of the j th electron is asymmetrically distributed not only over the j th rung (dark grey area in Fig. 4, left) but also on the nn rungs (light grey area in Fig. 4, left). However, in the latter case most of the charge density is localized on the right leg of the ladder. If we flip the spin of the j th electron (Fig. 4, right-hand side) no virtual hopping is possible any more to the nn rungs because of the Pauli principle. The electron charge distribution is now determined only by the lob-sided wave function (dark grey area in Fig. 4, right). As a result, there is a net dipole displacement of the antiparallel spin configuration compared to the parallel one: The spin-flip excitations carry a finite dipole moment parallel to the rung direction (a axis). This dipole moment can couple to the electric field of the incident radiation in an optical experiment, and result in what we refer to as charged bi-magnon excitations. One may remark, at this point, that only double spin flips can be probed in an optical experiment because of spin conservation. However, what we just discuss for a single spin flip can be extended to the situation where two spin flips, on two different rungs, are considered.
The coupling to light with (rung direction) can now be included using the dipole approximation. The only effect is to change the potential energy of the states relative to the states. In other words, we have to replace with , where is the component of the electric field along the rung. The coupling to the CT transition on the rungs is given by the Hamiltonian:
| (26) |
The Hamiltonian for the spin-photon coupling can be obtained taking the Taylor expansion of with respect to , and retaining the term which is linear in the electric field. Noticing that , we have:
| (27) |
where is the effective charge involved in a double spin-flip transition, and . In the limit , the effective charge reduces to:
| (28) |
where is given by Eq. 25. One has to note that for a symmetrical ladder, where , the effective charge vanishes, and the charged magnon effect disappears: The peculiar behavior of the spin flips we just described is an exclusive consequence of the broken left-right symmetry of the ground state. On the other hand, the bonding-antibonding transition would still be optically active. However, the bonding-antibonding energy splitting would be determined only by , i.e., . At this point we like to speculate on the role played by in determining not only the optical activity of the double spin-flip excitations but also the insulating (metallic) nature of the system along the leg direction. For and for strong on-site Coulomb repulsion , the energy cost to transfer one electron from one rung to the neighboring one is . Therefore, the system is insulating for and metallic in the opposite case. If we now start from a metallic situation , switching on we can realize the condition which would result in a metal-insulator transition and, at the same time, in optical activity for the charged bi-magnons.
C Spectral Weights
In this section we will attempt to estimate what would be, in an optical experiment, the relative spectral weights for the CT and the charged bi-magnon excitations of the single two-leg ladder. In particular, we want to show that these quantities can be expressed in terms of properly defined correlation functions. Considering the integral of the optical conductivity, Eq. 15, and the interaction Hamiltonians and , we can write:
| (29) | |||||
| (30) |
Let us first concentrate on the CT excitation which is a simpler problem because, as we discussed in section III A, on each rung we are dealing with one electron on two coupled tight-binding orbitals and . Therefore, only one energy term has to be considered in the previous equation. We can then write:
| (31) | |||
| (32) | |||
| (33) | |||
| (34) |
where we took into account that the expectation value of over the ground state is a real number. From Eq. 29 and 34, we obtain:
| (35) |
where we have introduced the correlation function:
| (36) |
For the ground state of N independent rungs per unit volume , we calculate . Because , it follows that . Therefore, if the two sites on a rung are completely independent: and , for =0 and . On the other hand, has its maximum value when the rungs form homo-polar molecules: , for and . Noticing that one can see that Eq. 35 and Eq. 16 correspond exactly to the same result.
In performing a similar quantitative analysis for the spin-flip excitations in the single two-leg ladder, we have to consider the elementary excitations of the 1D S=1/2 HB AF, system which does not have long range magnetic order at any temperature due to its 1D character. It has been shown by Faddeev and Takhtajan[34] that the true elementary excitations of the 1D HB AF are doublets of S=1/2 spinon excitations. Each spinon is described by the dispersion relation:
| (37) |
The two-spinon continuum, with total spin S=1 or S=0, is defined by , where , and and are the momenta of the spinons. The lower boundary is found for and (or the other way around): . The upper one for : .
In the present case, we are dealing with double spin flips generated by the interaction Hamiltonian . What is then relevant is the four-spinon continuum defined by , where , and the index i labels the four spinons. Of this excitation spectrum we would actually probe in an optical experiment only the (or equivalently ) states, with total spin S=0. These states form a continuum at extending from to . In fact, because Eq. 37 has its maximum for , four spinons with the same correspond to the () excited state with the highest possible energy: .
If we now go back to Eq. 30, we see that the evaluation of the integrated optical conductivity for the spin excitations is problematic because it requires a detailed analysis of the matrix elements for the states within the four-spinon continuum, at . We can simplify the problem by means of a very crude approximation and obtain a result which, although not rigorous, yet is meaningful for a comparison with the experiment. Let us replace in Eq. 30 the quantity () with the average energy value of the four spinon continuum: . In this way, as in the case of the CT excitations, we can write:
| (38) |
where is the spin-correlation function defined as:
| (39) |
One has to note that a non zero value of requires that the total Hamiltonian and the interaction Hamiltonian do not commute with each other. This condition would be realized including, in or in , nnn interaction terms which would, unfortunately, complicate the problem considerably. However, a finite value of is obtained also in case of an AF broken symmetry of the ground state. We can then estimate an upper limit for starting from a long range Néel ordered state, i.e. . Over this ground state we can calculate . On the other hand, for a random orientation of spins we would obtain . The real spin configuration of the system is of course something in between these two extreme cases and the value of depends on the details of the many-body wave function of the spins. In particular, it depends on the probability of having fragments of three neighboring spins ordered antiferromagnetically. Therefore, is higher the lower is the temperature and reaches for its maximum value, which would be strictly smaller than in a truly 1D system. In relation to the interpretation of the optical conductivity data of -NaV2O5 within the charged magnon model, it is important to note that, in a dimerized singlet (or triplet) configuration of the single two-leg ladder, we have .
In conclusion, the intensity of the spin fluctuations relative to the CT excitations in terms of effective charges, for the single two-leg ladder system, is given by:
| (40) |
On the basis of the analysis presented above, we can state that the maximum limiting value for this quantity, in the limit and with given by Eq. 25, is:
| (41) |
IV Optical Spectroscopy
We investigated the optical properties of -NaV2O5 in the frequency range going from 30 to 32 000 cm-1. High-quality single crystals were grown by high temperature solution growth from a vanadate mixture flux.[35] The crystals, with dimensions of 1, 3, and 0.3 mm along the a, b, and c axes, respectively, were aligned by conventional Laue diffraction, and mounted in a liquid He flow cryostat to study the temperature dependence of the optical properties between 4 and 300 K. Reflectivity measurements, in near normal incidence configuration (), were performed on two different Fourier transform spectrometers: A Bruker IFS 113v, in the frequency range going 20 - 7000 cm-1, and a Bomem DA3, between 6000 and 32 000 cm-1. Polarized light was used, in order to probe the optical response of the crystals along the a and b axes. The absolute reflectivity was obtained by calibrating the data acquired on the samples against a gold mirror, from low frequencies up to 15 000 cm-1, and an aluminum mirror for higher frequencies. The optical conductivity was calculated from the reflectivity data using Kramers-Kronig relations.
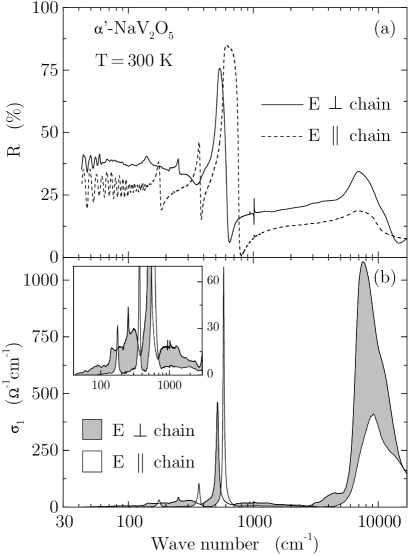
Let us now, as an introduction to what we will discuss in detail in the following sections, describe briefly the main features of the optical spectra of -NaV2O5, over the entire frequency range we covered with our experimental systems. In Fig. 5 we present reflectivity and conductivity data of -NaV2O5 at 300 K for (i.e., to the chain direction) and (i.e., the chain direction), in the frequency range going from 30 to 17 000 cm-1. We can observe a very rich and peculiar excitation spectrum, characterized by strong anisotropy for direction parallel and perpendicular to the V-O chains.
For chain, the far-infrared region ( 800 cm-1) is characterized by strong optical phonon modes, with no background conductivity, as expected for an ionic insulator. At higher frequencies a strong electronic absorption (peaking at cm-1) is directly observable in both reflectivity and conductivity. Moreover, in the mid-infrared region (between 800 and 5000 cm-1) we detected a very weak continuum of excitations, as shown by the finite value of the conductivity (see inset of Fig. 5b) and by the reflectivity which is continuously raising in that frequency range (Fig. 5a).
On the other hand, for chain, a weak broad band of optical absorption, additional to the phonon modes, was detected in the far-infrared region. This is directly recognizable in the reflectivity spectrum (Fig. 5a): Reducing the frequency of the incoming light, contrary to what observed for chain, we can observe an overall increase in reflectivity which masks the contribution due to the sharp phonon lines. At the same time, the interference fringes, due to Fabry-Perot resonances, which were dominating the optical reflectivity below 140 cm-1 for chain, are almost completely suppressed for chain, indicating a stronger absorption for the latter polarization. In the optical conductivity, a continuum, with a broad maximum in the far infrared (see inset of Fig. 5b), extends from very low frequencies up to the electronic excitation at cm-1 eV, which is now much more intense than the similar one detected for chain. Moreover, along the direction perpendicular to the V-O chains, we can observe an additional shoulder in the conductivity spectrum, between 3000 and 5000 cm-1.
Finally, for both polarizations, an absorption edge due to the onset of charge-transfer transitions was detected at 3 eV (not shown), in agreement with Ref. [36].
A Phonon Spectrum: High Temperature Phase
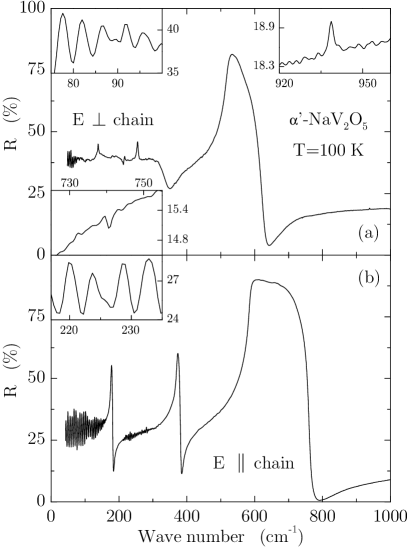
We will now concentrate on the phonon spectra of the high temperature undistorted phase of -NaV2O5. We will try to assess the symmetry issue by comparing the number and the symmetry of the experimentally observed optical vibrations to the results obtained from the group theoretical analysis for the two different space groups proposed, for -NaV2O5, in the undistorted phase. In Fig. 6 we present the reflectivity data for E perpendicular and parallel to the V-O chains (i.e., along the a and b axes, respectively), up to 1000 cm-1, which covers the full phonon spectrum for these two crystal axes. In this respect, different is the case of the c axis: Along this direction a phonon mode was detected at 1000 cm-1, as we will show in section IV C while discussing the results reported in Fig. 11. In Fig. 6 the data are shown for K, temperature which is low enough for the phonons to be sufficiently sharp and therefore more easily detectable. At the same time, it is far from , so that we can identify the phonon spectrum of the undistorted phase without having any contribution from the one of the low temperature distorted phase.
In Fig. 6 three pronounced phonon modes are observable for chain ( 177, 371, and 586 cm-1, at 100 K), and three for chain ( 137, 256, and 518 cm-1, at 100 K). It has to be mentioned that the feature at 213 cm-1 along the a axis, which looks like an antiresonance, is a leakage of a c-axis mode[37] due to the finite angle of incidence of the radiation on the sample (), and to the use of p-polarization (therefore with a finite component) to probe the a-axis optical response. Analyzing in detail the spectra few more lines are observable, as shown in the insets of Fig. 6. Along the b axis a fourth phonon is present at 225 cm-1: Being the sample a 300 m thick platelet characterized by some transparency in this frequency region, Fabry-Perot interferences with a sinusoidal pattern are measurable. At 225 cm-1 the pattern is not regular anymore, indicating the presence of an absorption process. From the temperature dependence, it can be assigned to a lattice vibration. Similarly, three more phonons are detected along the a axis at 90, 740 and 938 cm-1.
| Pol. | T (K) | (cm-1) | |||||
|---|---|---|---|---|---|---|---|
| 4 | 91.12 | 139.15 | 255.49 | 517.30 | 740.62 | 938.21 | |
| 100 | 89.67 | 136.81 | 255.82 | 517.74 | 740.49 | 938.49 | |
| 4 | 177.46 | 224.67 | 373.91 | 587.20 | |||
| 100 | 177.18 | 225.20 | 371.02 | 585.88 | |||
In conclusion, 6 a-axis and 4 b-axis phonons were detected on -NaV2O5, in the high temperature undistorted phase. The resonant frequencies of these vibrational modes are summarized, for two different temperatures, in table I. These results compare better with the group theoretical analysis for the centrosymmetric space group Pmmn (see Eq. 5), which gave 7 and 4 vibrational modes for and , respectively, than with the analysis for the noncentrosymmetric . In fact, in the latter case 15 and 7 phonons ought to be expected (see Eq. 8). Therefore, in agreement with the x-ray structure redetermination,[11, 12, 13] also the optical investigation of the phonon spectra indicates the centrosymmetric space group Pmmn as the most probable one for -NaV2O5, at temperatures above .
However, is in principle not completely ruled out as a possible space group on the basis of the optical phonon spectra. In fact, group theory gives information only about the number of phonons that one could expect but not about their resonant frequencies and, in particular, their effective strength which, in the end, determines whether a mode is detectable or not. The only really conclusive answer would have been to detect more modes than allowed by symmetry for the space group Pmmn. In the present situation, it may be possible that the correct space group is still the non-centrosymmetric and that some of the phonons have escaped detection because the frequency is too low for our setup or due to a vanishing oscillator strength. In this respect, we have to stress that, indeed, the oscillator strength of the additional modes expected for the noncentrosymmetric would have to be small because, as indicated from the x-ray diffraction analysis,[11] if a deviation from centrosymmetry is present, it is smaller than 0.03 Å. We have also been performing a lattice dynamical calculation for both space groups which shows that, removing the center of inversion and changing the valence of the V ions (i.e., from the uniform V4.5+ for all sites to an equal number of V4+ and V5+ sites), the number of modes characterized by a finite value of the oscillator strength does not increase, even if a strictly long range charge ordering in 1D chains of V4+ and of V5+ ions is assumed.
It has to be mentioned that many independent investigations of the Raman and infrared phonon spectra, on -NaV2O5, were reported.[14, 36, 37, 38, 39, 40, 41, 42, 43, 44] Of course, there was not immediately a perfect agreement between all the different data. As a matter of fact, in the first experimental studies of lattice vibrations,[36, 38] the optical spectra there presented were interpreted as an evidence for the noncentrosymmetric space group . At this stage, we believe that the results of our investigation performed on high quality single crystals, give a very complete picture of the infrared vibrational modes of -NaV2O5, in the undistorted phase, for and . Moreover, our results are completely confirmed by those recently obtained by Smirnov et al.[37, 39] (who could measure also the c-axis phonon spectrum), on samples of different origin.
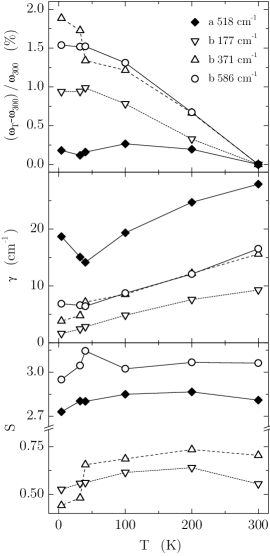
Before moving on to the phonon spectra characteristic of the low temperature distorted phase of -NaV2O5, we would like to discuss the temperature dependence, from 4 to 300 K, of the lattice vibrations which are already present in the uniform phase. In order to extract, from the experimental data, information about their parameters, we had to fit the data using Fano line shapes for the phonon peaks.[45] In fact, most of them, in particular along the a axis, are characterized by a strong asymmetry indicating an interaction with the underlaying low frequency continuum. In this case the symmetrical Lorentz line shape was not suitable and the asymmetrical Fano profile had to be used: The latter model contains an additional parameter which takes care of the degree of asymmetry of an excitation line, due to the coupling between that discrete state and an underlaying continuum of states.
| Pol. (LT) | (cm-1) | ||||||||||
| 101 | 127 | 147 | 199 | — | 362 | 374 | 410 | 450 | 717 | 960 | |
| 102 | 128 | — | — | 234 | 362 | — | 410 | — | 718 | 960 | |
The results for the percentage change in resonant frequency, the damping, and the oscillator strength of the most intense optical phonons of the undistorted phase of -NaV2O5, are plotted in Fig. 7, between 4 and 300 K. One can observe that some of the modes show a sudden change in their parameters between 40 and 32 K, i.e., upon reducing the temperature below K. In particular, the oscillator strength of the phonons at 371 and 586 cm-1, along the b axis, decreases across the phase transition, suggesting either a transfer of spectral weight to zone boundary folded modes activated by the phase transition or to electronic degrees of freedom. We will see later, in the course of the paper, that for the chain direction the reduction of the phonon oscillator strength will be compensated mainly by the strength gained by the zone boundary folded modes activated by the phase transition. On the other hand, for chain, the change in spectral weight of the electronic excitations will appear to be particularly important.
B Phonon Spectrum: Low Temperature Phase
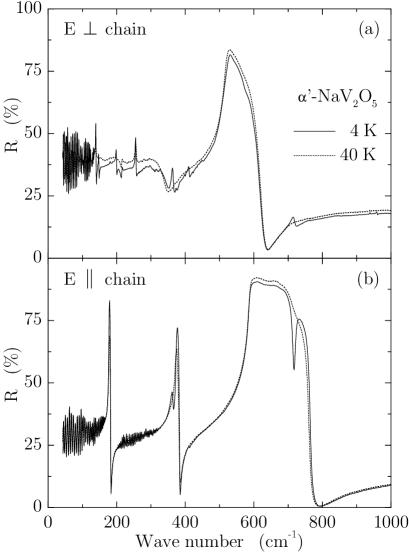
Upon cooling the sample below =34 K, significant changes occur in the optical phonon spectra as one can see in Fig. 8, where we present the reflectivity spectra of -NaV2O5 measured, for chain (a) and chain (b), below (4 K) and just above (40 K) the phase transition. Contrary to the case of CuGeO3, where we could clearly observe in reflectivity only a single, very weak additional phonon,[47, 48, 49] 10 new lines are detected for chain ( 101, 127, 147, 199, 362, 374, 410, 450, 717, and 960 cm-1), and 7 for chain ( 102, 128, 234, 362, 410, 718, and 960 cm-1), some of them showing a quite large oscillator strength. The stronger intensity of the lines, with respect to the case of CuGeO3, suggests larger lattice distortions in -NaV2O5, on going through the phase transition or, alternatively, a larger electronic polarizability. The resonant frequencies (at K) of all the detected zone boundary folded modes are summarized in table II. The observation of many identical or almost identical frequencies for both axes, which is an important information for a full understanding of the structural distortion, is an intrinsic property of the low temperature phase. Experimental errors, like polarization leakage or sample misalignment, are excluded from the well-defined anisotropy of the phonon spectrum of the undistorted phase. A more detailed discussion of this point will be presented in section IV C, in relation to the reflectivity data reported in Fig. 11.
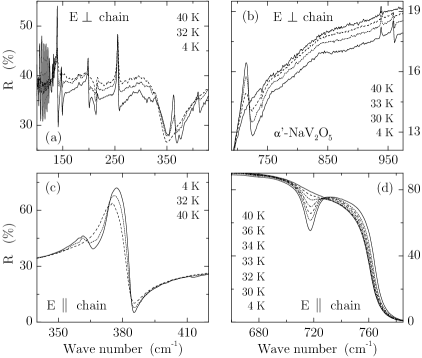
An enlarged view of few of the frequency regions where zone boundary folded modes were detected, is given in Fig. 9. We observe the gradual growing of the these modes, whose oscillator strength increases the more the temperature is reduced below =34 K. Moreover, the reflectivity data acquired for chain [panel (a) in Fig. 8 and panels (a) and (b) in Fig. 9] show that also the underlaying continuum has a considerable temperature dependence: The reflectivity is decreasing, over the entire frequency range, upon reducing the temperature from 40 to 4 K. In particular, in Fig. 9a, we see that very pronounced interference fringes, due to Fabry-Perot resonances, are present at 4 K for cm-1, indicating a particularly strong reduction of the absorption in that frequency region. This effect is, in our opinion, related to the opening of the magnetic gap in the excitation spectrum, and will be discussed in detail in section IV D.
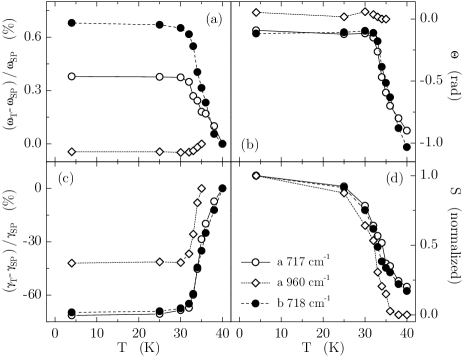
Of all the detected folded modes, for experimental reasons (i.e., higher sensitivity of the detector and therefore higher accuracy of the results in this frequency range), we carefully investigated the ones at 718 () and 960 cm-1 (), for several temperatures between 4 and 40 K. We fitted these phonons to a Fano profile because the 718 cm-1 modes show an asymmetrical line-shape. The results of the percentage change in resonant frequency and damping, of the normalized oscillator strength, and of the Fano asymmetry parameter are plotted versus temperature in Fig. 10. We use here an asymmetry parameter (rad) defined in such a way that the larger the value of , the stronger is the asymmetry of the line: A Lorentz line-shape is recovered for =0.[50]
Let us now start by commenting on the results obtained for the oscillator strength: In Fig. 10d we see that S has a similar behavior for the three different lines. However, the 960 cm-1 peak vanishes at whereas the two 718 cm-1 modes have still a finite intensity at =40 K and, as a matter of fact, disappear only for 60 -70 K. At the same time, the line-shape of the 960 cm-1 mode is perfectly lorentzian at all temperatures, whereas the two other phonons show a consistently increasing asymmetry for K. Also the increase in resonant frequency (Fig. 10a) and the reduction of the damping (Fig. 10c) are much more pronounced for the two 718 cm-1 modes. From these results we conclude that the second-order character of the phase transition is nicely shown by the behavior of S for the 960 cm-1 folded mode. On the other hand, pretransitional fluctuations manifest themselves in the finite intensity of the 718 cm-1 modes above , and in the extremely large value of and for these lines ( cm-1 at 40 K). In other words, the lattice distortion is already taking place in the system, at temperature much higher than , but with a short range character, whereas a coherent long range distortion is realized only below the phase transition temperature. In this respect, it is worth mentioning that similar pretransitional fluctuations, below 70 K, have been observed also in the course of a study of the propagation of ultrasonic waves along the chain direction of -NaV2O5,[51] and, very recently, in x-ray diffuse scattering measurements.[52]
C Symmetry of the Lattice Distortion
We saw in the previous section that many of the folded zone boundary phonons, activated by the phase transition, show the same resonant frequency for and (see table II), even though they are characterized by a different oscillator strength along the two different axes (e.g., for and for , for the 718 cm-1 modes at 4 K). This is quite a surprising result because the phonon spectrum of the undistorted phase has a well defined anisotropy, at any temperature, with different resonant frequencies for vibrations polarized along the a and b axes (see table I). Similar anisotropy should then be present below the phase transition if the system is still orthorhombic, even for the folded modes.
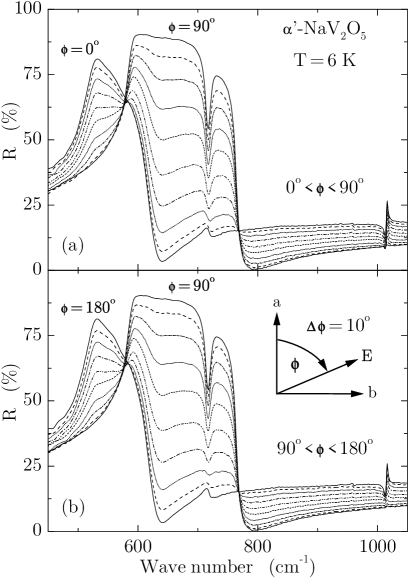
To further check these findings, we performed reflectivity measurements on a single crystal of -NaV2O5, at the fixed temperature of 6 K, rotating the polarization of the incident light of an angle (see Fig. 11). The sample was aligned in such a way to have the electric field of the light parallel to the a axis of the crystal, for and , and parallel to the b axis, for . For these polarizations of the light the obtained results are, obviously, identical to those presented in Fig. 8. However in Fig. 11 the data are shown in a different frequency range, extending up to 1050 cm-1. We can then observe at cm-1 along the a axis, which again was probed with p-polarized light, the antiresonance due to the leakage of a c-axis phonon.[37] Starting from and turning the polarization in steps , we observe a gradual decrease of the a axis contribution and, at the same time, an increase of the b axis contribution to the total reflectivity. Moreover, the set of curves plotted in Fig. 11 satisfy the following relations:
| (42) |
| (43) |
This suggests that the system, even in the distorted phase, has the optical axes along the crystal directions a, b, and c (on the contrary, for a triclinic or a monoclinic structure there would be no natural choice of the optical axes and Eq. 43 would not be satisfied). However, the low temperature folded mode at 718 cm-1 can be observed for all possible orientations of the electric field of the incident radiation (see Fig. 11). Because identical resonance frequencies, along the a and the b axes of the crystal, were observed for six of the folded zone boundary modes, we cannot believe in an accidental coincidence.
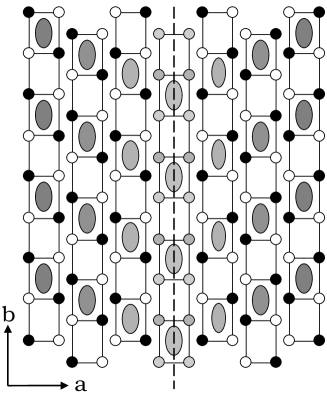
A possible explanation for the observed effect is as follows. In the low temperature phase a non-magnetic ground state is realized, and true singlets are present in -NaV2O5. The most probable situation is that the singlets are formed, within the ladders, over the plaquettes defined by four V ions. In this case, as shown in Fig. 12, within one ladder there is an alternation of ‘empty’ plaquettes and plaquettes containing a singlet (represented by a grey ellipsoid in Fig. 12). Let us now assume that in adjacent ladders the charge is arranged in an oblique charge ordering pattern (OCOP), as shown in the left-hand side of Fig. 12. The OCOP is consistent with the doubling of the lattice constant observed, along the a axis, in low temperature x-ray scattering experiments.[3] Moreover, two different kinds of V ions are identifiable which could possibly explain the results obtained in low temperature NMR experiments[16] (for a more detailed discussion see section V). In fact, there are V ions adjacent to empty plaquettes (white circles) and V ions adjacent to plaquettes containing a singlet (black circles), arranged in zig-zag patterns on each ladder. Note that in our picture the non-equivalence of plaquettes along the -axis, indicated by the gray ellipsoids in Fig. 12, is really a chicken-and-egg problem: Either the singlet formation occurs first, causing an alternation along of non-equivalent plaquettes, which, in combination with the OCOP along gives rise to a zig-zag charge ordering. Alternatively, the zig-zag charge order occurs first, which, in combination with OCOP causes the alternation of non-equivalent plaquettes along . The resulting charge modulations are only small deviations from average occupation, which we represented graphically by the different grey shades.
At this stage, the low temperature phonon spectra should still be characterized by a well defined anisotropy, with distinct eigenfrequencies for different polarizations of the electric field of the incoming radiation. However, there is no reason for the polarization of the folded zone boundary modes to be precisely along the a or the b axes. In fact, they are polarized with a finite angle with respect to the crystal axes (e.g., along directions parallel and perpendicular to the diagonal long-range singlet-pattern). If domains are present in the system, with opposite orientation for the OCOP (left and right hand sides of Fig. 12), each domain will still be characterized by a phonon spectrum with a well defined polarization, as just discussed. However, in presence of such domains the phonon spectra measured in the experiments correspond to an average over many domains with the two possible orientations randomly distributed. As a result, almost no anisotropy would be found for light polarized along a and b axes.
A short wavelength alternation of descending and ascending OCOP domains (also a supercell) corresponds closely to the structure recently reported by Lüdecke et al.[46] A similar structure was also considered by Riera and Poilblanc as one of the many possible realizations of charge density wave in this system.[20]
D Optical Conductivity
Very interesting information and a deeper understanding of the symmetry of -NaV2O5 are obtained from the detailed analysis of the optical conductivity data, in particular when the electronic excitations are considered and compared to the result relative to CuGeO3 (see Fig. 13). On the latter compound we observed sharp phonon lines below 1000 cm-1,[47, 48, 49] multiphonon absorption at 1500 cm-1, very weak [note the low values of in the inset of Fig. 13a] phonon-assisted Cu d-d transitions at 14 000 cm-1,[53] and the onset of the Cu-O charge-transfer (CT) excitations at cm-1. On -NaV2O5, besides the phonon lines in the far-infrared region, we detected features that are completely absent in CuGeO3: A strong absorption peak at 8000 cm-1 and, in particular for chain, a low-frequency continuum of excitations (see inset of Fig. 13b). Our goal is to interpret the complete excitation spectrum for -NaV2O5, trying, in this way, to learn more about the system on a microscopic level. In order to do that, we have first to identify possible candidates for the excitation processes observed in the experimental data.
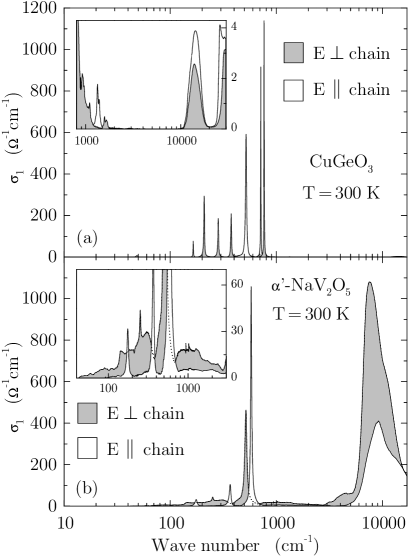
On the basis of intensity considerations, the peak at 8000 cm-1 1 eV, in the optical conductivity of -NaV2O5, has to be ascribed to an optically allowed excitation. Contrary to the case of the absorption detected at 14 000 cm-1 on CuGeO3, it cannot be interpreted just as a d-d exciton on the transition metal ion (i.e., V in the case of -NaV2O5). In fact, this kind of transition is in principle optically forbidden and only weakly allowed in the presence of a strong parity-broken crystal field or electron-phonon coupling. We have now to recall one of the main consequences of the structural analysis which suggested as a most probable space group, for -NaV2O5 in the undistorted phase, the centrosymmetric Pmmn: The existence of only one kind of V per unit cell, with an average valence of +4.5. Taking into account that the hopping parameter along the rungs , is approximately a factor of two larger than the one along the legs of the ladder ,[54, 55] all the other hopping amplitudes being much smaller (including the nn ), -NaV2O5 can be regarded as a 1/4-filled two-leg ladder system, with one V d-electron per rung shared by two V ions in a molecular bonding orbital.[13] In this context, the most obvious candidate for the strong optical absorption observed at 1 eV is the on-rung bonding-antibonding transition, with a characteristic energy given by . However, on the basis of LMTO band structure calculation[54] and exact diagonalization calculation applied to finite size clusters,[55] was estimated to be 0.30-0.35 eV, which gives a value for the bonding-antibonding transition lower than the experimentally observed 1 eV. This energy mismatch, and the strong dependence of the intensity of the 1 eV peak on the polarization of the light, are important pieces of information and will be discussed further in section IV E.
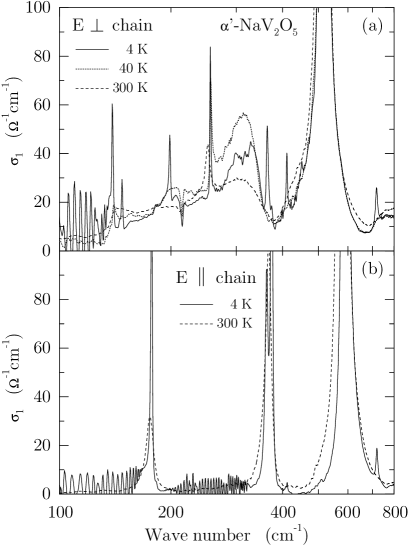
Let us now turn to the infrared continuum detected for chain (see inset of Fig. 13b). We already showed , discussing the low temperature reflectivity data (see Fig. 8 and 9), that this broad band of optical absorption has a considerable temperature dependence: The overall reflectivity was decreasing upon reducing the temperature and, for , Fabry-Perot resonances appear at frequencies lower than 136 cm-1, indicating a particularly strong reduction of the optical absorption in that frequency region. These effects become even more evident when we consider the low temperature optical conductivity calculated from the reflectivity data via Kramers-Kronig transformations (see Fig. 14). However, we have to keep in mind that performing this kind of calculation, we will obtain unphysical oscillations for the optical conductivity in the frequency regions where reflectivity is dominated by interference fringes.
In Fig. 14b we can observe, for chain, only the sharpening of the phonon lines and the appearance of the zone boundary folded modes. On the other hand, for chain we can observe, in addition to the folded modes below , first the increase of the continuum intensity upon cooling the sample from 300 to 40 K and, subsequently, a reduction of it from 40 to 4 K. In the frequency region below the 139 cm-1 phonon, whereas a reduction is observable in going from 300 to 40 K, not much can be said about the absolute conductivity of the 4 K data, because of the interference fringes.
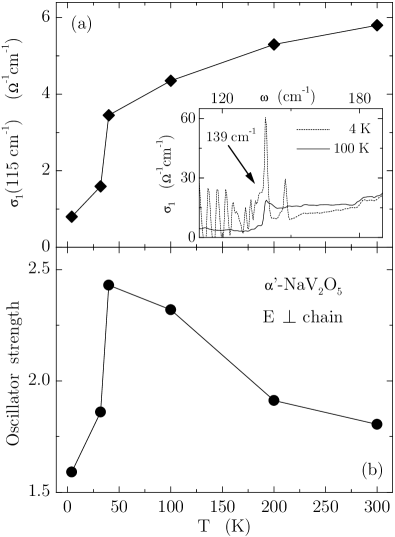
In order to evaluate the low temperature values of conductivity more precisely, we can fit the interference fringes directly in reflectivity. In fact, fitting the period and the amplitude of them, we have enough parameters to calculate right away the real and imaginary part of the index of refraction and, eventually, the dynamical conductivity . The so obtained values are plotted versus the temperature in Fig. 15a. The data for 100, 200, and 300 K were obtained via Kramers-Kronig transformations, whereas those for 4 and 32 K from the fitting of the interferences in the range 105 -125 cm-1. The 40 K point, as at that temperature very shallow fringes start to be observable, was calculated with both methods, which show a rather good agreement in this case. As a results we can observe (see Fig. 15a) a pronounced reduction of , across the phase transition, corresponding to the opening of a gap in the optical conductivity.
It is difficult to evaluate precisely the gap size because of the phonon at 139 cm-1 (inset of Fig. 15a). However, we can estimate a lower limit for the gap of cm-1 (173 meV). The important information is that the value of the gap in the optical conductivity is approximately twice the spin gap value observed in inelastic neutron scattering experiments[3] and magnetic susceptibility measurements,[56] for T 34 K. This finding indicates that the infrared broad band of optical absorption has to be related to electronic degrees of freedom: Because the range of frequency coincides with the low-energy-scale spin excitations, the most likely candidates for this continuum are excitations involving two spin flips.
In relation to what we just discussed, it is interesting to note the effect of the opening of a gap, in the optical conductivity, on the phonon located at 139 cm-1. This can be clearly identified in the inset of Fig. 15a, where an enlarged view of at low frequency is given, for 100 and 4 K. At 100 K this mode is characterized by a very pronounced anomaly of its line shape. As a matter of fact, fitting this phonon with a Fano line shape we obtained for the asymmetry parameter the value rad, indicating a strong coupling to the continuum. However at 4 K, once the gap is open and the intensity of the underlying continuum has decreased, a sharp and rather symmetrical line shape is recovered.
An additional information we can extract from the conductivity spectra is the value of the integrated intensity, and its temperature dependence, for the infrared broad band of optical absorption detected for chain. The oscillator strength, obtained by integrating (with phonons subtracted) up to 800 cm-1, is displayed in Fig. 15b. It increases upon cooling down the sample from room temperature to , and rapidly decreases for . The possible meaning of this behavior will be further discussed in the next section.
As a last remark, it is important to mention that low temperature measurements of the dielectric constant, in the microwave frequency range, were recently performed on -NaV2O5 by different groups.[57, 58] The reported results show no anomaly, across the phase transition, for the real part of the dielectric constant along the b axis. On the other hand, along the a axis, a pronounced decrease below was found. The observed behavior, as a matter of fact, is in very good agreement with the temperature dependence of the oscillator strength of the low frequency continuum present, in the optical spectra, along the a axis (Fig. 15b). This comparison is meaningful because the contribution of all possible optical excitations to the static dielectric constant is just given by their oscillator strengths. The very good agreement of the different results proves, as already suggested by the authors of Ref. [57] and [58], that the change in the very low frequency dielectric constant is related to electronic (magnetic) degrees of freedom.
E Charged Bi-Magnons
In the previous section we identified possible candidates for the 1 eV excitation (on-rung bonding-antibonding transition), and for the low frequency continuum detected on -NaV2O5 for chain (double spin flips). However, we also stressed that, for a symmetrical 1/4 -filled two leg ladder system, the bonding-antibonding transition would be at eV and not at the experimentally observed value of 1 eV. Moreover, also intensity and polarization ( chain) of the continuum cannot be understood assuming the complete equivalence of the V sites required by the space group Pmmn. In fact, because of the high symmetry, no dipole moment perpendicular to the V-O chains would be associated with a double spin flip process. Therefore, no optical activity involving magnetic degrees of freedom would be detectable. Not even phonon-assisted spin excitations considered by Lorenzana and Sawatzky[27, 28, 30] (where the involved phonon is effectively lowering the symmetry of the system) could be a possible explanation for the observed spectra: The energy is too low for this kind of processes which, on the other hand, are probably responsible for the weak mid-infrared continuum in the chain spectra (see Fig. 13b and, in particular, its inset).
A possible solution is to assume a charge disproportionation on each rung of the ladders without, however, any particular long range charge ordering (see Fig. 16). The latter is, in fact, most probably excluded by the x-ray diffraction results and by the phonon spectra of the undistorted phase. It is worth mentioning that the assumption of charge disproportionation has been confirmed by calculations of the optical conductivity by exact-diagonalization technique on finite size clusters.[59] Only in this way it was possible to reproduce the energy position of the 1 eV peak, and the anisotropy between a and b axes (see Fig. 13). We can now try to interpret the optical data on -NaV2O5 in the framework of the charged-magnon model developed in section III.
Let us start from the analysis of the absorption band at 1 eV. We can model the j th rung, formed by two V ions, with the Hamiltonian , as in Eq. 11 and 12, where the potential energy difference between the two sites has the role of a charge disproportionation parameter: For the symmetric ladder . The splitting between the two bonding and antibonding eigenstates and , given by , corresponds to the photon energy of the optical absorption. We see that, if , the experimental value of 1 eV can be reproduced.
A second crucial piece of information is provided by the intensity of the absorption. We can calculate the integrated intensity of the 1 eV peak, in the conductivity data, and then take advantage of its functional expression derived in section III (Eq. 16). This way we obtain from the spectra eV, value which is in very good agreement with those obtained from LMTO band structure calculation,[54] and exact diagonalization calculation applied to finite size clusters.[55] Combining this number with eV, we obtain eV. The corresponding two eigenstates have 90% and 10% character on either side of the rung. Therefore, the valence of the two V-ions is 4.1 and 4.9, respectively, and the optical transition at 1 eV is essentially a charge transfer (CT) excitation from the occupied V 3d state at one side of the rung to the empty 3d state at the opposite side of the same rung.
Let us now turn to the infrared continuum detected for chain. The presence of two V states ( and ) per spin, along with the broken left-right parity of the ground state on each rung, gives rise to the fascinating behavior of the spin flips described in detail in section III for the 1/4 filled single two-leg ladder, and in a pictorial way for -NaV2O5, in Fig. 16: If in a small fragment of the ladder each spin resides in a orbital, with some admixture of , the inclusion of the coupling between the rungs, via the Hamiltonian (Eq. 13), has no effect when the spins are parallel, due to the Pauli-principle. If the spins form an state, the ground state gains some kinetic energy along the legs by mixing in states where two electrons reside on the same rung. In the limit , these states have one electron in the and one in the state on the same rung. As a result, there is a net dipole displacement of the singlet state compared to the triplet state: The spin-flip excitations carry a finite electric dipole moment along the rung direction.
From the expression for the exchange coupling constant calculated in the limit (Eq. 25), and using the values of and calculated from the optical data and eV,[60] we obtain meV. It is significant that this value is comparable to those reported on the basis of magnetic susceptibility measurements, which range from 38 to 48 meV (see Ref. [56] and [2], respectively). Moreover, for the effective charge of the bi-magnon excitation process (Eq. 28), we obtain .
We can also compare the experimental intensity of the spin-fluctuations relative to the CT excitations to the maximum limiting value calculated for this quantity (Eq. 41). For the parameters obtained from the conductivity spectra, the maximum relative intensity is 0.0014. The experimental value is 0.0008, at T=300 K, in good agreement with the numerical estimate.
We can now try to interpret the temperature dependence of the spin-fluctuation continuum shown in Fig. 15b: The oscillator strength increases upon cooling the sample from room temperature to , and rapidly decreases for . Within the charged-magnon model, the increase marks an increase in short range AF correlations of the chains: In fact, the intensity of the spin-fluctuations is proportional to the spin-spin correlation function defined in Eq. 39. Below , nn spin-singlet correlations become dominant, and is suppressed, along with the intensity of the spin-fluctuations.
In conclusion, by a detailed analysis of the optical conductivity, we provided a direct evidence for a local breaking of symmetry in the electronic charge distribution over the rungs of the ladders in -NaV2O5, in the high temperature undistorted phase. Moreover, we showed that a direct two-magnon optical absorption process is responsible for the low frequency continuum observed perpendicularly to the V-O chains.
V Discussion
As we discussed in the course of this paper, the interpretation of the phase transition in -NaV2O5 is still controversial. On the one hand, the SP picture was suggested by preliminary magnetic susceptibility[2] and inelastic neutron scattering measurements.[3] On the other, x-ray diffraction redeterminations of the crystal structure of the compound, in the high temperature undistorted phase,[11, 12, 13] showed that the dimerization within well defined 1D magnetic chains is not very probable in -NaV2O5. Moreover, the magnetic field dependence of , expected for a true SP system on the basis of Cross and Fisher theory,[9, 10] has not been observed.[7, 8]
Additional information came recently from NMR experiments:[16] Above , only one kind of V site (magnetic) was clearly detected, whereas no signature of nonmagnetic V5+ was found. However, another set of magnetic V sites which are invisible in the NMR spectrum could not be ruled out.[16] On the other hand, below the phase transition, two inequivalent sets of V sites were detected and assigned to V4+ and V5+. These results were then interpreted as an indication of the charge ordering nature of the phase transition, in -NaV2O5.[16] Subsequently, many theoretical studies have been addressing this possibility.[17, 18, 19, 20] The main point to be explained is why a charge ordering would automatically result in the opening of a spin gap (with the same transition temperature). Among all the models, the more interesting seem to be those were a ‘zig-zag’ charge ordering on the ladders is realized. In this case, the ordering would immediately result in a nonmagnetic ground state, due to the formation of spin singlets on nn V sites belonging to two different ladders[17] or, alternatively, to the modulation of within a single ladder.[19]
In the discussion of our spectra of the optical conductivity, we showed that the infrared continuum, observed perpendicularly to the V-O chains direction, could be attributed to direct optical absorption of double spin-flip excitations. However, in order to have optical activity for these processes and, at the same time, to explain the energy position and the polarization dependence of the on-rung bonding-antibonding transition at 1 eV, we had to assume a charge disproportionation between the two V sites on a rung. This assumption seems to contrast the results of the x-ray diffraction analysis[11, 12, 13] and of NMR measurements.[16] As far as the former is concerned, it is obvious that if the charge disproportionation does not have a long range character it would not be detectable in an x-ray diffraction experiment, but would still result in optical activity of charged bi-magnon excitations. Regarding the disagreement with the NMR results,[16] we saw that the existence of another kind of V sites could not be completely excluded in the NMR spectrum.[16] Furthermore, in comparing the optical to the NMR data, there could also be a problem with the different time scales of the two experimental techniques (i.e., ‘fast’ and ‘slow’ for optics and NMR, respectively). Therefore, if there are charge fluctuations in the system, as one would expect for a charge ordering phase transition, the experimental results could be different.
From the analysis of the optical conductivity, we cannot really say which is the more appropriate picture for the phase transition in -NaV2O5. We saw that, indeed, the electronic and/or magnetic degrees of freedom are playing a leading role. This is shown, e.g., by the strong temperature dependence of the infrared spin fluctuation spectrum which, in turn, determines the anomalous behavior of the microwave dielectric constant.[57, 58] However, the reduction of the oscillator strength of the infrared continuum for , which we discussed as a consequence of nn spin-singlet correlations becoming dominant below , could also result from a zig-zag charge ordering on the ladders. In this case, as for the perfectly symmetrical 1/4 -filled ladder, the optical activity of double spin flips would simply vanish.
In our opinion, for a better understanding of the phase transition, the pretransitional fluctuations observed with optical spectroscopy, ultrasonic wave propagation,[51] and x-ray diffuse scattering,[52] have to be taken into account. They probably reflect the high degree of disorder present in the system above the phase transition, which is also shown by the local and ‘disordered’ charge disproportionation necessary to interpret the optical conductivity. In this context, a charge ordering transition, where more degrees of freedom than just those of the spins are involved, seems plausible. It would also explain the experimentally observed entropy reduction, which appeared to be larger than what expected for a 1D AF HB chain.[7]
Also the degeneracy of the zone boundary folded modes, activated by the phase transition, could be an important piece of information. However, at this stage of the investigation of the electronic and magnetic properties of -NaV2O5, very important insights could come from the x-ray diffraction determination of the low temperature structure. Probably, only at that point it will be possible to fit all the different results together and come up with the final interpretation of the phase transition.
VI Conclusions
In this paper we have been discussing the high and low temperature optical properties of -NaV2O5, in the energy range 4 meV-4 eV. We studied the symmetry of the material, in the high temperature undistorted phase, comparing the different crystal structures proposed on the basis of x-ray diffraction[4, 11, 12, 13] to our infrared phonon spectra. We found that the system is better described by the centrosymmetric space group Pmmn, in agreement with the recent structure redetermination.[11, 12, 13]
On the other hand, by a detailed analysis of the electronic excitations detected in the optical conductivity, we provided direct evidence for a charged disproportionated electronic ground-state, at least on a locale scale: A consistent interpretation of both structural and optical conductivity data requires an asymmetrical charge distribution on each rung, without any long range order. We showed that, because of the locally broken symmetry, spin-flip excitations carry a finite electric dipole moment, which is responsible for the detection of charged bi-magnons in the optical spectrum for chain, i.e., direct two-magnon optical absorption processes.
By analyzing the optically allowed phonons at various temperatures below and above the phase transition, we concluded that a second-order change to a larger unit cell takes place below 34 K, with a fluctuation regime extending over a very broad temperature range.
The charged-magnon model we have been discussing in this paper has been developed explicitly to interpret the peculiar optical conductivity spectra of -NaV2O5. However, our opinion is that the importance of this model goes beyond the understanding of the excitation spectrum of just this particular system. We expect this model (obviously in a more general and rigorous form), to be relevant to many of the strongly correlated electron systems, where the interplay of spin and charge plays a crucial role in determining the low energy electrodynamics.
At this point we would like to speculate that a specific case where charged magnon excitations could be observed is the stripe phase of copper oxides superconductors[61] and of other strongly correlated oxides.[62] In fact, even though the magnetism is quasi 2D in these systems, in the stripe phase a symmetry-breaking quasi 1D charge ordering takes place, which could result in optical activity for the charged magnons. For instance, in the optical conductivity spectra of La1.67Sr0.33NiO4 below the charge ordering transition,[63] it is possible to observe some residual conductivity inside the energy gap, whose nature has not been completely understood so far. Without further experimental and theoretical investigations it is of course not possible to make a strong claim. However, the reported features are suggestive of charged magnon excitations. In fact, for the value of obtained from the two-magnon Raman scattering on this material,[64] direct two-magnon optical absorption is expected in the same energy range (i.e., from zero to 0.2 eV) where the residual structure has been experimentally observed.[63]
Pushing the speculation to its limit, one could imagine that even the local breaking of symmetry introduced by a single impurity in an AF could result in optical activity for pure spin-flip excitations. One particular system where this situation is probably realized is Zn-substituted YBa2Cu3O6, where Zn is introduced in the CuO2 planes. In the cuprate parent compounds direct bi-magnon optical absorption is not allowed due to the inversion symmetry; only phonon-assisted magnetic excitations are optically active, whenever the involved phonon is lowering the symmetry of the system. In fact, phonon assisted bi-magnon excitations in the mid-infrared region were detected on both YBa2Cu3O6 and YBa2Cu2.85Zn0.15O6.[65] But on the Zn substituted system it is possible to observe, in the optical conductivity spectra, various features with frequencies coincident with those of pure double spin-flip excitations and, therefore, most probably ascribable to direct charged bi-magnon absorption processes.[65]
VII Acknowledgements
We gratefully acknowledge M. Mostovoy, D.I. Khomskii, T.T.M. Palstra, and G.A. Sawatzky for stimulating discussions. We thank D. Smirnov, J. Leotin, M. Grüninger, P.H.M. van Loosdrecht, and M.J. Rice for many useful comments, and C. Bos, A. Meetsma, and J.L. de Boer for assistance. One of us (A.D.) is greatful to M. Picchietto and B. Top for their unlimited co-operation. This investigation was supported by the Netherlands Foundation for Fundamental Research on Matter (FOM) with financial aid from the Nederlandse Organisatie voor Wetenschappelijk Onderzoek (NWO).
REFERENCES
- [1] Present address: Center for Materials Research, McCullough Building, Stanford University, 476 Lomita Mall, Stanford, CA 94305-4045. E-mail: damascel@stanford.edu
- [2] M. Isobe, and Y. Ueda, J. Phys. Soc. Jpn. 65, 1178 (1996).
- [3] Y. Fujii, H. Nakao, T. Yosihama, M. Nishi, K. Nakajima, K. Kakurai, M. Isobe, Y. Ueda, and H. Sawa, J. Phys. Soc. Jpn. 66, 326 (1997).
- [4] P.A. Carpy, and J. Galy, Acta Cryst. B 31, 1481 (1975).
- [5] M. Nishi, O. Fujita, and J. Akimitsu, Phys. Rev. B 50, 6508 (1994).
- [6] G.S. Uhrig, Phys. Rev. Lett. 79, 163 (1997).
- [7] B. Büchner, private communication.
- [8] W. Schnelle, Yu. Grin, and R.K. Kremer, Phys. Rev. B 59, 73 (1999).
- [9] M.C. Cross, and D.S. Fisher, Phys. Rev. B 19, 402 (1979).
- [10] M.C. Cross, Phys. Rev. B 20, 4606 (1979).
- [11] A. Meetsma, J.L. de Boer, A. Damascelli, J. Jegoudez, A. Revcolevschi, and T.T.M. Palstra, Acta Cryst. C 54, 1558 (1998).
- [12] H.G. von Schnering, Yu. Grin, M. Kaupp, M. Somer, R.K. Kremer, and O. Jepsen, Z. Kristallogr. 213, 246 (1998).
- [13] H. Smolinski, C. Gros, W. Weber, U. Peuchert, G. Roth, M. Weiden, and C. Geibel, Phys. Rev. Lett. 80, 5164 (1998).
- [14] A. Damascelli, D. van der Marel, M. Grüninger, C. Presura, T.T.M. Palstra, J. Jegoudez, and A. Revcolevschi, Phys. Rev. Lett. 81, 918 (1998).
- [15] A. Damascelli, D. van der Marel, J. Jegoudez, G. Dhalenne, and A. Revcolevschi, Physica B 259-261, 978 (1999).
- [16] T. Ohama, H. Yasuoka, M. Isobe, and Y. Ueda, Phys. Rev. B 59, 3299 (1999).
- [17] H. Seo, and H. Fukuyama, J. Phys. Soc. Jpn. 67, 2602 (1998).
- [18] P. Thalmeier, and P. Fulde, Europhys. Lett. 44, 242 (1998).
- [19] M. Mostovoy, and D. Khomskii, cond-mat/9806215 (18 June 1998).
- [20] J. Riera, and D. Poilblanc, Phys. Rev. B 4, 2667 (1999).
- [21] J.C. Bonner, and M.E. Fisher, Phys. Rev. A 135, 610 (1964).
- [22] F. Mila, P. Millet, and J. Bonvoisin, Phys. Rev. B 54, 11 925 (1996).
- [23] M. Isobe, and Y. Ueda, Physica B 262, 180 (1997).
- [24] J. Hemberger, M. Lohmann, M. Nicklas, A. Loidl, M. Klemm, G. Obermeier, and S. Horn, Europhys. Lett. 42, 661 (1998).
- [25] D.L. Rousseau, R.P. Bauman, and S.P.S. Porto, J. Raman Spectrosc. 10, 253 (1981).
- [26] J.D. Perkins, J.M. Graybeal, M.A. Kastner, R.J. Birgeneau, J.P. Falck, and M. Greven, Phys. Rev. Lett. 71, 1621 (1993).
- [27] J. Lorenzana, and G.A. Sawatzky, Phys. Rev. Lett. 74, 1867 (1995).
- [28] J. Lorenzana, and G.A. Sawatzky, Phys. Rev. B 52, 9576 (1995).
- [29] H. Suzuura, H. Yasuhara, A. Furusaki, N. Nagaosa, and Y. Tokura, Phys. Rev. Lett. 76, 2579 (1996).
- [30] J. Lorenzana, and R. Eder, Phys. Rev. B 55, R3358 (1997).
- [31] For a review, see M.A. Kastner, R.J. Birgeneau, G. Shirane, and Y. Endoh, Rev. Mod. Phys. 70, 897 (1998), and references therein.
- [32] J.M. Ziman, Principles of the Theory of Solids (Cambridge University Press, Cambridge, 1972).
- [33] M.J. Rice, Solid State Comm. 31, 93 (1979).
- [34] L.D.Faddeev, and L.A. Takhtajan, Phys. Lett. A 85, 744 (1981).
- [35] M. Isobe, C. Kagami, and Y. Ueda, J. Crystal Growth 181, 314 (1997).
- [36] A. Golubchik, M. Isobe, A.N. Ivlev, B.N. Mavrin, M.N. Popova, A.B. Sushkov, Y. Ueda, and A.N. Vasil’ev, J. Phys. Soc. Jpn. 66, 4042 (1997).
- [37] D. Smirnov, J. Leotin, P. Millet, J. Jegoudez, and A. Revcolevschi, Physica B 259-261, 992 (1999).
- [38] M.N. Popova, A.B. Sushkov, A.N. Vasil’ev, M. Isobe, and Y. Ueda, JETP Lett. 65, 743 (1997).
- [39] D. Smirnov, P. Millet, J. Leotin, D. Poilblanc, J. Riera, D. Augier, and P. Hansen, Phys. Rev. B 57, R11 035 (1998).
- [40] Z.V. Popovi, M.J. Konstantinovi, R. Gaji, V. Popov, Y.S. Raptis, A.N. Vasil’ev, M. Isobe, and Y Ueda, J. Phys. Condens. Matter 10, 513 (1998).
- [41] M. Fischer, P. Lemmens, G. Güntherodt, M. Weiden, R. Hauptmann, C. Geibel, and F. Steglich, Physica B 244, 76 (1998).
- [42] P. Lemmens, M. Fischer, G. Els, G. Güntherodt, A.S. Mishchenko, M. Weiden, R. Hauptmann, C. Geibel, and F. Steglich, Phys. Rev. B 58, 14 159 (1998).
- [43] H. Kuroe, H. Seto, J. Sasaki, T.Sekine, M. Isobe, and Y. Ueda, J. Phys. Soc. Jpn. 67, 2881 (1998).
- [44] M.N. Popova, A.B. Sushkov, S.A. Golubchik, B.N. Mavrin, V.N. Denisov, B.Z. Malkin, A.I. Iskhakova, M. Isobe, and Y. Ueda, cond-mat/9807369 (28 July 1998).
- [45] U. Fano, Phys. Rev. 124, 1866 (1961).
- [46] J. Lüdecke, A. Jobst, S. van Smaalen, E. Morr, C. Geibel, and H.-G. Krane, Phys. Rev. Lett. 82, 3633 (1999).
- [47] A. Damascelli, D. van der Marel, F. Parmigiani, G. Dhalenne, and A. Revcolevschi, Phys. Rev. B 56, R11 373 (1997).
- [48] A. Damascelli, D. van der Marel, F. Parmigiani, G. Dhalenne, and A. Revcolevschi, Physica B 244, 114 (1998).
- [49] A. Damascelli, D. van der Marel, G. Dhalenne, and A. Revcolevschi, submitted to Phys. Rev. B (1999).
- [50] A. Damascelli, K. Schulte, D. van der Marel, and A.A. Menowsky, Phys. Rev. B 55, R4863 (1997).
- [51] P. Fertey, M. Poirier, M. Castonguay, J. Jegoudez, and A. Revcolevschi, Phys. Rev. B 57, (1998).
- [52] S. Ravy, J. Jegoudez, and A. Revcolevschi, Phys. Rev. B 2, R681(1999).
- [53] M. Bassi, P. Camagni, R. Rolli, G. Samoggia, F. Parmigiani, G. Dhalenne, and A. Revcolevschi , Phys. Rev. B. 54, R (1996).
- [54] P. Horsch, and F. Mack, Eur. Phys. J. B 5, 367 (1998).
- [55] S. Nishimoto, and Y. Ohta, J. Phys. Soc. Jpn. 67, 2996 (1998).
- [56] M. Weiden, R. Hauptmann, C. Geibel, F. Steglich, M. Fischer, P. Lemmens, and G. Güntherodt, Z. Phys. B 103, 1 (1997).
- [57] Y. Sekine, N. Takeshita, N. Mri, M.Isobe, and Y.Ueda, preprint (1998).
- [58] A.I.Smirnov, M.N.Popova, A.B.Sushkov, S.A.Golubchik, D.I.Khomskii, M.V.Mostovoy, A.N.Vasil’ev, M.Isobe, and Y.Ueda, cond-mat/9808165 (27 October 1998).
- [59] S. Nishimoto, and Y. Ohta, J. Phys. Soc. Jpn. 67, 3679 (1998).
- [60] W.A. Harrison, Electronic Structure and the Properties of Solids (Dover Publications, New York, 1989).
- [61] J.M. Tranquada, B.J. Sternlieb, J.D. Axe, Y. Nakamura, and S. Uchida, Nature 375, 561 (1995).
- [62] C.H. Chen, S-W. Cheong, and A.S. Cooper, Phys. Rev. Lett. 71, 2461 (1993).
- [63] T. Katsufuji, T. Tanabe, T. Ishikawa, Y. Fukuda, T. Arima, and Y. Tokura, Phys. Rev. B 54, R (1996).
- [64] K. Yamamoto, T. Katsufuji, T. Tanabe, and Y. Tokura , Phys. Rev. Lett. 80, 1493 (1998).
- [65] M. Grüninger, D. van der Marel, A. Damascelli, A. Zibold, H.P. Geserich, A. Erb, M. Kläser, Th. Wolf, T. Nunner, and T. Kopp, Physica C, in press (1999).