[
First order phase transition in a 1+1-dimensional
nonequilibrium wetting process
Abstract
A model for nonequilibrium wetting in 1+1 dimensions is introduced. It comprises adsorption and desorption processes with a dynamics which generically does not obey detailed balance. Depending on the rates of the dynamical processes the wetting transition is either of first or second order. It is found that the wet (unbound) and the non-wet (pinned) states coexist and are both thermodynamically stable in a domain of the dynamical parameters which define the model. This is in contrast with equilibrium transitions where coexistence of thermodynamically stable states takes place only on the transition line.
pacs:
PACS numbers: 68.45.Gd; 05.40.+j; 05.70.Ln; 68.35.Fx]
Wetting phenomena are observed in a large variety of physical systems in which a planar substrate is exposed to a gas phase. The interactions between the substrate and the molecules of the gas phase lead to the formation of a liquid film close to the surface [1]. By changing the temperature or the partial pressure of the gas, such systems may exhibit a wetting transition from a phase where the thickness of the film stays finite to a phase where the film grows and eventually reaches a macroscopic size.
Much is known about equilibrium wetting transitions both theoretically and experimentally. Theoretically, they have been modeled by considering the binding process of a fluctuating interface to a substrate. By using transfer matrix formulation, it has been found that in 1+1 dimensions, when the interaction between the interface and the substrate is short range, the depinning transition is continuous [2]. However, when algebraically decaying long range interactions are taken, the transition could become first order [3]. On the other hand, in 2+1 dimensions the wetting transition is generally expected to be first order. However, disorder effects, such as those existing in porous media, could make the transition continuous [4].
When passing to non-equilibrium phenomena, most of the efforts have been made in the characterization of the wet phase, namely the description of the growth process far away from the substrate. Various models have been introduced to account for observed scaling behaviour in homogeneous as well as disordered environments [5].
Concerning the transition itself, a simple 1+1 dimensional model has recently been introduced where a continuous transition is observed in the absence of any binding force between the interface and the substrate [6]. It would be of interest to study the nature of the transition as the interaction between the interface and the substrate is varied.
Motivated by the knowledge of the behavior of equilibrium systems, we generalize the model introduced in Ref. [6] by adding an attractive binding force between substrate and surface layer. We find that even short range attractive interaction is capable of making the transition first order. In fact, for a suitable choice of the parameter values the model satisfies detailed balance and thus we can test our numerics against theoretical predictions in the context of equilibrium wetting. Additionally we can explore the wider parameter space to clarify the role of the binding force under nonequilibrium conditions.
The model of Ref. [6] is characterized by an adsorption rate and a desorption rate and exhibits a continuous wetting transition at a certain threshold . The transition is related to an unpinning process of an interface from a substrate, which may be described in general by a Kardar-Parisi-Zhang (KPZ) equation in a hard-core potential [7]. The additional short-range force is introduced by modifying the growth rate at zero height. Thus, for (), there is an attractive (repulsive) interaction between the substrate and the bottom layer. We find that a sufficiently strong attractive interaction modifies the nature of the unbinding transition, making it first order. Moreover, we observe that pinned and moving states coexist as thermodynamically stable states in a whole region of the parameter space rather than on a line, as in the case of equilibrium transitions. This kind of behavior has been observed in the past in other non-equilibrium models [8, 9] and should be a generic feature of wetting transitions under nonequilibrium conditions.
A Definition of the model:
The model is defined in terms of growth of a one-dimensional
interface on a lattice of sites with associated
height variables and periodic
boundary conditions. We consider a restricted
solid-on-solid (RSOS) growth process, where the
height differences between neighboring sites can
take only values . In addition, a
hard-core wall at zero height is introduced.
The model depends on three parameters
, and . It evolves by random sequential
updates, i.e., in each update attempt
a site is randomly selected and one of the
following processes is carried out:
– adsorption of an adatom with
probability at the
bottom layer and probability
at higher
layers :
| (1) |
– desorption of an adatom from the edge of a terrace
with probability :
| (2) |
– desorption of an adatom from the interior of a terrace
with probability :
| (3) |
A process is carried out only if the resulting interface height is non-negative and does not violate the RSOS constraint . The time increment per sweep (N attempted updates) is .
The phase diagram for the case has been studied in [6, 11], where a continuous wetting transition was found. Clearly, the moving state is not affected by and thus the transition line above which it is stable remains unchanged. However, the stability of the pinned state strongly depends on , modifying the phase diagram and the nature of the wetting transition. In order to gain some insight into the mechanism leading to first-order transition, we first consider the case. Here detailed balance is obeyed [6], wherefore the transition can be described in the framework of equilibrium statistical mechanics [10]. We then consider the case numerically.
B The case :

For and the dynamic rules satisfy detailed balance and the probability of finding the interface in a configuration can be expressed in terms of a potential by
| (4) |
where the partition sum runs over all interface configurations obeying the RSOS constraint. The potential is given by
| (5) |
As shown in the inset of Fig. 1, the attractive interaction between substrate and bottom layer is incorporated as a potential well at zero height. For the slope of the potential is positive so that the interface is always pinned to the wall. For , where the slope is negative, the interface can ‘tunnel’ through the potential barrier and eventually detaches from the substrate. It should be noted that in this case, the equilibrium distribution (4) is no longer valid, i.e., the system enters a non-stationary nonequilibrium phase.
The nature of the transition depends on the depth of the potential well. For , the potential well is deep enough to bind the interface to the wall at the transition point , giving rise to a localized equilibrium distribution with a discontinuous transition. For , no localized solution exists at and the transition becomes continuous. The two transition lines are separated by a tricritical point at .
In order to prove the existence of the first-order line, we apply a transfer matrix formalism [2]. Defining a transfer matrix acting in spatial direction by
| (6) |
we compute the eigenvector of corresponding to the largest eigenvalue , which determines the steady-state properties of the system. For the solution reads
| (7) |
where and
| (8) |
The stationary density of exposed sites at the bottom layer is given by . It is nonzero for and vanishes linearly at the tricritical point. This proves the existence of the first-order phase transition line in Fig. 1.
In Ref. [6] the density and the interface width at were found to scale as
| (9) |
with the critical exponents and . Using the transfer matrix approach, we can prove that these bulk exponents remain valid along the entire second order phase transition line, except for the tricritical point where . Moreover, approaching the tricritical point from the left along the first order transition line, it can be shown that the two quantities scale as
| (10) |
where .
C The case :

In this case the dynamic rules do not satisfy detailed balance and the model cannot be solved using the previous methods. Performing Monte-Carlo simulations we determined the phase diagrams for various values of . For we find that the moving and the pinned phases coexist in a whole region of the parameter space rather than just on a line, as is the case for equilibrium first order transitions. As shown in Fig. 2, the coexistence regime for ends at the tricritical point , where the second-order phase transition line starts. Unlike metastable states, the pinned phase is thermodynamically stable inside the coexistence regime, i.e., its life time grows exponentially with the system size, as shown in the inset of Fig. 2.
For , however, there is no region of phase coexistence and the phase diagram is similar to that of Fig. 1. For instance, for the first-order phase transition line ends at the tricritical point , . For , we expect that Eqs. (9)-(10) still describe the scaling behavior at the tricritical point, although with different sets of critical exponents.
In order to understand the mechanism leading to phase coexistence for , let us consider the evolution of a large droplet (an interval where the interface is detached from the bottom layer) in the vicinity of the upper terminal point of the coexistence regime . Because of the RSOS constraint, the growing droplet eventually reaches an almost triangular shape with unit slope at the edges. The interface of the triangular droplet fluctuates predominantly by diffusion of pairs of sites with equal height. Inspecting the dynamic rules, it is easy to verify that these ‘landings’ of the staircase move upwards with rate and downwards with rate . Hence, for the droplet is stable with a life-time exponential in its lateral size. For and , fluctuations of the bottom layer are biased to move upwards at the edges of the droplet. Thus the droplet grows and the interface eventually detaches from the bottom layer. On the other hand, if and , fluctuations at the top of the triangular droplet are biased to diffuse downwards to the edges. Therefore, the droplet shrinks at constant velocity in a time proportional to its size, ensuring the stability of the pinned phase.
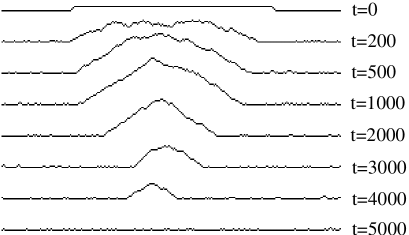
As shown in Fig. 3, this robust mechanism for the elimination of droplets also works for positive values of . If the interface detaches from the substrate over some distance due to fluctuations, the resulting droplet grows and reaches an almost triangular shape. In the coexistence regime, the droplets are biased to shrink in a time proportional to its size, resulting in a stable pinned phase. However, spontaneously created small islands next to the bottom layer contribute to the broadening of the droplets, reducing the range of phase coexistence. This explains why the upper boundary of the coexistence regime decreases as is increased. At the upper boundary the stationary density of exposed sites at the bottom layer is found to change discontinuously.
The transition line above which the unbound phase is stable is independent of the growth rate . This line is the lower curve in Fig. 4, which is common to all four diagrams. For smaller than some threshold , the pinned and the unbound phases coexist in a certain region of the phase diagram. As can be seen in the Figure, this region is bounded by two lines which intersect to the right at the equilibrium transition point . For , this is the only intersection point of the two lines and the phase coexistence region extends down to . On the other hand, for the two lines also intersect on the left at another tricritical point, reducing the size of the region of phase coexistence. This region disappears at . On the basis of our numerical simulations, it is not possible to conclude whether is equal or strictly smaller than .

D Discussion:
Within a more general framework, the coexistence of the moving and the pinned phase may be viewed as follows. The evolution of the interface may be described in terms of the KPZ equation
| (11) |
with positive heights , where the velocity plays the role of . Clearly, for the transition takes place at . For , the nonlinear term of Eq. (11) may be interpreted as an additional force acting on tilted parts of the interface in the direction of growth. This force supports the growth of droplets wherefore the interface detaches for any . However, if this force acts against the direction of growth. Consequently, a sufficiently tilted interface does not propagate and may even move downwards. For this leads to the formation of fluctuating droplets with a triangular shape and a finite slope at the edges. If the short-range force at the bottom layer is strong enough, such droplets, once formed, will shrink at constant velocity. Thus, the moving and the pinned phase can only coexist in those parts of the phase diagram where is negative. In fact, as shown in [6], is negative along the transition line for and changes sign at .
The phenomenon of phase coexistence was first observed in Toom’s two-dimensional north-east-center voting model [8]. It was also shown that open boundaries in certain one-dimensional diffusive models may exhibit similar phenomena [9]. The model discussed in this work demonstrates that phase coexistence can also emerge in homogeneous one-dimensional driven systems.
We would like to thank M.R. Evans for valuable discussions.
The support of the Israel Science Foundation, the Israel
Ministry of Science, and the Inter-University High Performance
Computation Center is gratefully acknowledged.
H.H. would like to thank the Weizmann Institute for
hospitality where parts of this work have been done.
REFERENCES
- [1] S. Dietrich, in Phase Transitions and Critical Phenomena, ed. by C. Domb and J. L. Lebowitz, Vol. 12, p. 1. (Academic Press, London, 1983).
- [2] J. M. J. van Leeuwen and H. J. Hilhorst, Physica A 107, 318 (1981); T. W. Burkhardt, J. Phys. A 14, L63 (1981).
- [3] R. K. P. Zia, R. Lipowsky, and D. M. Kroll, Am. J. Phys. 56, 160 (1988).
- [4] R. Blossey, T. Kinoshita, and J. Dupont-Roc, Physica A 248, 247 (1998).
- [5] A. L Barabási and H. E. Stanley Fractal concepts in surface growth, Cambridge University Press, U.K. (1995).
- [6] H. Hinrichsen, R. Livi, D. Mukamel, and A. Politi, Phys. Rev. Lett. 79, 2710 (1997).
- [7] M. Kardar, G. Parisi, Y.C. Zhang, Phys. Rev. Lett. 56, 889 (1986); Y. Tu, G. Grinstein, and M.A. Muñoz, Phys. Rev. Lett. 78, 274 (1997); M.A. Muñoz and T. Hwa, Europhys. Lett. 41, 147 (1998).
- [8] A. L. Toom, in Multicomponent Random Systems, ed. by R. L. Dobrushin, in Advances in Probability, Vol. 6 (Dekker, New York, 1980), pp. 549-575; C. H. Bennett and G. Grinstein, Phys. Rev. Lett. 55, 657 (1985).
- [9] C. Godrèche, J. M. Luck, M. R. Evans, D. Mukamel, S. Sandow, and E. R. Speer, J. Phys. A 28, 6039 (1995).
- [10] D. S. Fisher and D. A. Huse, Phys. Rev. B 32, 247 (1985); D. M. Kroll and R. Lipowsky, Phys. Rev. B 26, 5289 (1982); E. Brézin, B. I. Halperin, and S. Leibler, Phys. Rev. Lett. 50, 1387 (1983).
- [11] For the special case , see: U. Alon, M. R. Evans, H. Hinrichsen, and D. Mukamel, Phys. Rev. Lett. 76, 2746 (1996); Phys. Rev. E 57, 4997 (1998).