[
Mid-infrared absorption in YBa2Cu3O6:
Failure of spin-wave theory in undoped cuprates?
Abstract
The optical conductivity of undoped YBa2Cu3O6 is studied in detail in the mid-infrared range. Substitutions on all but the Ba site are used to identify the prominent absorption processes at 2800 and 3800 cm-1. Experimental evidence for bimagnon–plus–phonon absorption is collected. A more critical analysis of the lineshape and the spectral weight reveals the limits of this approach. Although phonon-2-magnon multiple scattering seems to reproduce the lineshape, the necessary coupling is unrealistically large. The strong increase of high frequency spectral weight with increasing temperature makes the failure of spin-wave theory even more evident.
pacs:
PACS numbers: 74.72.-h 74.25.Gz, 78.30.Hv, 75.40.Gb, 75.50.Ee]
The undoped parent compounds of the high Tc cuprates are regarded as an almost ideal realization of a two-dimensional (2D) spin 1/2 Heisenberg antiferromagnet. Despite the low dimensionality and the low spin the excitations are thought to be spin-waves with a well-defined dispersion[1], as opposed to e.g. 1D systems, where a spinon continuum is observed in neutron scattering[2]. In the cuprates, a spin-wave dispersion has been extracted throughout the whole Brillouin zone from the maxima in neutron scattering intensities, but energies are rather high, large backgrounds are observed and the magnitude of quantum corrections is unclear[3]. Moreover, the assumption that magnons are not well-defined particles at the Brillouin zone boundary was a keypoint in the successful description of the photoemission data of insulating Sr2CuO2Cl2 in Ref. [4]. Two-magnon (2M) Raman scattering shows several anomalies in the cuprates, in particular a very broad lineshape, spectral weight at high energies and a finite signal in geometry[5]. A large body of theoretical work has been dedicated to this problem, and the importance of resonance phenomena[6] was emphasized. Other treatments include the interaction with phonons[7] and extensions of the Heisenberg model[8]. Certainly, the strong influence of the charge transfer (CT) resonance on the Raman spectra complicates the problem significantly.
Optical spectroscopy probes the magnetic excitations more directly. The main peak in mid-infrared absorption (MIR) spectra of La2CuO4 and other single layer cuprates[9] has been interpreted by Lorenzana and Sawatzky [10] in terms of bimagnon–plus–phonon (BIMP) absorption. A similar feature was reported in the bilayer system YBa2Cu3O6 (YBCO6)[11], in 2D S=1 La2NiO4[10, 12] and in 1D S=1/2 Sr2CuO3[13, 14]. Good agreement is achieved in 1D [14] because quantum fluctuations are included ab initio, and for the 2D S=1 nickelates [10] because fluctuations beyond spin-wave theory are small. However, in the cuprates the estimate for the spectral weight of BIMPs is one order of magnitude too small. Moreover, a large amount of spectral weight is observed above the BIMP absorption. Interpretations in terms of multi-magnon–plus–phonon absorption[10], - transitions[12] and CT excitons[15] have been proposed. We challenge these approaches and suggest that a full account of our MIR data in the undoped cuprates has to include quantum fluctuations beyond spin-wave theory. This might provide an important feedback to the Raman experiment and the basic picture of the undoped cuprates.
Specific ionic substitutions help to identify the prominent resonances in the MIR spectrum of YBCO6. In particular we use oxygen isotope substitution to distinguish vibrational from electronic degrees of freedom and to give direct experimental evidence for the existence of BIMP absorption. Substituting rare earth (RE) elements for Y increases the lattice parameter and thereby changes the exchange constant . The dependence of the BIMP frequency on is found to be similar to the one reported for 2M Raman scattering[16, 17].
Single crystals of YBa2Cu3O7 were grown in BaZrO3 (BZO) crucibles. Crystals grown using this technique exhibit a superior purity ( 99.995 at. %)[18, 19]. The full exchange of the oxygen isotope was described elsewhere[20]. For comparison, single crystals grown in Y2O3 stabilized ZrO2 (YSZ) crucibles[21] were studied as well. A finite amount of Y in the single crystals of RE0.8Y0.2Ba2Cu3O6 (RE=Pr, Gd) studied here is due to the Y2O3 in the ZrO2 crucibles. In the case of YBa2Cu3-yZnyO6[22], we estimate [20]. The oxygen content of all crystals was fixed to a value O6 by annealing them for about a week in a flow of high purity Argon (99.998 %) at 750∘C or in ultra high vacuum at 700∘C. We calculated by inverting the Fresnel equations for the experimentally measured transmission and reflection data. Measurements were carried out with the electric field vector polarized parallel and perpendicular to the -plane. The small remnants of interference fringes in some of the calculated spectra of are artifacts caused by deviations of the measured data from the assumed ideal case of absolutely flat and plane parallel surfaces.
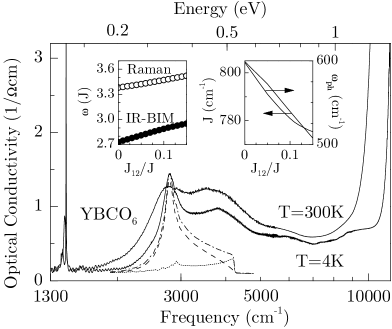
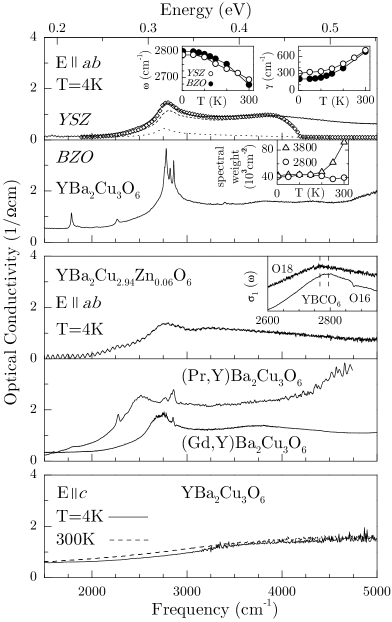
We first collect evidence for the applicability of a magnon-phonon interpretation of the main resonance. In Fig. 1 we display of YBCO6 up to the onset of CT absorption for T=4 and 300 K. Note the very low values of , which are two (four) orders of magnitude lower than for YBCO6.1 (YBCO7) in this frequency range. Following the interpretation of the single layer compounds[10] we ascribe the main peak at 2800 cm-1 to BIMP absorption. A magnetic origin is also favored by recent measurements of the pressure dependence of the MIR and Raman spectrum of Sr2CuO2Cl2[23]. In the cuprates bimagnon absorption is forbidden due to inversion symmetry. It only becomes weakly allowed by symmetry breaking effects like impurities or the combination with a phonon. Let us compare the experimental data with predictions of BIMP theory on a qualitative basis (Fig. 2). The two upper plots show spectra of two samples of YBCO6 grown in different crucibles (top panel YSZ, below BZO). The strong temperature dependence of the BIMP peak frequency is most likely due to the reduction of spin stiffness with increasing temperature (left inset, open/full symbols YSZ/BZO). The width of the BIMP resonance is smaller in the cleaner sample grown in a BZO crucible (right inset)[24]. We therefore expect that impurity scattering is not negligible in the determination of the correct lineshapes. Substituting Zn on Cu sites indeed broadens the 2800 cm-1 peak drastically (panel 3 from top in Fig. 2). A finite phonon contribution to the BIMP peak is evident from the frequency shift induced by oxygen isotope substitution in YBCO6 (see inset of same panel). The measured isotope shift of cm-1 is consistent with the BIMP interpretation, assuming that the longitudinal stretching phonon of approximately 550 – 600 cm-1 is excited. Substitution of Y with Pr or Gd leads to a significant frequency shift of the main peak. Similar shifts were observed in 2M Raman scattering[16, 17] and were explained by the dependence of on the lattice parameter . Similar to the case of Zn, the disorder on the Y site after substitution of 80% of Pr or Gd enhances . Finally, the 2800 cm-1 peak is not observed if the electric field is applied parallel to the axis, in agreement with the single layer data[9]. The spikes on top of the main resonance and the other sharp features have not yet been identified. A relation to BIMP absorption is unlikely, as their position is identical in the RE samples.
For a more critical analysis of peak frequency, lineshape and spectral weight we extend the BIMP theory to the bilayer case. In order to obtain the coupling to light we start from a Heisenberg Hamiltonian which takes into account a dependence of the in- and inter-plane exchange constants and on the external electric field E and the phonon coordinates[10]:
where and label nearest neighbor Cu sites in a 2D square lattice, labels the two planes in a single bilayer, and denotes the displacements of O ions. Only Einstein phonons are considered. The different phonons modulate the intersite hopping and the on-site energies on both Cu and O sites. Modulations are taken into account to second order since we also included phonon–2M multiple scattering processes in a refined approach (see below). In Ref. [10] a high energy (HE) approximation was used which is inappropriate for zone center excitations. Our RPA results for two interacting magnons show that the HE approximation reproduces the line shape rather well. Both RPA and HE produce 2M bound states with a strong dispersion in momentum space. However, the sharp resonances at the low energy side of the BIMP reported in Ref. [10] are removed in RPA.
Both the Raman and infrared 2M peak frequencies were calculated as a function of (left inset of Fig. 1). In the infrared case, the phonon frequency still has to be added. At T=4K the experimental BIMP and 2M Raman spectra peak at 2795 and 2720 cm-1[5], respectively. From these we can deduce the values of and for a given ratio (right inset of Fig. 1). We obtain cm-1 and . Neutron scattering suggests =0.1 – 0.15[25, 26] and – 600 cm-1[27] for the relevant longitudinal stretching phonon mode. However, a finite next-nearest neighbor coupling will shift the values of and considerably[28].
Let us compare the calculated and measured lineshapes and oscillator strengths of the BIMP peak. The calculated BIMP absorption for =780 cm-1, =0.1 and cm-1 is plotted together with the experimental curve in Fig. 1 (dash-dotted line). An offset of 0.1 cm-1 has been used. In a bilayer we have to distinguish two contributions: a photon can flip two spins (i) in the same layer (dashed line, in-plane) or (ii) in adjacent layers (dotted line, inter-plane). For (i) a rough estimate of the 2M binding energy in the Ising limit is . This implies that the 2M energy at the zone boundary is about below the upper cut-off of the 2M-spectrum, which approximately corresponds to the BIMP position in Fig. 1. Similarly, the binding energy is for case (ii) which explains the maximum of the calculated inter-plane conductivity just below the 2M cut-off. The estimated relative spectral weight of inter- and in-plane contributions is 0.06 – 0.3 for =0.1. Due to this small value the spectral weight is similar in YBCO6 and in La2CuO4 both experimentally and theoretically. The perturbatively estimated spectral weight is a factor of 8 – 15 too small compared to experiment[29].
| peak A | peak B | A/B | 2M cut-off | |
|---|---|---|---|---|
| YBa2Cu3O6 | 2800 | 3800 | 0.74 | 3700 = 4.72 |
| La2CuO4 | 3300∗ | 4500∗ | 0.73 | 4500 = 4.63 |
| Sr2CuO2Cl2 | 2900∗ | 4000∗ | 0.73 | 4000 = 4.63 |
Regarding the lineshape the calculated curve is sharper than the experimental one, but the width of the BIMP peak is sample dependent, as stated above. As in the single layer cuprates, the real problem is obviously at higher frequencies: the strong peak at 3800 cm-1 remains unexplained. It is likely that the high energy anomaly has the same origin in MIR and Raman spectra. This is substantiated by the absence of the anomaly in both spectroscopies in S=1 La2NiO4[12, 30]. In several cuprates, the frequency ratio of the two dominant MIR peaks is about 0.73 (Table 1), strongly suggesting a common magnetic origin. In other terms, the second peak in both single and bilayers is close to the 2M cut-off. One way of shifting spectral weight to the 2M cut-off is to consider a finite interaction between phonons and bimagnons. A dimensionless coupling constant for phonon-2M multiple scattering is defined as from which we estimate for the stretching phonon mode[31, 32]. A negative value of translates into a repulsive phonon-2M interaction and shifts spectral weight to higher frequencies. A way to test the reliability of our estimate of is to compare the linear coupling with the experimental pressure dependence of [33]. There, our estimate is 1 – 2 times smaller. However, an excellent fit to the data (diamonds in top panel of Fig. 2) is obtained only if we assume (dashed line) and add the BIMP contribution of the apical stretching phonon. The apical contribution is expected to have a 5 times smaller weight and a negligible phonon-2M coupling (dotted line). This large value of makes such a scenario very unlikely. Phonon-magnon scattering processes have also been considered for the explanation of the width of the 2M Raman resonance[7, 8]. Contrary to our dynamic treatment, their adiabatic approach models static disorder, which enhances the width but does not result in a second resonance. Hence we conclude that phonon-magnon interaction processes cannot explain the magnetic MIR and Raman anomalies.
A severe constraint for any interpretation of the high frequency spectral weight is the observed increase by a factor of more than 2 from 4 to 300 K (triangles in inset of panel 2 of Fig. 2). A similar behavior can be detected in the temperature dependence of of Sr2CuO2Cl2[34]. We propose that these findings support the notion of a strong local deviation from the Néel state which is even more pronounced for 300 K. Whereas the broken symmetry of the antiferromagnetic state will still support long wavelength spin-wave excitations, the character of the short wavelength magnetic excitations reflects the strong quantum fluctuations and consequently they are insufficiently represented by spin-waves. Both Raman and MIR are dominated by short wavelength magnetic excitations which makes their evaluation within spin-wave theory less reliable. We emphasize that this interpretation does not contradict the good agreement of neutron scattering results with spin-wave theory for small momenta. Note that even in 1D the inapplicability of a spin-wave picture to neutron data was not realized for many years[35].
Exact diagonalization should serve to identify the weight of magnetic excitations. However, only clusters of up to were investigated and produced a minor contribution to MIR absorption at high frequencies[36]. Since this cluster size is still comparable to the size of the considered high frequency excitations, a finite size scaling analysis would be a serious test whether the Heisenberg model or a 4-spin extension[8] of it can generate the measured high frequency weight.
In the absence of doping, the only alternative to a magnetic origin of the anomaly are excitons. Perkins et al.[12] suggested a - exciton with sidebands. However, this exciton should not be IR active, and there is theoretical[37, 38] and experimental[39] evidence that its actual energy is a factor of two to three higher. Wang et al.[15] predict a CT exciton at 0.8 eV (6500 cm-1) from fits to EELS data between 2.5 and 4 eV. We consider the Coulomb attraction necessary to pull this exciton down to 3800 cm-1 – far below the CT gap – as unrealistically large. Furthermore, a CT exciton should follow the strong redshift of the onset of CT absorption with increasing temperature (10500 to 9000 cm-1, see Fig. 1), which is not observed. Both exciton models fail to describe the increase of spectral weight with temperature. Hence the exciton interpretation is an unlikely scenario for the considered resonance. Direct excitation of 2 magnons in bilayers via spin-orbit coupling was suggested[11] to reproduce the MIR lineshape in YBCO6 up to 4000 cm-1. However, a spin exchange of had to be assumed, which is not anymore consistent with neutron scattering[25, 26].
We conclude that present day understanding of magnetic excitations in undoped cuprates is not sufficient to explain both MIR and Raman data. Only a more appropriate treatment of the short wavelength excitations will explain the observed anomalies.
It is a pleasure to acknowledge many stimulating discussions with G.A. Sawatzky. We also want to thank R. Eder and J. Brinckmann for helpful discussions. This project is supported by the Netherlands Foundation for Fundamental Research on Matter with financial aid from the Nederlandse Organisatie voor Wetenschappelijk Onderzoek and by the DFG and DFG-GK.
REFERENCES
- [1] E. Manousakis, Rev. Mod. Phys. 63, 1 (1991).
- [2] D.A. Tennant et al., Phys. Rev. B 52, 13368 (1995).
- [3] P. Bourges et al., Phys. Rev. Lett. 79, 4906 (1997).
- [4] A.V. Chubukov, and D.K. Morr, Phys. Rev. B 57, 5298 (1998).
- [5] G. Blumberg et al., Phys. Rev. B 53, 930 (1996).
- [6] A.V. Chubukov, D.M. Frenkel, Phys. Rev. Lett. 74, 3057 (1995); D.K. Morr et al., Phys. Rev. B 54, 3468 (1996).
- [7] F. Nori et al., Phys. Rev. Lett. 75, 553 (1995).
- [8] J.M. Eroles et al., Phys. Rev. B 59, 1468 (1999).
- [9] J.D. Perkins et al., Phys. Rev. Lett. 71, 1621 (1993).
- [10] J. Lorenzana and G.A. Sawatzky, Phys. Rev. Lett. 74, 1867 (1995); Phys. Rev. B 52, 9576 (1995).
- [11] M. Grüninger et al., Europhys. Lett. 35, 55 (1996).
- [12] J.D. Perkins et al., Phys. Rev. B 52 (1995) R9863.
- [13] H. Suzuura et al., Phys. Rev. Lett. 76, 2579 (1996).
- [14] J. Lorenzana, R. Eder, Phys. Rev. B 55, R3358 (1997).
- [15] Y.Y. Wang et al., Phys. Rev. Lett. 77, 1809 (1996); and F.C. Zhang, and K.K. Ng, Phys. Rev. B 58, 13520 (1998).
- [16] M. Yoshida, N. Koshizuka, and S. Tanaka, Phys. Rev. B 42, 8760 (1990).
- [17] S.L. Cooper et al., Phys. Rev. B 42, 10785 (1990).
- [18] A. Erb, E. Walker, and R. Flükiger, Physica C 245, 245 (1995); ibid. 258, 9 (1996).
- [19] A. Erb et al., Physica C 282-87, 89 and 459 (1997).
- [20] M. Grüninger et al., Proceedings of the ACS’1 conference, Crete 1998, to be published in Physica C.
- [21] A. Erb, T. Traulsen and G. Müller-Vogt, J. Cryst. Growth 137, 487 (1994).
- [22] Th. Wolf et al., J. Cryst. Growth 96, 1010 (1989).
- [23] J. Graybeal, private communication.
- [24] The parameters were obtained from a Lorentzian fit to the 2800 cm-1 peak. The sharp structures of the sample grown in BZO were fit separately.
- [25] D. Reznik et al., Phys. Rev. B 53, R14741 (1996).
- [26] S.M. Hayden et al., Phys. Rev. B 54, R6905 (1996).
- [27] S.L. Chaplot et al., Phys. Rev. B 52, 7230 (1995).
- [28] D.K. Morr, Phys. Rev. B 58, R587 (1998).
- [29] The deviation is larger than given in Ref. [10], as a realistic estimate of (see Ref. [10]) yields for both La2CuO4 and YBCO6.
- [30] S. Sugai et al., Phys. Rev. B 42, 1045 (1990).
- [31] W.A. Harrison, Electronic Structure and the Properties of Solids (Freeman, San Francisco, 1980).
- [32] This is derived from Harrison’s [31] and modulations of the on-site potentials.
- [33] M.C. Aronson et al., Phys. Rev. B 44, 4657 (1991).
- [34] A. Zibold et al., Phys. Rev. B 53, 11734 (1996).
- [35] Y. Endoh et al., Phys. Rev. Lett. 32, 170 (1974).
- [36] J. Lorenzana et al., J. Supercond. 8, 567 (1995).
- [37] H. Eskes, L.H. Tjeng, and G.A. Sawatzky, Phys. Rev. B 41, 288 (1990).
- [38] R.L. Martin, P.J. Hay, J. Chem. Phys. 98, 8680 (1993).
- [39] P. Kuiper et al., Phys. Rev. Lett. 80, 5204 (1998).