Harmonic generation from microwave resonators
Abstract
Measurement of harmonic power on a suspended stripline microwave resonator patterned out of thin film (YBCO) has been carried out as a function of temperature and microwave power. The third harmonic power shows a subtle nonlinear dependence on the fundamental power on a log-log scale. Fit to a straight line yields slopes of vs. between 1.5 to 3, contrary to elementary calculations that predict a slope of exactly 3. It is shown that third harmonic power generated from higher order terms in the nonlinear impedance could account for the discrepancy quantitatively without resorting to any additional ad-hoc assumptions. Results of measurement of fifth harmonic power is presented as a confirmation. A small second harmonic power is also observed that does not show anomalous power dependence within the experimental accuracy.
Since the day of its discovery, the new breed of oxide superconductors with transition temperatures above the boiling point of nitrogen have shown great potential as a replacement for metals in passive microwave structures owing to their very low surface resistance [1, 2, 3]. However, widespread applications have been hampered by the inherent nonlinearity that these materials display. The nonlinearity manifests itself as an increase of insertion loss of the device with power level as well as harmonic generation and intermodulation distortion. A systematic understanding of the phenomenology and microscopic origin of the nonlinear response is therefore very important for successful device applications.
Measurement of the third order intercept (TOI), defined as the input power at which the fundamental and the third harmonic output power are equal to each other, is a quantitative measure of the nonlinear response of the device. The TOI can be measured both via a single tone (harmonic generation) as well as multi-tone (intermodulation distortion) measurement. Usually the former is carried out in a nonresonant transmission line structure and the later in a high- resonant structure with the applied tones close to the resonance frequency . While the single tone experiment has the simplicity of design (only one signal source is needed), it lacks the sensitivity of the multi-tone measurement. The multi-tone measurement has the drawback of additional complexity owing to the need of multiple signal sources, power combiners and carefully matched waveguides. In the experiment described in this paper, we have carried out single tone measurements on a resonant structure, combining the advantage of both techniques. The problem of single-tone measurement on a resonant structure, namely, the shift of resonant frequency due to any change in experimental parameters was solved by dynamically tuning the synthesized source before taking each individual data point. Since where is the surface reactance, the effect of microwave power induced change to the kinetic inductance of the device is also measured simultaneously.
The experiments were carried out on films patterned out of five different YBCO wafers on substrate obtained commercially. The wafers were patterned using standard photolithography techniques (wet etching) into straightlines wide and thick. Using a standard microwave formula, the characteristic imedance was evaluated to be . The patterned structure has YBCO only on one side, i.e. it does not use superconducting ground planes. The copper package housing the film also provides the necessary grounding. This gives us the necessary sensitivity to measure the effect of very small applied DC magnetic fields which would be shielded out by a superconducting ground plane. Such a capability is important and unique to our setup as small DC fields have been shown to improve device characteristics[4]. The results of the field measurements, kinetic inductance effects, details of temperature dependence and some related topics will be described elsewhere[5].
The resonators (GHz) were characterized using a vector network analyzer. The unloaded was - at 10 K. Coupling was subsequently increased to transmit maximum power through the resonator. The nonlinearity manifests itself as a distortion of the Lorentzian shape of the resonance curve[6] and a decrease of .
The synthesizer was set to generate a CW signal at the resonance frequency that was amplified by 30 dB, filtered by a coaxial 5 GHz low pass filter and was fed to the resonator. The output of the resonator was analyzed with a spectrum analyzer.
The aspect of harmonic generation or intermodulation distortion that is most commonly investigated is its dependence on the input power. The knowledge of this dependence is very important both from the point of view of device design as well as understanding the mechanism of nonlinearity. A simple algebraic argument, as shown below, predicts the third order nonlinear power to scale as the cube of the input power. However, there is a lack of consensus about this in the experiments carried out by different investigators. Not only does the dependence differs from a cube[7, 11], it also depends upon the input power. It is often seen that the dependence is closer to rather than [8].
In this letter, we show that this discrepancy comes about because of:
-
Failure to take into account the power dependence of the insertion loss of the device.
-
The assumption that the entire third harmonic power comes from the cubic term of the current-dependent nonlinear impedance .
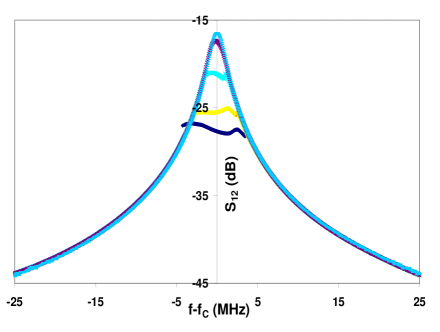
The first point, often neglected in the analysis of nonlinear frequency conversion data is that the harmonic power is generated by the current flowing in the device which does not scale quadratically with the input power because of the power dependence of the insertion loss. In the case of a moderately nonlinear device this manifests as a distortion of the Lorentzian shape of the resonance in the frequency domain corresponding to the power being transfered to higher harmonics. In the extreme case, this can lead to saturation and discontinuous changes in output power. Higher levels of applied power go to heating the device decreasing the output power. Fig. 1 shows the value of the transmission amplitude for one of the resonators obtained from a vector network analyzer as the frequency is swept about the resonance at input power levels of 10, 5, 0, and dBm respectively, 10 dBm corresponding to the lowest trace and dBm corresponding to the highest. Decreasing the input power below dBm value did not increase any further, indicating that the device is operating in the fully linear regime. Similarly, increasing the input power above 10 dBm did not seem to lower the saturation any futher. Depending on the sample, other manifestations of nonlinear behavior, such as a step-like change superimposed on a Lorentzian trace were also observed. Many of these can be modeled as a lumped resonator involving nonlinear elements[9]. Extremes of such nonlinear behavior also serve as a characterization of the quality of the superconducting film as more granular films tend to demonstrate this behavior.
Before each measurement of harmonic power reported below, the resonance was characterized using a network analyzer to ensure that the input/output antennas were not overcoupled and to verify that the response of the resonator was still the same. Direct coupling between the antennas were found to be at least 50 dB below the resonance, ensuring that the transmitted power comes from microwave currents induced in the resonator only.
It is therefore clear that trying to calculate the slope of the harmonic power against the input power can give misleading results. One way to correct for the error is to calculate the RMS current in the resonator taking into account the insertion loss of the device[10]. In this paper we plot the harmonic power against the output power at the fundamental frequency which automatically compensates for insertion losses.
The second implicit assumption made in the analysis of the dependence of the third harmonic power on the input power is that the entire contribution to the former comes from the cubic term in the nonlinear impedance. However, any higher order odd term will also contribute to the third harmonic. Assuming , the third harmonic term can be written as , the negative sign implying that the 3rd harmonic is phase shifted by from the fundamental. Since spectrum analyzer measurements are not sensitive to relative phase, we ignore the negative sign. Choosing a reference value for current (for example, the current that generates 1 mW of power in case of a dBm scale) and taking logarithm of both sides and assuming , we get
| (1) |
The presence of a fifth (or higher) order contribution to the third harmonic power would be indicated by a simultaneous observation of the fifth harmonic signal.
Typical data for second, third and fifth harmonic of one of the films at 30 K is shown in fig. 2. The inset shows second and third harmonic data of a different film from a different manufacturer at 67.5 K. The second harmonic power is much weaker than the third (and even the fifth) as expected of a superconductor. The fifth harmonic power falls below the noise floor of the spectrum analyzer at a fundamental power of dBm because the noise floor of the spectrum analyzer is significantly higher at higher frequencies. The second harmonic power, being very weak, is difficult to measure and analyze reliably. In the cases where a reasonably strong second harmonic signal was seen, its slope against the fundamental was close to 2:1 on a log-log scale, as is expected. However, the third harmonic power has a much more complex dependence on the input power. Fitting the plot to a straightline yields a slope of anywhere between 1.5 to 3 depending on the film and the temperature with a variance of a few %. Usually such values of the variance signifies that the fit is very good. However, as fig 2 shows, the data has a richer structure than a straighline.
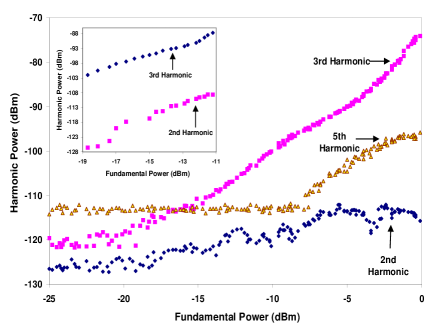
It is therefore obvious that the third harmonic power cannot be coming from the third order nonlinear term only, as has traditionally been assumed. We can fit the data quantitatively by keeping one to two more term in the Taylor series expansion of the nonlinear impedance, depending on the sample. Fig. 3 shows the data of fig. 2 along with a straightline fit (with a slope of 2.3118 and variance of 0.0115) and a fit calculated by keeping the third harmonic contribution from a fifth and a seventh order term. The second fit is nearly indistinguishable from data. The top inset shows third harmonic data of a different film at 55 K, a straightline fit (with slope of 2.48 and variance of 0.1142) and a fit keeping upto seventh order terms. The lower inset shows the second harmonic data of the same film at the same temperature as the upper inset and a straightline fit with a slope of 2.001 and variance of 0.04). In those films (such as the one in fig. 2) where a seventh order term was necessary to obtain a satisfactory fit, one should be able to see a seventh harmonic signal as well. We were, however, unable to measure it as it was outside the bandwidth of our spectrum analyzer. A similar method of analysis has also been used by other investigators[11]. However, to our knowledge, this is the first measurement of the fifth harmonic which validates the argument.

In principle the above type of analysis should be applicable to the second harmonic power also. However, since the measured second harmonic data fits reasonably well to the predicted 2:1 behavior, it is likely that the contribution to the second harmonic power from higher harmonics is small. In any case, our low pass filter had a harmonic passband that coincided with the fourth harmonic frequency. We were, therefore, unable to measure this quantity. Let us point out here that the even harmonics do not contribute to the third harmonic power and odd harmonics do not contribute to the second harmonics. Physically speaking, this implies that time reversal symmetry breaking and preserving mechanisms of harmonic generation are independent of each other.
There are a few mechanisms for the observed second harmonic power, e.g. Josephson vortices, intrinsic mechanisms breaking time reversal symmetry or magnetic effects superimposed on the superconducting state. Harmonic generation experiments, being macroscopic in nature, cannot distinguish between these mechanisms and it is quite likely than several different mechanisms contribute to even harmonics simultaneously.
I Acknowledgements
Stimulating discussions with D. E. Oates are thankfully acknowledged. Work at Northeastern was supported by NSF-9711910 and AFOSR.
REFERENCES
- [1] D. P. Choudhury and S. Sridhar, in Wiley’s Encyclopedia of Electrical and Electronic Engineering, edited by J. Webster (John Wiley & Sons, New York, 1999).
- [2] M. J. Lancaster, Passive microwave device applications of high temperature superconductors (Cambridge University Press, New York, 1997).
- [3] Z.-Y. Shen, High-Temperature Superconducting Microwave Circuits (Artech House, Boston, 1994).
- [4] D. P. Choudhury, B. A. Willemsen, J. S. Derov, and S. Sridhar, IEEE Trans. Appl. Supercond. 7, 1260 (1997).
- [5] D. P. Choudhury, J. S. Derov, and S. Sridhar (unpublished).
- [6] B. A. Willemsen, J. S. Derov, J. H. Silva, and S. Sridhar, IEEE Trans. Appl. Supercond. 5, 1753 (1995).
- [7] C. Wilker et al., IEEE Trans. Appl. Supercond. 5, 1665 (1995).
- [8] B. A. Willemsen, K. E. Kihlstrom, and T. Dahm, Appl. Phys. Lett. 74, 753 (1999).
- [9] J. H. Oates et al., IEEE Trans. Appl. Supercond. 3, 17 (1993).
- [10] D. E. Oates, A. C. Anderson, and P. M. Mankiewich, J. Supercond. 3, 251 (1990).
- [11] G. Hampel et al., Appl. Phys. Lett. 71, 3904 (1997).