[
Direct Imaging of the First Order Spin Flop Transition in the Layered Manganite
Abstract
Magnetic field induced transitions in the antiferromagnetic layered manganite were studied using magnetization measurements and a high-resolution magneto-optical imaging technique. We report the first direct observation of the formation of ferromagnetic domains appearing at the first order spin-flop transition. The magnetization process proceeds through nucleation of polarized domains at crystal defect sites and not by domain wall motion. A small magnetic hysteresis is caused by the nucleation and annihilation of domains in the mixed state. These results establish a direct link between the magnetic structure on the atomic scale as seen in neutron scattering and the macroscopic properties of the sample as seen in magnetization and conductivity measurements.
pacs:
PACS numbers: 74.30.Kz, 75.50.Ee, 75.60.-d]
The naturally layered manganites of composition have attracted much recent interest since in addition to the phenomenon of colossal magneto-resistance (CMR) [1] they exhibit a variety of coupled magnetic, electronic and structural groundstates. Depending on the doping level, x, the interplay of superexchange and double exchange interactions between the Mn-moments gives rise to competing antiferromagnetic and ferromagnetic spin arrangements [2]. For intermediate doping levels , is a planar ferromagnet with Curie temperatures, , of about 100 K. Concurrent with the magnetic order the -bilayers become metallic being separated from each other by insulating block layers. The coupling of the magnetic and electronic transitions has been attributed to the double-exchange mechanism [1, 3]. Recent magnetization [4] and neutron scattering [5] experiments on the - compound, , have shown that for this doping level the material is a type A antiferromagnet in which the ferromagnetic bi-layers are stacked antiferromagnetically along the -axis with the Mn-moments oriented along the -axis. The unique feature of this material is the occurrence of a very large, anisotropic magnetoresistance at temperatures well below the magnetic ordering temperature which has been related to a field driven transition in the antiferromagnetic structure [3, 6].
Here we present a study of the magnetic field induced transition using magnetization measurements and magneto-optical imaging. Magneto-optical imaging allows for the first direct observation of the formation of magnetic domains and provides details of the local magnetization process which are unattainable from bulk magnetization and/or conductivity measurements. At low temperature a first order spin-flop (metamagnetic) transition between the antiferromagnetic and polarized states is observed at a field of about 1.1 kOe applied along the -axis. For intermediate field values, we find direct evidence for a mixed state of coexisting spin-flop and antiferromagnetic domains as predicted in Ref. [6]. The magnetization process in the mixed state proceeds through nucleation of spin-flop domains at crystal defect sites. Domain wall motion appears to be of minor significance, especially in the onset region of the transition. A small magnetic hysteresis, consistent with the first order nature of the transition, is caused by the difference between the domain nucleation and annihilation processes.
Single crystals of were melt-grown in flowing 20 % (balance Ar) in a floating-zone optical image furnace. The sample for the measurements described here was cleaved from the resulting polycrystalline boules [7]. It is shaped like an irregular plate (see Fig. 2) with lateral dimension of roughly and thickness (along ) of . The magneto-optical images were obtained using a high-resolution magneto-optical imaging technique originally developed for the study of superconductors [8]. It utilizes the Faraday rotation in an yttrium-iron-garnet film placed on top of the sample to create a map of the magnetic induction component normal to the imaged sample surface.
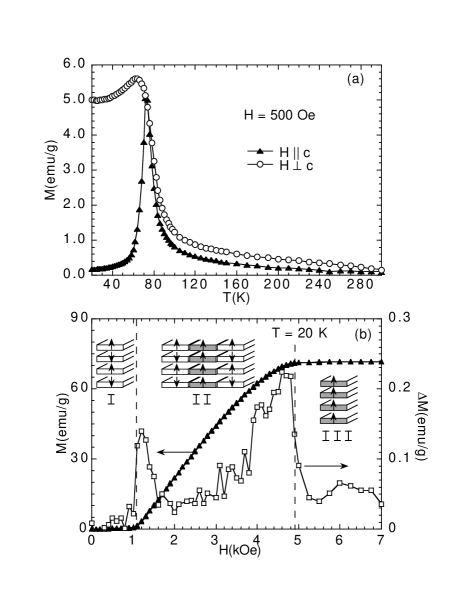
The magnetic characterization of our sample is summarized in Fig. 1. Figure 1a shows the temperature dependence of the magnetization measured in a field of 500 Oe applied along the tetragonal -axis and perpendicular to this axis. The pronounced anisotropy appearing at temperatures below 70 K with the -axis magnetization dropping almost to zero is the typical behavior of a uniaxial antiferromagnet with the magnetic moments aligned parallel to . The peak in the -axis data defines a Neel temperature of = 72 K. The enhanced in-plane magnetization in the paramagnetic state has been observed before [9] and is caused by ferromagnetic intergrowth phases commonly found in this layered material. For our measurements we chose a fairly high field of 500 Oe as to minimize this contribution.
The field dependence of the c-axis magnetization at 20 K is shown in Fig. 1b for increasing () and decreasing () field. The magnetization stays essentially zero (region I ) until a critical field of is reached at which a steep, initially linear rise of the magnetization occurs. The magnetization saturates near at a value of 72 . This magnetization behavior is indicative of a first order spin-flop transition at . In the field region of 1.1 kOe to 4.8 kOe (region II ) a mixed state of coexisting antiferromagnetic and polarized domains is expected due to demagnetization effects [10]. The width of this region is given by the saturation magnetization and by the demagnetization coefficient which is about N = 0.55 for our sample geometry. The spin arrangements in the various phases are indicated schematically in Fig. 1b. Recently, a quantitative description [6] of the conductivity and magnetization in terms of a model including in addition to double exchange first and second order superexchange and anisotropy, respectively, has been presented. Figure 1b also shows the magnetization hysteresis . The magnetization process is essentially reversible, however, clearly resolved peaks of are observed near and at . As discussed in more detail below these are caused by the nucleation of polarized and antiferromagnetic domains, respectively.
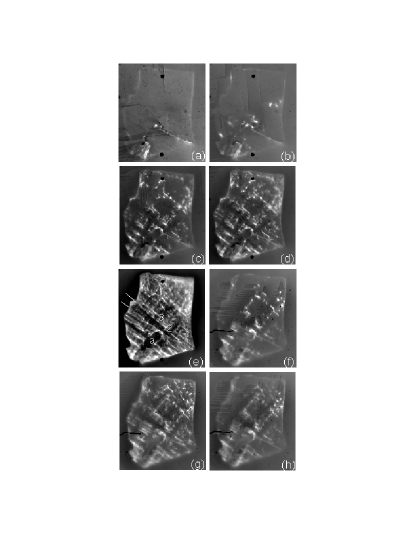
Figure 2 shows magneto-optical images of the normal component of the magnetic induction, , at the sample surface. Bright contrast in these images corresponds to high local values of . Frames (a) to (e) correspond to the magnetization curve in Fig. 1b. At applied fields below (Fig. 2a) the sample is in the antiferromagnetic state and correspondingly there is no magnetic contrast in the bulk of the crystal. Magnetic contrast exists only along the edges of the sample due to demagnetization effects, along a needle shaped domain extending to the lower right corner, and near the lower left corner. The contrast near the lower left is associated with a non-magnetic inclusion labeled a in Fig. 2e. Electron microscopy identifies this inclusion as , a common second phase in the manganites [7]. With increasing field, polarized domains seen as bright spots, nucleate. These images show directly the coexistence of polarized and antiferromagnetic domains as expected for the mixed state of the first order spin-flop transition.
The magnetization process proceeds through the nucleation of new domains. The expansion of polarized domains through continuous domain wall motion as seen in perpendicular magnetized ferromagnetic layers is not observed in this field range. This behavior may have the following reasons. The thickness, , of domain walls in traditional ferromagnets can be estimated from where is the exchange energy, is the anisotropy energy and the lattice constant. Using the available literature data for the in-plane exchange energy, [11], and [6], we estimate a domain wall thickness of about 30 lattice constants. Such a small value implies that these domain walls can be pinned very effectively by imperfections in the underlying crystal structure which prohibits the occurrence of domain wall motion.
The smallest domains that are resolved have a diameter of about 5 . At sufficiently high density domains coalesce to form extended domain structures (see Figs. 2d, e) that exhibit clear striation along two orthogonal directions. Similar behavior has been observed on several crystals. These striations coincide with the crystallographic (100) and (010) directions. Across the dark wedge-shaped area highlighted by the two white lines in Fig. 2e) the direction of striation changes slightly. This area coincides with a small angle grain boundary in the crystal structure. These results indicate that the nucleation sites of the polarized domains are given by the underlying crystal defect structure. Further evidence for this conclusion arises from the observation that the pattern of domains is exactly the same on successive field sweeps and that this pattern is independent of an applied in-plane field. The nature of the nucleation sites and the cause for their patterning have not yet been determined.
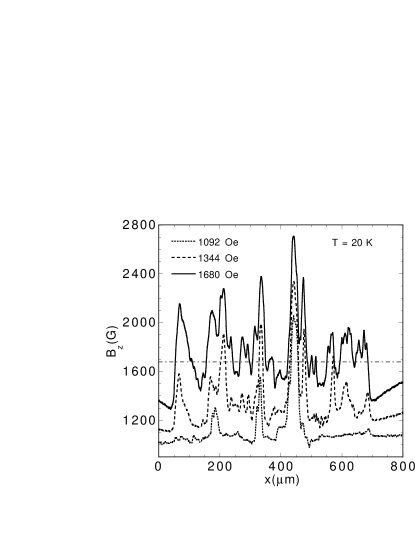
Figure 3 shows field profiles along a horizontal line through the bright spot to the left of label 2 in Fig. 2e) for several applied fields. With increasing field the profiles become increasingly complex. In additon we observe that the local field can drop below the applied value (indicated by the dashed-dotted line for an applied field of 1680 Oe) in the vicinity of polarized regions. Such a field distribution which causes the formation of stripe domains in traditional magnets suppresses the nucleation of additional domains in the vicinity of existing polarized domains and thus stabilizes the striations.
Figures 2f to 2h show magneto-optical images after the sample surface has been polished down by about 20 . The general domain pattern is not changed (compare Figs. 2d and 2g indicating that the dominating features are not a property of a specific surface structure but a property of the bulk. However, there are changes in the arrangement of small domains upon polishing. Figs. 2f and 2h show the domain pattern at 1176 Oe before and after the field has been ramped up to 1344 Oe (Fig. 2g). The observed structures are almost identical, but there is a small hysteresis between the nucleation and annihilation of polarized domains, particularly visible near the top right corner. This is the expected behavior at a first order transition and accounts for the positive magnetization hysteresis near shown in Fig. 1c. Similarly, the magnetization hysteresis near is caused by the hysteresis between nucleation and annihilation of antiferromagnetic domains in a predominantly polarized material.
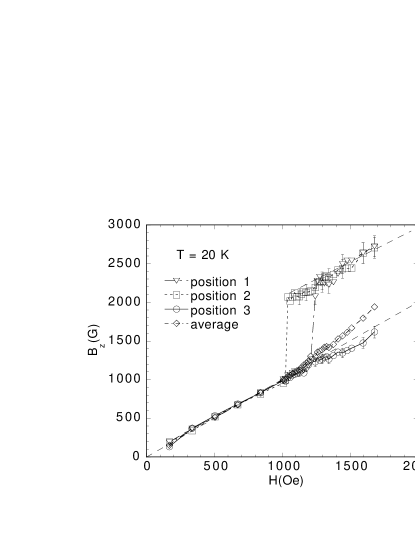
Figure 4 shows local magnetization curves displaying the field dependence of in selected positions on the sample surface. Here, position 1 and 2 mark the bright spots to the left of labels 1 and 2 in Fig. 2e, and position 3 marks the dark spot to left of 3 in Fig. 2e, respectively. For 1 and 2 discontinuous jumps of by about 1000 G are observed consistent with the first order nature of the transition. Up to an external field of 1680 Oe, the highest field reached for imaging, no spin-flop occurs in position 3. Instead, the local field falls below the applied field due to the stray field of the surrounding polarized regions as described above. Also included in Fig. 4 is the field dependence of sample-averaged . In an applied field of 1680 G the field caused by the magnetization is about 230 G. By solving the magneto-static surface integrals for a rectangular box with dimensions corresponding to our sample this field value can be converted into a magnetization of 12 which is in good agreement with the magnetometer measurement of 14 (Fig. 1b). Similarly, the jump height of 1000 G can be converted into a saturation magnetization of 53 which is about 25 % smaller than expected. This reduced value might be caused by a small gap between the sample surface and the magneto-optical film, typically several . This will lead to a reduction of the measured value for above a domain by an error that increases as the lateral size of the domain decreases. In addition a small, but finite closure angle between the Mn-moments in the spin-flop phase [6] would cause a further increase of M in high fields that is not accounted for in the jump height.
The results shown in Fig. 2 can be directly related to measurements of the anisotropic magneto-conductivity of [6]. The double exchange mechanism causes the intimate coupling of the electronic and magnetic state of this material. In particular, a high c-axis conductivity is correlated with a ferromagnetic spin-alignment along the -axis. Thus, the images shown in Fig. 2 can be seen as maps of the -axis conductivity. Correspondingly, the sharp local steps of the magnetization (Fig. 4) imply extremely sharp steps in the conductivity which offers the potential for a field controlled resistive switch. The in-plane transport occurs along a parallel circuit of ferromagnetic, highly conducting bi-layers in the antiferromagnetic and the fully polarized state. At the spin-flop transition, however, domain walls start appearing and cause a local reduction in . As suggested in Ref. [6] this mechanism gives a direct account of the minimum of observed near .
In conclusion, magnetic transitions in the antiferromagnetic state of were studied using a high-resolution magneto-optical imaging technique. We report the first direct observation of the formation of ferromagnetic domains appearing at the first order spin-flop transition. The magnetization process proceeds through nucleation of polarized domains at crystal defect sites, domain wall motion appears to be of minor significance, especially in the onset region of the transition. A small magnetic hysteresis is caused by the nucleation and annihilation of domains in the mixed state. These results establish a direct link between the magnetic structure on the atomic scale as seen in neutron scattering and the macroscopic properties of the sample as seen in magnetization and conductivity measurements.
This work was supported by the US DOE, BES - Materials Sciences under contract #W-31-109-ENG-38. We thank Qing’An Li and R. Osborn for helpful discussions.
REFERENCES
- [1] T. Kimura et al., Science 274, 1698 (1996).
- [2] M. Kubota et al., cond-mat/9902288.
- [3] M. Imada et al., Rev. Mod. Phys. 70, 1039 (1998); J. B. Goodenough et al., in ”Landolt - Börnstein” Vol. 4, part a, page 126.
- [4] T. Kimura et al., Phys. Rev. Lett.79, 3720 (1997).
- [5] T. G. Perring et al., Phys. Rev. B58, 14693 (1998); D. N. Argyriou et al., Phys. Rev. B59, 8695 (1999).
- [6] Qing’An Li et al., cond-mat/9903452.
- [7] J. F. Mitchell et al., Phys. Rev. B55, 63 (1997).
- [8] L. A. Dorosinskii et al., Physica C203; for a recent review see: V. K. Vlasko-Vlasov et al., NATO ASI School ”Physics and Materials Science of Vortex States, Flux Pinning and Dynamics”, Kusadasi, Turkey, July 26 - August 8, 1998.
- [9] S. D. Bader at al., J. Appl. Physics 83, 6385 (1998); C. D. Potter et al., Phys. Rev. B57, 72 (1998).
- [10] B. E. Keen et al., J. Appl. Physics 37, 1120 (1966); I. S. Jacob and P. E. Lawrence, Phys. Rev. 164, 866 (1967).
- [11] S. Rosenkranz et al., to be published; H. Fujioka et al., cond-mat/9902253. These experiments were performed on the x=0.4 - material which we consider a good estimate for the x=0.3 - compound.