[
On the 590 cm-1 B1g feature in underdoped Bi2Sr2CaCu2O8+δ
Abstract
Raman scattering studies have been performed on underdoped Bi2Sr2CaCu2O8+δ. In single crystals underdoped by oxygen removal, a 590 cm-1 peak is observed in the B1g spectrum. The feature is observed to soften in frequency by 3.8% with isotopic exchange of 16O by 18O. In contrast, the 590 cm-1 peak is not observed in crystals underdoped by Y substitution which suggests that it corresponds to a disorder induced vibrational mode. We have also found that underdoping leads to a depletion of low energy spectral weight from regions of the Fermi surface located near the Brillouin zone axes.
pacs:
PACS numbers: 74.25.Gz,74.25.Jb,74.25.Kc,74.62.Dh,74.72.Hs]
One of the interesting electronic properties of underdoped high temperature cuprate superconductors is the presence of a normal state pseudogap (PG) that appears [1] at a temperature T∗ which is well above the superconducting transition temperature Tc. Evidence for this electronic gap-like feature has been obtained using many different experimental techniques [1]. In particular, Angle Resolved Photoemission spectroscopy (ARPES) [2, 3, 4] and Electronic Raman Scattering (ERS) spectroscopy [5, 6, 7] measurements have provided direct evidence of a spectral weight depletion from regions of the Fermi surface near (,0) in underdoped cuprates. Raman scattering experiments have also been used [8, 9, 10, 11, 12] to probe the energy scale and temperature dependence of the pseudogap.
Theories of the cuprate pseudogap can be separated into two broad categories [13]. First there are those [14, 15] that associate the PG with some form of precursor superconductivity. In this case uncorrelated pairs can form at TTc, with phase coherence and hence superconductivity occuring at Tc. The magnitudes of the PG (Eg) and superconducting gap () should thus be equal, and furthermore they should have the same symmetry. Thus there should be a smooth evolution from PG to superconducting gap (SCG) as the temperature is lowered through Tc. In a second category of theories the loss of spectral weight associated with the PG is attributed to short range magnetic correlations [16, 17], or magnetic pairing of some sort [18, 19]. In this case the magnitude of the PG should be determined by the antiferromagnetic exchange energy J, which in the cuprates is much larger than .
Both ERS and ARPES have produced [1] similar results for the magnitude () and symmetry () of the superconducting gap in optimally doped cuprates. In underdoped materials, ARPES measurements [1, 2, 3, 4] on Bi2Sr2CaCu2O8+δ (Bi2212) suggest that the pseudogap evolves continuously into the SCG and thus has magnitude and symmetry. The ARPES results are supported by the Raman measurements of Blumberg et al [11, 12] who attributed a weak peak, with frequency in the B1g spectrum of underdoped Bi2212 to the formation of a bound state, associated with precursor pairing of quasiparticles above Tc. However, these results are in direct contrast to other Raman studies [5, 6, 7, 8, 9] which conclude that the pseudogap does not have symmetry and has a magnitude , where J is the antiferromagnetic exchange constant.
Given the potential significance of the peak near 600 cm-1 we sought to determine whether the excitation was affected by 18O substitution. We have carried out experiments on two pairs (Tc = 51K, 82K) of underdoped samples of Bi2212, one containing the 18O isotope and the other 16O. While confirming the expected shift of previously identified oxygen-related phonons we have also found that the 590 cm-1 B1g mode shifts with 18O substitution. This result, combined with experiments on Y-doped Bi2212 have led us to conclude that the 590 cm-1 mode is more appropriately assigned to an oxygen deficency related vibration.
Through oxygen exchange methods 16O and 18O single crystals of Bi2212 were prepared with similar Tc’s in the underdoped regime. Fully exchanged and underdoped 18O samples were prepared by completing the following steps. A sample of 16O-Bi2212 was first annealed in vacuum at 500oC for four hours. The ampoule containing the sample was then evacuated again and backfilled with 18O to a pressure of less than one atmosphere. The sample was then annealed in the 18O atmosphere for twenty-four hours at 850oC after which it was gradually cooled over a period of 15 hours to a temperature of 300oC. Then oxygen was unloaded by the following procedure. The ampoule was evacuated, then annealed at 500oC, cooled to 350oC and quenched to room temperature. The 18O samples exhibit a magnetically determined superconducting onset temperature of 51K. An unexchanged sample, 16O Bi2212, was also prepared using the same final unloading anneal, and exhibited a superconducting onset temperature of 51K.
The second method of underdoping relies on the use of cation substitution methods. In this case the substitution of trivalent yttrium () for divalent calcium () reduces the hole concentration in Bi2212. Adding Y causes Tc to fall [20], and yields a non-superconducting compound at a Y content of 0.50 [21]. Single crystals of Y-doped Bi2212 were prepared as described elsewhere [20]. In the crystals studied Electron Dispersive X-ray (EDX) analysis revealed a yttrium content of 0.40 and 0.07, with superconducting transition temperatures of 30 K and 70 K, respectively.
Raman vibrational spectra in the frequency range 20 - 1000 cm-1 were obtained using the 5145 and 4880 Å lines of an argon ion (Ar+) laser as the excitation source. The Raman measurements were carried out in a quasi-backscattering geometry, with the incident laser beam directed perpendicular to the freshly cleaved (a,b) face of the crystal.
Bi2212 has an orthorhombic structure with the a and b axes oriented at 45o to the Cu-O bonds. In Raman experiments it is customary to assume a tetragonal structure with axes parallel to a and b. To facilitate comparison with other cuprates, however, we will consider a tetragonal cell with x and y axes parallel to the Cu-O bonds. Another set of axes, x’ and y’ are rotated by 45o with respect to the Cu-O bonds. The x’y’ (B1g) scattering geometry means that the incident(scattered) light is polarized along x’(y’) and selection of this scattering channel enables coupling to excitations having B1g symmetry. Similarly, the xy geometry allows coupling to B2g excitations, which transforms as dxy. Finally, the diagonal scattering geometry x’x’ allows coupling to A1g + B2g and xx to A1g + B1g excitations. Thus, by choosing the polarization of the incident and scattered light one may select different components of the Raman tensor and thus various symmetry properties of the excitations.
Fig. 1 shows the B1g (x’y’) and (A1g + B2g) (x’x’) Raman response functions of the underdoped 18O and 16O crystal, taken at room temperature and at T = 17K.
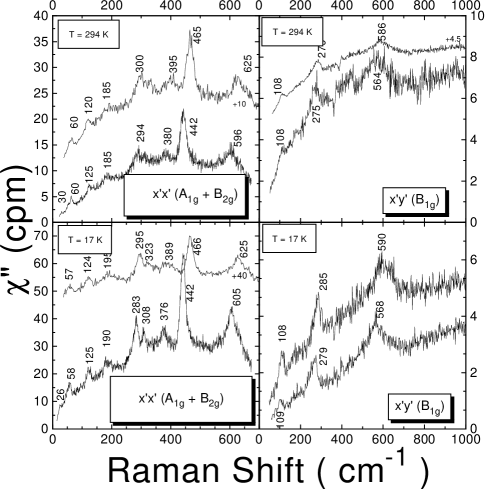
The observed spectral features may be separated into two categories, modes unaffected by 18O substitution and modes softened by 18O substitution. The low frequency ( cm-1) modes are unaffected by 18O substitution while modes above this frequency show a decrease in frequency. The heavy metal ion (Bi,Sr) modes have low frequencies and, consistent with our observation, should be unaffected by 18O substitution.
In the B1g geometry, the 285 cm-1 mode shows a softening of -2.1% while the low frequency mode at 108 cm-1 shows no shift at all, consistent with the results of other isotope studies [22, 23]. The 285 cm-1 mode has been assigned to out-of-phase vibrations of oxygens in the CuO2 plane, while the 108 cm-1 mode has been assigned to b-axis vibrations of Bi [24].
With 18O exchange the 590 cm-1 feature observed in B1g softens in frequency by 3.8%, from 590 to 568 cm-1(Fig. 1). Also, relative to the continuous background, the intensity of the feature increases with decreasing temperature. We found little change in these parameters with varying laser wavelength, at 514.5 nm and 488.0 nm. Identical results were obtained for the frequencies and isotope shift in the second pair (Tc = 82K) of underdoped crystals.
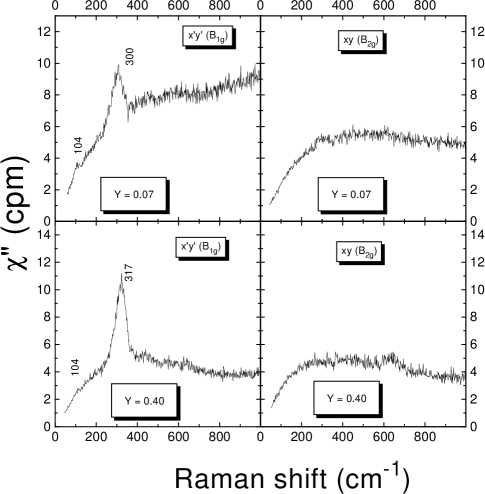
Since the 590 cm-1 B1g feature is only observed in underdoped crystals, and since the mass dependence is consistent with an oxygen related vibration, we sought to determine whether underdoping without a corresponding reduction in affects the properties of the mode. This was achieved by substitution of Y3+ for Ca2+. As shown in Fig. 2 , for a [Y] = 0.4 and 0.07, the 590 cm-1 mode is completely absent from the B1g spectra, as found by Kendziora [25] for a another underdoped crystal ([Y] = 0.15). This result implies that the 590 cm-1 B1g mode is associated with oxygen removal, and is thus expected to be related to an oxygen deficency type of vibration.
To speculate on the origin of the 590 cm-1 mode one can first note that there appears to be an analogous situation in Y123. In Y123, a mode appears [26, 27] in the B1g channel at about 600 cm-1 when the oxygen concentration is reduced below its optimum value of x 6.95. In this case underdoping is associated with oxygen removal from the chains and the creation of chain fragments. Thus many oxygen atoms in the chains are no longer situated at centers of inversion and previously forbidden modes can become Raman active. In the case of Bi2212 one can note that the Bi-O layers are weakly bonded to one another and oxygen intercalation or exchange takes place in these planes[23, 28]. There is also an incommensurate structural modulation along the b-axis in the Bi-O planes [28] that results from oxygen non-stoichiometry and a lattice mismatch between the Bi-O rocksalt layers and the perovskite layers. The removal of oxygen from Bi2212 should thus give rise to the formation of buckled Bi-O modulation chain fragments, and hence to disorder that would lead to the activation of normally Raman forbidden modes. Thus one might speculate that the 590 cm-1 mode in Bi2212 results from b-axis stretching vibrations of oxygen atoms in the Bi-O layer. The buckling associated with the modulation could lead to a broadening of the mode, consistent with observation.
In previous experiments on Y123 [6] and La214 [7] it was found that underdoping led to a reduction of the scattering intensity in the B1g channel. In other words spectral weight was lost from regions of the Fermi surface located near (,0) and symmetry related points. The present spectra suggest that a similar depletion occurs in underdoped Bi2212.
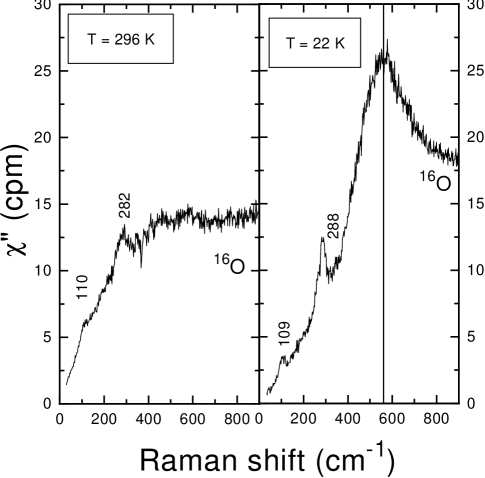
In the optimally doped material (Fig. 3) the continuum in the B1g spectrum is characterized by a count rate of approximately 15 cpm (T=296K) and a strong superconductivity induced renormalization is observed when the sample is cooled through Tc.
In the underdoped compound with Tc = 51K the strength of the B1g spectrum is reduced to about 4 cpm (Fig. 1). In the Y substituted compounds (Fig. 2), for the sample with [Y] = .07 (Tc 70K), and for [Y] = 0.4 (Tc 30K) one has . One can also note that there is no B1g renormalization at Tc for the underdoped compounds.
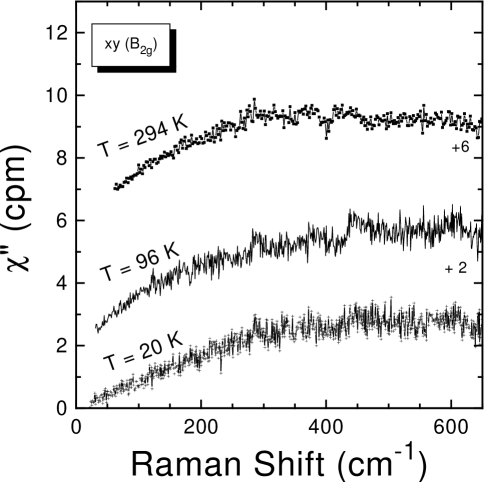
In the channel the strength of the spectrum (Fig. 2) is approximately the same for both Y doped compounds and is given by . In the 18O-Bi2212 crystal the spectrum (Fig 4) also has . It is interesting to note that there does not appear to be a well-defined renormalization of the B2g spectrum at Tc.
We have determined the ratio for the above compounds and find that it decreases by about a factor of four as the doping level is decreased from optimum (Tc= 90K) to the lowest value examined here (Tc= 40K). A corresponding hole concentration can be estimated [29] from, . The magnitude and rate of decrease in R is similar to the Bi2212 results of Opel et al[9] and to values found for Y123 [6] and La214 [7]. Since is approximately independant of doping, the decrease in R is attributed to a depletion of spectral weight in the B1g channel.
Since the decrease in strength of the Bi2212 B1g spectrum with decreasing doping is similar to that observed in Y123 and La214, we suggest that the depletion of B1g spectral weight in underdoped compounds is a characteristic feature of the cuprates. The depletion is attributed [6, 7] to the existence of a pseudogap of magnitude E that is localized near (,0). As the doping level is decreased more and more of the Fermi surface becomes depleted. Or, from another perspective, the Fermi surface in underdoped compounds appears to consist of arcs centered near the diagonal directions in k-space. Our results thus suggest that the lengths of the arcs decreases with decreasing doping [7]. One can also see (Fig. 1) that, at low energies, decreases with temperature, as observed [10] previously in Bi2212.
In conclusion, the 590 cm-1 B1g mode is found in the Raman spectra of Bi2212 in which underdoping is achieved by the process of oxygen depletion. This mode is absent in spectra obtained from crystals in which underdoping is achieved by cation substitution. The mode softens by -3.8% with 18O substitution. Based on these observations we conclude that the 590 cm-1 feature is vibrational in origin and not associated with pseudogap formation. However, in this regard, underdoping of Bi2212 leads to a depletion of spectral weight from regions of the Fermi surface near (,0). The strength of this depletion is consistent with that observed in other cuprates.
We would like to thank the Natural Sciences and Engineering Research Council of Canada for financial support, and T. P. Devereaux, R. G. Buckley and J. L. Tallon for useful discussions.
REFERENCES
- [1] T. Timusk and B. Statt, to appear in Reports in Progress in Physics (unpublished).
- [2] D. S. Marshall et al., Phys. Rev. Lett 76, 4841 (1996).
- [3] J. M. Harris et al., Phys. Rev. B 54, R15665 (1996).
- [4] H. Ding et al., Nature 382, 51 (1996).
- [5] X. K. Chen et al., Phys. Rev. B 56, R513 (1997).
- [6] X. K. Chen et al., J. Phys. Chem. Solids 59, 1968 (1998).
- [7] J. G. Naeini et al., Phys. Rev. B 59, 1 April 1999 (unpublished).
- [8] R. Nemetschek et al., Phys. Rev. Lett 78, 4837 (1997).
- [9] M. Opel et al., J. Phys. Chem. Solids 59, 1942 (1998).
- [10] J. W. Quilty, H. J. Trodahl, and D. M. Pooke, Phys. Rev. B 57, R11097 (1998).
- [11] G. Blumberg et al., J. Phys. Chem. Solids 59, 1932 (1998).
- [12] G. Blumberg et al., Science 278, 1427 (1997).
- [13] J. Maly, B. Janko, and K. Levin, cond-mat/9805018 (unpublished).
- [14] V. J. Emery and S. A. Kivelson, Nature 374, 434 (1995).
- [15] V. J. Emery, S. A. Kivelson, and O. Zachar, Phys. Rev. B 56, 6120 (1997).
- [16] J. M. Wheatley, T. S. Hsu, and P. W. Anderson, Phys. Rev. B 37, 5897 (1988).
- [17] N. Nagaosa and P. A. Lee, Phys. Rev. Lett 64, 2450 (1990).
- [18] D. Pines, Physica C 282-287, 273 (1997).
- [19] D. Pines, Z. Phys. B 103, 129 (1997).
- [20] N. L. Wang, B. Buschinger, C. Geibel, and F. Steglich, Phys. Rev. B 54, 7445 (1996).
- [21] M. Kakihana et al., Phys. Rev. B 53, 11796 (1996).
- [22] A. A. Martin and M. J. G. Lee, Physica C 254, 222 (1995).
- [23] A. E. Pantoja, D. M. Pooke, H. J. Trodahl, and J. C. Irwin, Phys. Rev. B 58, 5219 (1998).
- [24] R. Liu, M. V. Klein, P. D. Han, and D. A. Payne, Phys. Rev. B 45, 7392 (1992).
- [25] C. Kendziora, J. Phys. Chem. Solids 59, 1991 (1998).
- [26] V. G. Hadjiev et al., Solid St. Comm 80, 643 (1991).
- [27] V. G. Ivanov, M. N. Iliev, and C. Thomsen, Phys. Rev. B 52, 13652 (1995).
- [28] S. T. Johnson, P. D. Hatton, A. J. S. Chowdury, and B. M. Wanklyn, Solid St. Comm 94, 261 (1995).
- [29] J. L. Tallon et al., Phys. Rev. B 51, 12911 (1995).