-
† Institute of Metal Physics, Russian Academy of Sciences, Ural Division
620219 Ekaterinburg GSP-170, Russia
-
‡ University of Osnabrück, Fachbereich Physik, D-49069 Osnabrück, Germany
-
§ Department of Crystallography, Faculty of Geology, Moscow State University, 119899 Moscow, Russia
X-ray photoelectron 3s spectra of transition metal oxides
Abstract
We present metal 3s x-ray photoelectron spectra of different transition metal oxides. The values of the 3s exchange splitting for the 3d metal oxides are given as a function of the 3d electron number in the ground state. The spectra were analysed using the simple two-configuration model of the interatomic configuration mixing. The change of the 3s spectra is ascribed to the change of the charge-transfer energy.
pacs:
79.60, 71.701 Introduction
The spectral splitting of 3s core-level x-ray photoemission spectra (XPS) in transition metals and their compounds originates from the exchange coupling between the 3s hole and the 3d electrons and was experimentally observed about three decades ago [1, 2, 3, 4, 5]. The magnitude of the 3s spectral splitting according to the van Vleck theorem [6] is determined by
| (1) |
where is the total spin of the ground state of the 3d electrons, is the orbital quantum number () and (3s,3d) is the Slater exchange integral. For 3d metal compounds, the calculated 3s splitting is more than two times larger than the observed one. It indicates that the observed 3s splitting is not likely to be due to the spin exchange only. This fact was explained by the intra-shell correlation effects between 3s13p63dn and 3s23p43dn+1 configurations [7, 8].
This scheme does not take into account the effect of a core-hole screening in the final state of photoemission. The final-state screening gives satellites in the x-ray photoelectron core-level spectra whereas ”main peaks” usually correspond to final states with an extra 3d electron in comparison with the ground state. Veal and Paulikas [9] proposed that the 3s splitting is determined by the exchange interaction in the 3s13dn+1 configuration rather than in the 3s13dn configuration. Kinsinger et al [10] have shown that the model of Veal and Paulikas is correct for Ni and Cu compounds but fails for d-electron numbers of less than 6.
Oh et al [11] discussed the spectral shape of the 3s XPS for Fe and Mn di-halides, taking into account the intra-atomic configuration interaction in a phenomenological manner. They proposed that the interpretation of 3s core-level spectra should be consistent with that of the 2p spectra. In this case, the 3s splitting reflects the local moment of the ground state only when the charge-transfer satellite in the 2p core-level spectra is negligible.
Okada and Kotani [12] theoretically investigated 2p and 3s core-level spectra in late 3d transition metal di-halides and monoxides in terms of a cluster model. It was found that the hybridization with high-order charge-transfer states can reduce the multiplet splitting of a spectrum. The calculations of the 3s spectra of CrF2, MnF2 FeF2 and Cr2O3 were carried out, and the importance of covalency in the final states of XPS was noted [13, 14].
In this paper, we present new experimental data on the 3s splitting in 3d monoxides, Li-substituted oxides and CuGeO3. The values of the 3s exchange splitting for LaMnO3, SrMnO3, SrFeO3 and CuFeO2 are present too. We show that for the late 3d metal oxides (CuO, CuGeO3, NiO, CoO, FeO)the exchange splitting can be seen for both, the 3s13dn+1L and the 3s13dn configuration. For earlier 3d metal monoxides and Li-substituted oxides, the value of the exchange splitting correlates well with that predicted for the 3s13dn configuration. This effect is explained on the basis of a simple configuration-mixing model. For LiCoO2 with the 3d6 ground-state configuration () no exchange splitting is fixed.
2 Experimental conditions
The experiments were performed using a PHI 5600 ci multitechnique system. radiation was monochromatized by a double-focusing monochromator giving a spot diameter of 0.8 mm at the sample position. Electrons were analyzed from an area of 0.4 mm in diameter. The energy resolution as determined at the Fermi level of an Au-foil was 0.3–0.4 eV. All spectra were calibrated using an Au-foil with (4f eV. All samples were cleaved in vacuo at a base pressure of Torr. For CuO, NiO, CoO, FeO, MnO and CuGeO3 single crystals have been used. The lithium-substituted samples (LiCoO2, LiMnO2, Li2MnO3, LiFeO2 and LiCrO2), manganites (LaMnO3, SrMnO3) and SrFeO3 have been prepared using a ceramic technology [15, 16].
3 Results and discussion
The 3s spectra of the 3d monoxides MnO, FeO, CoO, NiO and CuO are shown in figure 1. The 3s spectrum of MnO shows two sharp peaks, labelled and , and a satellite at about 6 eV from the peak . For FeO, the peaks are wider, and for the late metal oxides, CoO and NiO, the metal 3s spectra exhibit a complex structure (peaks , , and ). In the case of CuO, three peaks (, and ) can be distinguished.
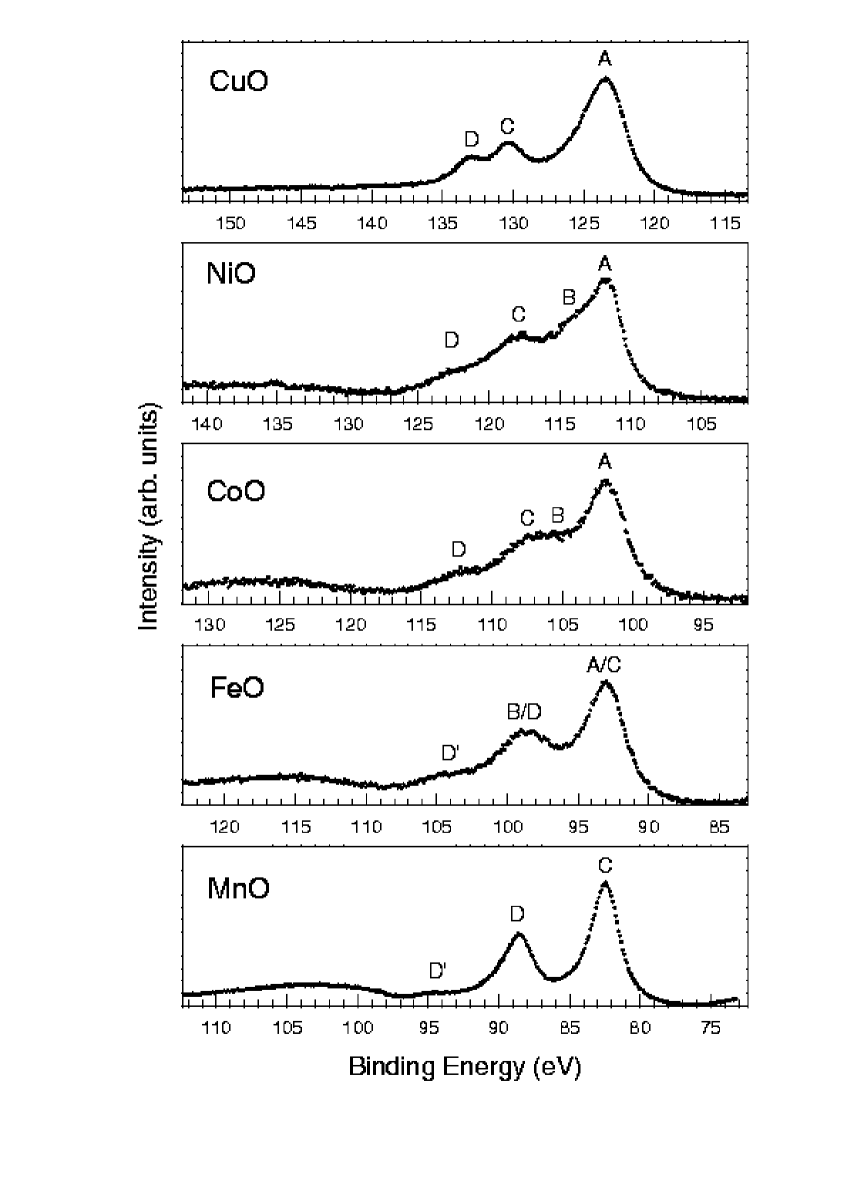
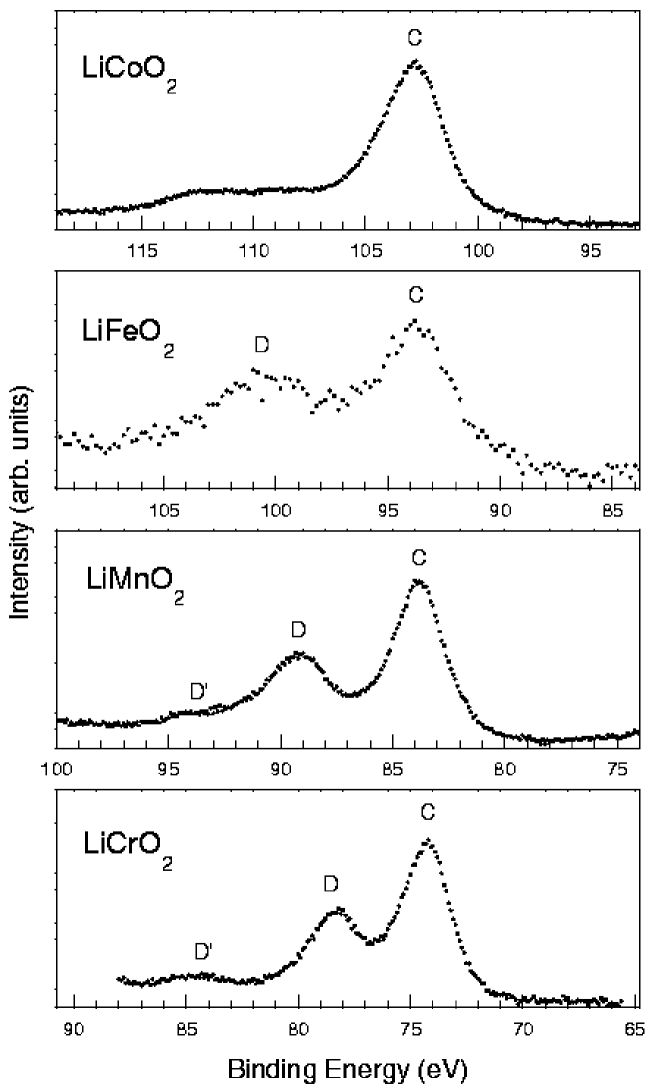
Figure 2 shows the x-ray photoelectron 3s spectra of lithium-substituted oxides LiCoO2, LiFeO2, LiMnO2 and LiCrO2. The spectra of LiFeO2, LiMnO2 and LiCrO2 show the peaks and , and the satellite . The spectrum of LiCoO2 shows one sharp peak at the binding energy 103 eV and the satellite structure extended from about 107 to 115 eV.
The peaks and in the MnO, LiFeO2, LiMnO2 and LiCrO2 spectra can be explained by the exchange splitting in the 3s13dn final state configurations. For CoO and NiO, four peaks ar due to the exchange splitting of 3s13dn and 3s13dn+1L final-state configurations with for NiO and for CoO. One can suggest that the peaks and arise mainly from exchange splitting in the 3d13dn+1L configurations, and the peaks and belong to the 3s13dn configurations. In the case of FeO we cannot attribute a peak to a certain configuration, since each of the peaks is a mixture of different configurations.
For CuO, the exchange splitting can be expected for the 3s13d9 configuration only. Consequently three peaks, marked , and , are found. The peaks and at energies 130 and 133 eV are high-spin and low-spin states of the 3s13d9 configuration, respectively. A single peak with the binding energy 123.4 eV arises due to the 3s13d10L final states.
The Co3+ ground state of LiCoO2 can be written as a low-spin tt state with . The non-magnetic character of Co3+ ions in LiCoO2 has been found by Bongers [19]. In this situation no exchange splitting should be expected for the Co 3s spectra in LiCoO2.

According to equation (1), the 3s energy splitting depends on both, the Slater exchange integral (3s,3d) and the total spin S of the 3d electrons in the ground state. Figure 3 shows the Slater exchange integral calculated for free neutral atoms, monovalent, divalent, trivalent and tetravalent ions. Note that for , the size of the splitting is not determined by equation (1), since the energies for both final states are equal to zero:
| (2) |
The calculated splitting of the 3s states for 3d transition-metal ions is much larger than observed. Bagus et al [7] explained the small measured splitting by an interaction between the 3s13p63dn and 3s23p43dn+1 configurations along with the electron correlation in the final core-hole states. In order to compare the calculated with the experimental energy splitting, we reduced the calculated value by about 50%, based on the comparison of the calculated splitting for a neutral Mn atom with the measured one for Mn in the gas phase [17]. The measured value of the Mn 3s splitting for Mn atoms is 6.5 eV whereas the calculated one is 12.2 eV.
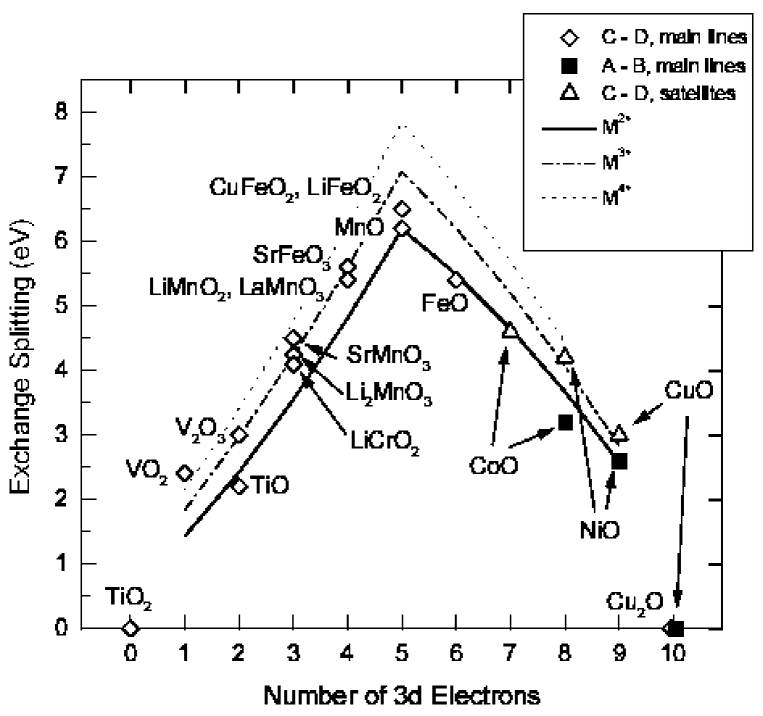
In figure 4 we show the measured exchange splitting of the 3s core levels, as a function of the 3d electrons in the ground state. The lines give the magnitude of the spectral splitting calculated for divalent, trivalent and tetravalent ions, reduced by 50 %. The experimental data present compounds with monovalent (Cu2O), divalent (TiO, MnO, FeO, CoO, NiO and CuO), trivalent (V2O3, LiCrO2, LiMnO2, LaMnO3, LiFeO2, CuFeO2 [18]) and tetravalent (TiO2 and VO2) 3d ions. The value for LiCoO2 is not shown here, since the ground state of this oxide is characterized by the low-spin configuration , whereas figure 4 is plotted for the oxides in the high-spin configurations.
The experimental data are divided into three groups. In the first group data are plotted for the early 3d monoxides (from TiO to MnO) and for some complex oxides (LiMnO2, Li2MnO3, LaMnO3, LiCrO2, LiFeO2, CuFeO2, SrMnO3, SrFeO3) based on the measurements of the spectral splitting between the and components. In the second group data are represented for the late 3d oxides (CoO, NiO and CuO) determined from the measured – spectral splitting. In the third group data are included deduced from the measured – lines for CoO, NiO and CuO. The latter data are plotted for 3d electron numbers increased by one. It is assumed that for the late transition-metal oxides the 3dn+1L ground state configuration is realized. For FeO, the estimated value of 5.4 eV is tentatively assigned to the first group data (spectral splitting between and peaks).
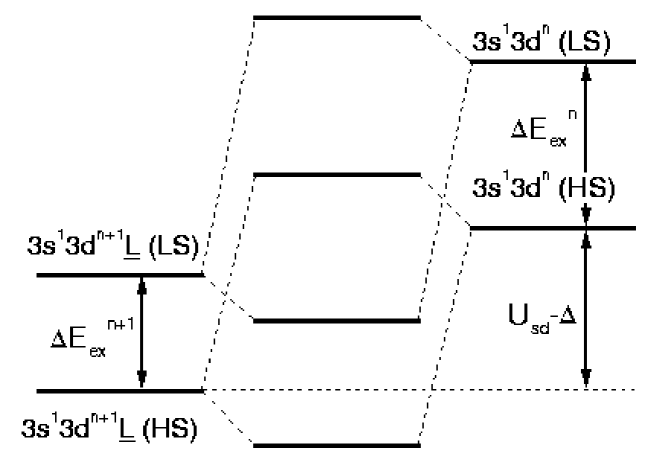
In this simple scheme it is assumed that the main 3s XPS peaks of the early 3d oxides originate from a 3s13dn final-state configuration, and those of the late 3d oxides from a 3s13dn+1L final-state configuration. In reality, both the 3s13dn and 3s13dn+1L state are present in the 3s spectra of both, the early and late 3d oxides. The quantitative estimation of the contributions of both configurations can be made on the basis of a model including the mixing of the 3s13dn and 3s13dn+1L final-state configurations. We demonstrate this in figure 5 for a model in which we consider two (high-spin and low-spin) 3s13dn states and two 3s13dn+1L states. Each of these states with the energy or mixes with the other with the same spin, this leads to the reduction of the multiplet splitting depending on the covalent mixing in the final state. This model is a two-level model employed separately to high-spin and low-spin states.
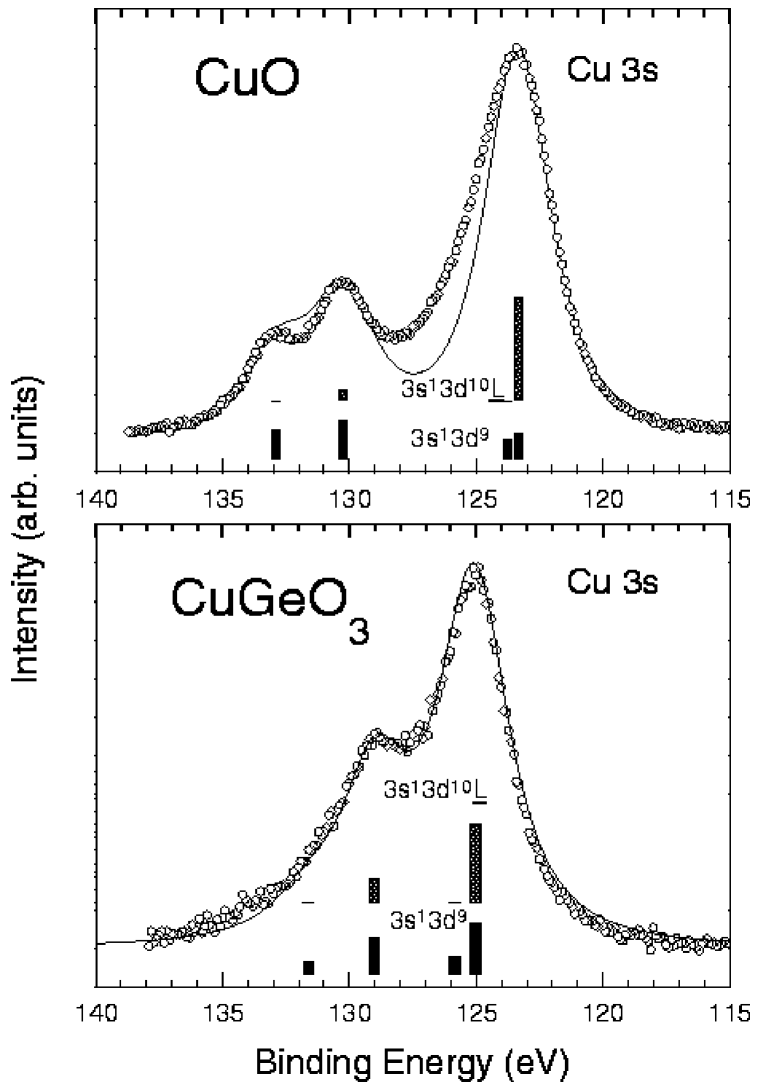
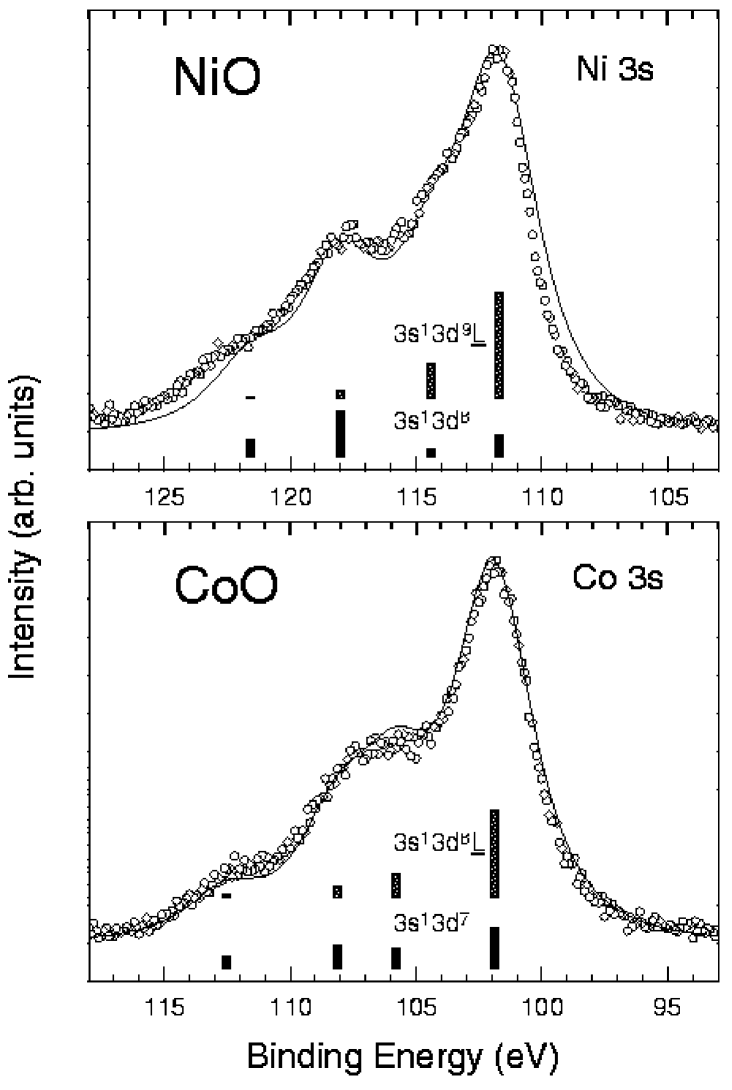
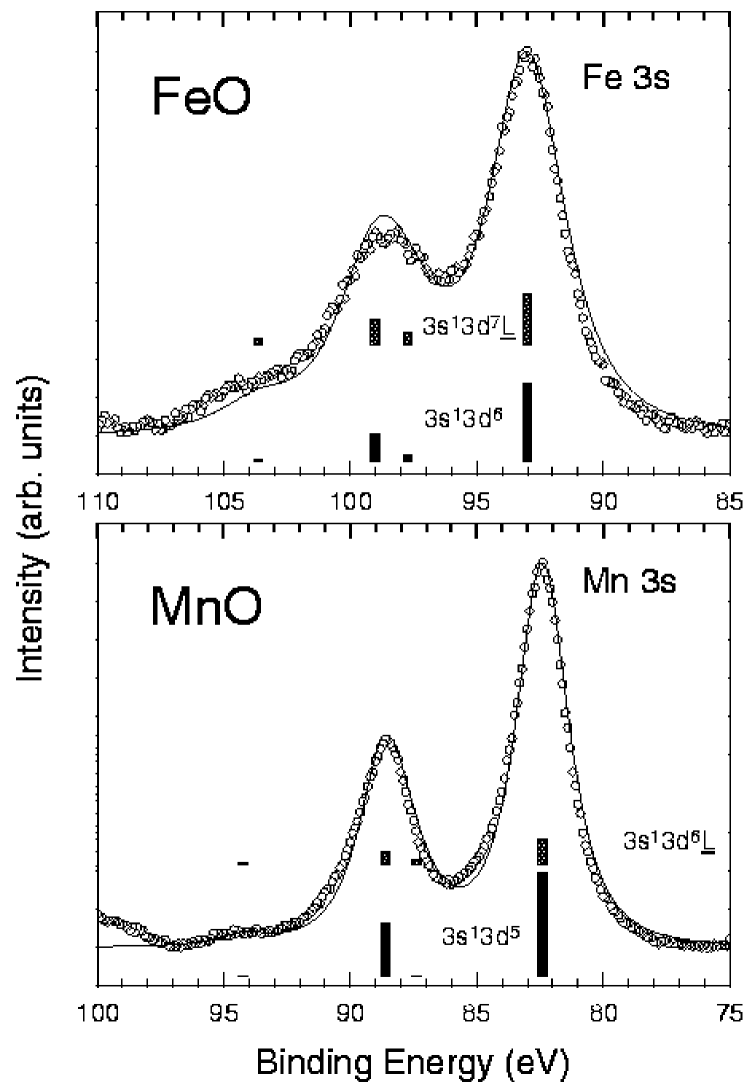
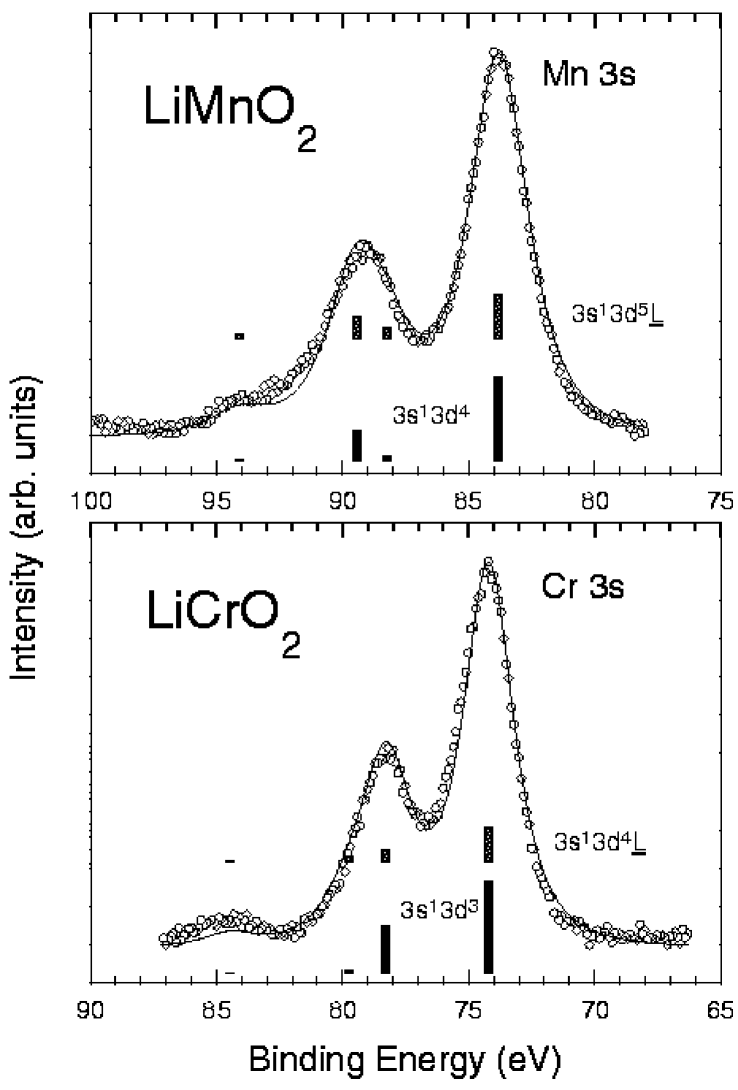
The calculated 3s spectra for CuO, CuGeO3, NiO, CoO, FeO, MnO, LiMnO2 and LiCrO2 are shown in the figures 6, 7, 8 and 9 together with the experimental data. The experimental spectra are corrected for the background arising due to secondary electrons. The parameters (the core-hole d electron Coulomb attraction energy), (the charge transfer energy) and (the transfer integral) used for the calculations are given in the table. The lower parts of the figures show 3s13dn and 3s13dn+1L contributions forming the main line and satellites, both in high-spin and low-spin configurations.
-
(eV) (eV) (eV) CuO 7.0 2.9 2.8 0.27 0.80 CuGeO3 7.0 6.0 2.0 0.08 0.62 NiO 6.5 2.4 2.4 0.28 0.83 CoO 6.0 4.0 2.9 0.22 0.68 FeO 5.8 6.8 2.3 0.09 0.39 MnO 5.0 8.0 2.0 0.05 0.20 LiMnO2 5.5 6.9 2.1 0.07 0.34 LiCrO2 5.0 7.9 2.5 0.08 0.28
One can see that the large parameter for CuGeO3 leads to a smaller distance between the main line and the satellite in comparison to CuO, which has the same valence state of copper ions (Cu2+) [21]. It is obvious, that the magnitude of the exchange splitting depends on the hybridization parameters. The large value reflects the strong ionic character of CuGeO3 with respect to CuO. Note, that in Ref. [21] the parameters were determined from Cu 2p core-level spectra on the basis of the Anderson Hamiltonian model in the impurity limit for CuO and CuGeO3 as 1.75 and 4.2 eV, respectively. They are lower than those calculated in our work. On the other hand, the value for CuO is in the range from 1.15 eV to 3.5 eV [22, 23, 24, 25], and the parameter for CuO, determined in our work, corresponds closely to these data.
The parameter increases on going from NiO to MnO. One can see that the main line of the Ni 3s spectrum for NiO is determined mainly by Ni 3s13d9L final states. For FeO, the contribution of 3s13d7L and 3s13d6 states are of about the same value, and for MnO, the main peak is determined by 3s13d5 states. For LiMnO2 the parameter is about 6.9 eV, similar to that of FeO. The LiCrO2 oxide is more ionic than LiMnO2, as can be seen from the comparison of the values .
For the LiCoO2, the satellite near the strong line can be explained by the exchange splitting of the s1d7L final-state configuration. Note, oxygen vacancies due to non-stoichiometry in LiCoO2-x can lead to an appearance of Co2+ ions, which should be visible in the 3s spectrum.
This simple two-level model allows to explain the 3s splitting of transition-metal oxides as a function of the number of 3d electrons in the ground state, as presented in figure 4. For the late 3d oxides, the final-state configuration is determined mainly by 3s13dn+1L well-screened states (). Therefore, the 3s spectra of the late oxides exhibit four peaks (or three peaks, as in the case of CuO). The final-state configurations of the early 3d oxides (the monoxides and complex oxides with trivalent and tetravalent 3d ions) are decribed mainly by poorly screened 3s13dn states. In this case, the spectra show two sharp peaks and a satellite. The satellite in the 3s spectra can be explained on the basis of the presented model.
We demonstrated the possibility to extract additional information about intra- and interatomic exchange effects from 3s core-level x-ray photoelectron spectra. One can see that the interaction between the high-spin and low-spin 3s13dn and 3s13dn+1L final-state configurations can lead to radical changes of the exchange splitting, in comparison with that predicted by the van Vleck theorem. Although the presented model does not take into account crystal-field effects and 3s13dn+2L2 configurations, it can explain all the experimental facts concerning 3s core-level spectra of 3d transition-metal oxides.
4 Conclusion
We have presented new experimental data on the 3s metal spectra of 3d transition-metal oxides. The 3s splitting of the 3d oxides can be well defined as a function of the 3d electron number in the ground state both for dn and dn+1L configurations. It was shown that the spectra can be analysed using the simple two-configuration model of the interatomic configuration mixing. The change of the 3s spectra is ascribed to the change of the charge-transfer energy.
Acknowledgments
This work was supported by the DFG-RFBR Rroject, the NATO Project (Grant No. HTECH.LG940861), the International Project ”Electron Structure of Oxides”, the Russian Foundation for Fundamental Research (Grant No. 96-15-96598), and the Deutsche Forschungsgemeinschaft through the Graduiertenkolleg ”Mikrostruktur oxidischer Kristalle” and the SFB 225.
References
References
- [1] Fadley C S, Shirley D A, Freeman A J, Bagus P S and Mallow J V 1969 Phys. Rev. Lett. 23 1397
- [2] Heldman J, Heden P F, Nordling C and Siegbahn K 1969 Phys. Lett. A 29 178
- [3] Fadley C S and Shirley D A 1970 Phys. Rev. A 2 1109
- [4] Carver J C, Schweitzer G K and Carlson T A 1972 J. Chem. Phys. 57 973
- [5] Wertheim G K, Hüfner S and Guggenheim H J 1973 Phys. Rev. B 7 556
- [6] van Vleck J H 1934 Phys. Rev. 45 405
- [7] Bagus P S, Freeman A J and Sasaki F 1973 Phys. Rev. Lett. 30 850
- [8] Viinikka E-K and Öhrn Y 1975 Phys. Rev. B 11 4168
- [9] Veal B W and Paulikas A P 1983 Phys. Rev. Lett. 51 1995
- [10] Kinsinger V, Sander I, Steiner P, Zimmermann R and Hüfner S 1990 Solid State Commun. 73 527
- [11] Oh S J, Gweon G H and Park J G 1992 Phys. Rev. Lett. 68 2850
- [12] Okada K and Kotani A 1992 J. Phys. Soc. Japan 61 4619
- [13] Okada K, Kotani A, Kinsinger V, Zimmermann R and Hüfner S 1994 J. Phys. Soc. Japan 63 2410
- [14] Uozumi T, Okada K, Kotani A, Zimmermann R, Steiner P, Hüfner S, Tezuka Y and Shin S 1997 J. Electron Spectrosc. Relat. Phenom. 83 9
- [15] Galakhov V R, Kurmaev E Z, Uhlenbrock S, Neumann M, Kellerman D G and Gorshkov V S 1995 Solid State Commun. 95 347
- [16] Kellerman D G, Gorshkov V S, Zubkov V G, Perelyaev V A, Galakhov V R, Kurmaev E Z, Uhlenbrock S and Neumann M 1997 Russian J. Inorganic Chemistry 42 1012
- [17] Fadley C S 1988 Core-Level Spectroscopy in Condensed Systems ed J Kanamori and A Kotani (Berlin: Springer) p 236
- [18] Galakhov V R, Poteryaev A I, Kurmaev E Z, Anisimov V I, Bartkowski S, Neumann M, Lu Z W, Klein B M and Zhao Tong-Rong 1997 Phys. Rev. B 56 4584
- [19] Bongers P F 1957 PhD Thesis, University of Leiden, Leiden, The Netherlands
- [20] Uhlenbrock S, Mayer B and Neumann M (to be published).
- [21] Parmigiani F, Sangaletti L, Goldoni A, del Pennino U, Kim C, Shen Z-X, Revcolevschi A and Dhalènne G 1997 Phys. Rev. B 55 1459
- [22] Tjeng L H 1990 PhD Thesis, University of Groningen, Groningen, The Netherlands
- [23] Parlebas J C 1993 Phys. Status Solidi (b) 178 9
- [24] van Veenendaal M A and Sawatzky G A 1993 Phys. Rev. Lett. 70 2459
- [25] Zimmermann R 1996 PhD Thesis, Universität des Saarlandes, Saarbrücken, Germany
Appendix
The ground-state wave function can be written in the form
| (1) |
where . For the high spin-state configuration, the final-state wave function is written as
| (2) |
and the eigenvalues are
| (3) |
Here, is the charge transfer energy, is the core-hole electron Coulomb attraction energy, and is the transfer integral, defined as follows:
| (4) | |||
Let us define as the exchange energy for the final states and as the exchange energy for the states. In this case, the eigenvalues for the low-spin configuration are:
| (5) | |||||
Coefficients , , , are determined as follows: , , and , where
| (6) | |||||
| (7) |
For the high-spin configuration, the ratio of the intensity of the satellite to the main line is given (in the sudden approximation) by:
| (8) |
In order to calculate the intensities of the lines in the low-spin configuration, it is necessary to determine the contributions of both, the and configurations forming the main line and the satellite. The intensity of the main line for the low-spin state is
| (9) |
and for the satellite
| (10) |
Here, and are the values of the shell in the and the configurations, respectively. To take into account the – and – configuration interactions, we used coefficients and , respectively. Viinikka and Öhrn [8] showed that the configuration interaction leads to a splitting of the low-spin term into new lines at energies approximately – eV separated from the high-energy line. In consequence of this, the relative intensity of the main low-spin peak is lower than expected from the simple multiplicity ratio . For example, the calculated intensity ratio for the to states for Mn2+ ions is equal to 0.47 [8] which is lower than . The values and for MnO and CuO were determined from a comparison of experimental and calculated spectra, and for NiO, CoO and FeO they were estimated according to Ref. [8] (see table 1). The parameters for divalent compounds were taken from the paper of Okada and Kotani [12]. For trivalent compounds, LiMnO2 and LiCrO2, the values were taken according to [14]. We assumed that eV, where is is the electron Coulomb attraction energy.
The coefficient for CuO was taken as 2.2. This value cannot be explained by the interaction between the – configurations, since this interaction should lead to a decrease of the low-spin component intensity. The enhanced intensity of the peak at 133 eV can be explained if one takes into account crystal-field effects. The crystal field should lead to both, to an increase of the intensity of the low-spin peak and to an asymmetry of the main peak .
Note that the intensity of the term in the Mn spectrum of MnO increases due to a Mn shake satellite, which is situated at the same energy [20]. This leads to a virtual decrease of the relative intensity of the low-spin peak.
The solid curves are obtained by a convolution of the calculated line spectrum with the function
| (11) |
where is the energy of the lines corresponding to each of the configuration contribution, and is the intensity of the lines. The parameter is a value for the convolution. We have chosen this function for the convolution as it is an intermediate between the Lorentzian and Gaussian functions.