[
Observation of out-of-phase bilayer plasmons in YBa2Cu3O7-δ
Abstract
The temperature dependence of the -axis optical conductivity of optimally and overdoped YBa2Cu3Ox (=6.93 and 7) is reported in the far- (FIR) and mid-infrared (MIR) range. Below Tc we observe a transfer of spectral weight from the FIR not only to the condensate at =0, but also to a new peak in the MIR. This peak is naturally explained as a transverse out-of-phase bilayer plasmon by a model for which takes the layered crystal structure into account. With decreasing doping the plasmon shifts to lower frequencies and can be identified with the surprising and so far not understood FIR feature reported in underdoped bilayer cuprates.
]
After many years the discussion about the charge dynamics perpendicular to the CuO2 layers of the high Tc cuprates is still very controversial. The role attributed to interlayer hopping ranges from negligible to being the very origin of high Tc superconductivity[1]. There is no agreement about the relevant excitations nor about the dominant scattering mechanism. The -axis resistivity is much larger than predicted by band structure calculations. The anisotropy can be as large as and shows a strong temperature dependence, especially in the underdoped regime, which has been interpreted as an indication for non-Fermi liquid behavior and confinement[2]. This strong temperature dependence is due to two different regimes with d for and d for , with a crossover temperature T′ that decreases with increasing doping. There is some agreement as to the phenomenology that is described by a series of resistors[2, 3, 4], i.e., that different contributions have to be added, and that the sign change in d/dT is due to the different temperature dependence of the competing contributions. Overdoped YBa2Cu3Ox (YBCO) is often regarded as a remarkable exception, as is only about 50, and d for all . It is an important issue whether a sign change in d at low T is really absent or only hidden by Tc being larger than a possible T′, i.e., whether overdoped YBCO follows anisotropic three dimensional (3D) or rather 2D behavior.
The -axis optical conductivity of YBCO shows several remarkable features[5, 6, 7, 8, 9]: (1) It’s very low value compared to band structure calculations, reflecting the large . (2) A suppression of spectral weight at low frequencies already above Tc in underdoped samples referred to as the opening of a ’pseudogap’ (which agrees with the upturn in ). (3) The appearance of an intriguing broad ’bump’ in the FIR at low T in underdoped samples. (4) In overdoped YBCO, the spectral weight of the superconducting condensate is overestimated from as compared to microwave techniques[10].
In this letter we suggest that most of the above mentioned issues can be clarified by modelling the cuprates or in particular YBCO as a stack of coupled CuO2 layers with alternating weaker and stronger links. This multilayer model fits the measured data at all doping levels and at all temperatures. A similar model was proposed for the superconducting state by van der Marel and Tsvetkov[11]. A transverse optical plasmon was predicted. This model has been verified in SmLa0.8Sr0.2CuO4-δ[12]. We report the observation of this mode in the infrared spectrum of optimally and overdoped YBCO and propose a common origin with the above mentioned ’bump’ in underdoped YBCO.
Single crystals of YBa2Cu3Ox were grown using the recently developed BaZrO3 crucibles[13], which in contrast to other container materials do not pollute the resulting crystals. Crystals grown using this technique exhibit therefore a superior purity ( 99.995 at. %)[14]. The samples had typical dimensions of – mm2 in the -plane. The O concentration was fixed by annealing according to the calibration of Lindemer[15]. An O content of =7 was obtained by annealing for 400 h at 300∘C in 100 bar of high purity oxygen. Annealing in flowing oxygen at 517∘C for 260 h produced =6.93. Measurements of the ac-susceptibility indicate Tc=91 K for =6.93 and 87 K for =7. The width of the transitions were 0.2 K and 1 K, respectively. Polarized reflection measurements were carried out on a Fourier transform spectrometer between 50 and 3000 cm-1 for temperatures between 4 and 300 K. As a reference we used an in-situ evaporated Au film. Above 2000 cm-1 the spectra are almost T independent. The optical conductivity was calculated via a Kramers-Kronig analysis.
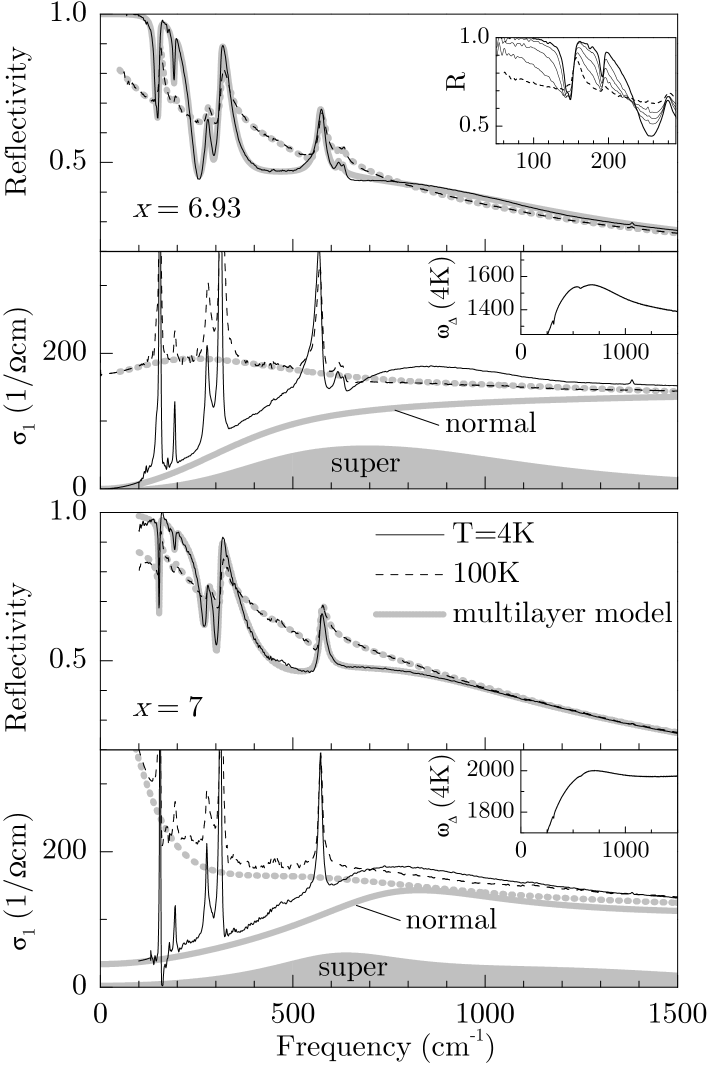
The measured -axis reflectivity and derived from it are plotted in Fig. 1 for 4 and 100K (solid and dashed black lines). Disregarding the phonons, shows an almost constant value of about 200 cm-1. A Drude-like upturn is only observed at low frequencies in the overdoped case =7. Below Tc a sharp reflectivity edge develops at about 300 cm-1 (inset of top panel), which had been identified as a Josephson plasmon, a collective mode in a stack of Josephson coupled 2D superconducting layers. The gradual suppression of below about 700 cm-1 can be attributed to the opening of the superconducting gap. The finiteness of at all frequencies reflects the -wave symmetry of the gap. The increase of between 700 and 1300 – 1500 cm-1 from 100 to 4 K comes as a surprise. The superconducting phase transition obeys case II coherence factors for electromagnetic absorption[16], i.e., only a suppression of is expected for frequencies not too close to 0. The difference of spectral weight above and below Tc defined as (for TTc):
| (1) |
is expected to rise monotonically with increasing frequency to a constant value for frequencies much larger than the gap. It is common practice to determine the spectral weight of the superconducting condensate from this constant value. However, in YBCO6.99 Homes et al.[10] reported a discrepancy between determined from either this optical sum rule ( cm-1) or the microwave surface reactance ( cm-1). To account for this difference the existence of a very narrow normal carrier Drude peak with a width smaller than the lowest measured frequency was concluded, which contradicts again the microwave measurements showing a very small [17]. Our data clearly indicate a non-monotonic behavior of (insets in Fig. 1, see also Ref. [7]) and a spectral weight transfer from low frequencies to a new peak above the phonons. This can naturally be explained by the following model for which takes into account the layered structure of the cuprates.
We devide the unit cell of YBCO into the intra- and inter-bilayer subcells and . Let us imagine, that a time dependent current is induced along the -direction, the time derivative of which is . We define as the time derivative of the voltage between two neighboring CuO2 layers, i.e., across subcell . Our multilayer model corresponds to the approximation, that the ratio is provided by a local linear response function corresponding to the complex impedance which depends only on the voltage variations on the neighboring CuO2 layers, and not on the voltages on layers further away. Microscopically this corresponds to the condition, that in the normal state the mean free path along must be shorter than the distance between the layers, . In the superconducting state this should be supplemented with the same condition for the coherence length along . In this sense, the multilayer model reflects the confinement of carriers in the 2D CuO2 layers. Let us treat the current as the parameter controlled by applying an external field. Since the current between the layers is now uniform and is independent of the subcell index , the electric field average over the unit cell is a linear superposition of the voltages over all subcells within the unit cell. This effectively corresponds to putting the complex impedances of subcells in series, , where the are the relative volume fractions of the two subcells, , and are the local impedance functions within subcells and . This sum for is very different from the case of a homogeneous medium, where different contributions are additive in , which corresponds to putting the various conducting channels of the medium in parallel. To illustrate this, let us adopt the Drude model for the complex interlayer impedance. In parallel conduction the sum of e.g. two Drude peaks yields
| (2) |
where denotes the plasma frequency, and labels the damping. This results in a single plasma resonance at a frequency , i.e., only one longitudinal mode (the zero) survives which is shifted with respect to the zeros of the individual components. The transverse mode (the pole at ) is identical. Putting two Drude oscillators in series in the multilayer model, i.e., using has a surprising consequence.
| (3) |
Now both longitudinal modes (poles of ) are unaffected, and in between a new transverse mode arises. This transverse optical plasmon can be regarded as an out-of-phase oscillation of the two individual components. This mode has been predicted in Ref. [11] for the case of a multilayer of Josephson coupled 2D superconducting layers. The existence of two longitudinal modes was confirmed experimentally in SmLa0.8Sr0.2CuO4-δ[12]. Note that superconductivity is not a necessary ingredient, the optical plasmon appears regardless of the damping of the individual components.
In order to apply the model to the measured reflectivity data we have to include the phonons, for which a separation into subcells is not generally justfied, e.g. for the -axis bending mode of the planar O ions, located on the border between subcells and . Therefore we adopt the following model impedance
| (4) |
where , and for YBCO. Note that this model reduces to the conventional expression for a homogeneous medium commonly used for high Tc superconductors if we either set or . The contain the purely electronic contributions with eigenfrequency within each subcell.
| (5) |
where and label the plasma frequencies of superconducting and normal carriers, respectively. All other contributions (phonons, MIR oscillators, etc.) are assumed to be identical in the two subcells and are included in a sum of Lorentz oscillators.
| (6) |
where denotes the -th peak frequency.
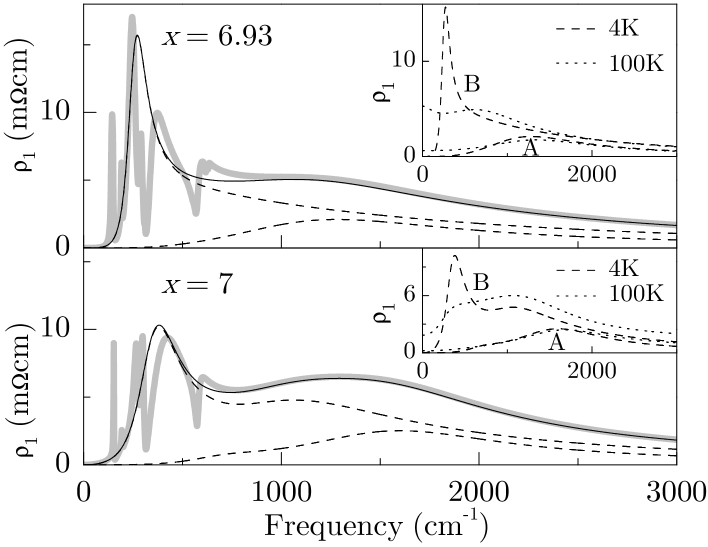
The agreement between the measured reflectivity data and fits using this model is very good at all temperatures (thick gray lines in Fig. 1). The strong MIR peak of the optical plasmon caused by the out-of-phase oscillation of the superconducting carriers in the two subcells is very well reproduced. Note that in a conventional Lorentz model the optical plasmon would have to be fit with three parameters , and . Also our model has three new parameters, namely the two sets of , and of Eq. 5 for the two subcells as compared to the single set used within a conventional two-fluid fit. In the case of =6.93 at 4 K we have , leaving only one new parameter . In Fig. 2 we plot the real part of the dynamical resistivity . The thick gray line was obtained from the full fit parameters and agrees with the Kramers-Kronig result. The solid line depicts the electronic contribution , which was obtained by leaving out the phonon part from the fit parameters in Eq. 4. In the multilayer model is the sum of the subcell contributions (, dashed lines), which shows that the two peaks in can be attributed to the plasmon peaks in the two subcells. Contrary to the conventional model, the different contributions are not strictly additive in due to the inverse summation in Eq. 4. Nevertheless we can calculate an estimate of the electronic contribution from the fit parameters in the same way as done for . An estimate of only the normal electronic contribution is obtained by leaving out the London terms together with . The contribution arising from the presence of superconducting carriers is then defined as (see Fig. 1).
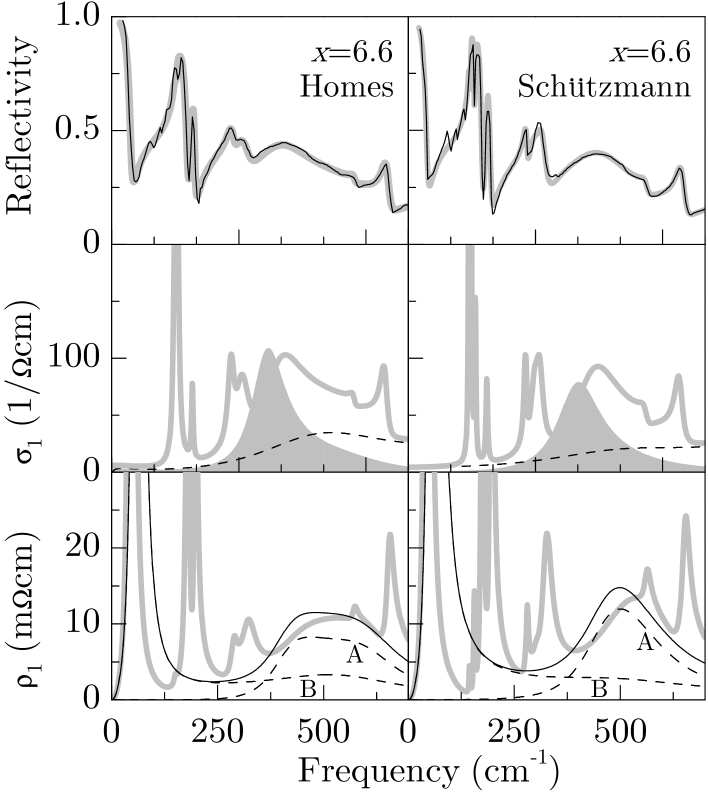
With decreasing doping level the absolute value of decreases and therefore the optical plasmon peak becomes sharper. At the same time, all plasma frequencies and hence also the optical plasma mode shift to lower frequencies. This scenario explains the strong FIR ’bump’ reported in underdoped YBCO[5, 6]. Similar bumps have been observed in other bilayer cuprates[18, 19], but never in a single layer material. This bump has hindered an unambiguous separation of electronic and phononic contributions to . In Fig. 3 we show reflectivity spectra of underdoped samples of YBCO taken from Refs. [5, 6] together with fits using the multilayer model. Again good agreement with the model is obtained. The strong phonon asymmetries present in the underdoped samples called for a fine tuning of the model: the two apical O stretching phonon modes at about 600 cm-1 were described by local oscillators in the inter-bilayer subcell , i.e., they moved in Eq. 4 from to . The figure demonstrates that this reproduces the asymmetry of the experimental phonon line shape well, although a Lorentz oscillator was used. Similar fine tuning has only a minor effect on the quality of the fit for the data presented in Fig. 1. Comparing the various doping levels shows that both the bending (350 cm-1) and the stretching (600 cm-1) phonon modes show strong assymetries whenever they overlap with the transverse plasma mode, but that both modes are symmetric if the transverse plasmon is far enough away, as e.g. in the case of =7. Previously it was argued that the phonon spectral weight is only conserved for different T if the bump is interpreted as a phonon[5]. However, a sum rule exists only for the total , not for the phonon part separately. Moreover, in this scenario the width of the bump, it’s temperature and doping dependence and the phonon asymmetries remained unexplained.
Both the low frequency Josephson plasmon and the bump are suppressed simultaneously by Zn substitution[8], which supports our assignment that both peaks are plasma modes. An increase of spectral weight of the bump with decreasing T was reported to start far above Tc[5, 6], but a distinct peak is only observed below Tc. We obtained good fits for all T (not shown). As mentioned above, superconductivity is not a necessary ingredient of the multilayer model, an out-of-phase motion of normal carriers will give rise to a peak at finite frequencies, too. Upon cooling below Tc, the reduction of the underlying electronic conductivity due to the opening of a gap and the reduced damping produce a distinct peak.
Our results imply that even the -axis transport between the two layers of a bilayer is incoherent, which agrees with the absence of a bilayer bonding-antibonding (BA) transition in our spectra. Using photo electron spectroscopy[20] a BA splitting of about 3000 cm-1 was reported. The anomalous broad photoemission lineshape may explain the absence thereof in the optical data.
In conclusion, we observed the out-of-phase bilayer plasmon predicted by the multilayer model. The good agreement of the optical data with the multilayer model at all temperatures and doping levels shows that YBCO can be modelled by local electrodynamics along the -axis in both the normal and the superconducting state. This applies even to overdoped YBCO, one of the least anisotropic cuprates. Our results strongly point towards a non-Fermi liquid picture and confinement of carriers to single CuO2 layers.
We gratefully acknowledge C. Bernhard and S. Tajima for helpful discussions. The project is supported by the Netherlands Foundation for Fundamental Research on Matter (FOM) with financial aid from the Nederlandse Organisatie voor Wetenschappelijk Onderzoek (NWO).
∗ Also P.N. Lebedev Physical Institute, Moscow.
REFERENCES
- [1] for a review, see S.L. Cooper, and K.E. Gray in Physical Properties of High Temperature Superconductors IV, ed. by D.M. Ginsberg (World Scientific, Singapore 1994).
- [2] P.W. Anderson , The Theory of Superconductivity in the High-Tc Cuprates (Princeton University Press, 1997).
- [3] Y.F. Yan et al., Phys. Rev. B 52, R751 (1995).
- [4] I. Terasaki et al., Phys. Rev. B 52, 16246 (1995).
- [5] C.C. Homes et al., Can. J. Phys. 73, 663 (1995).
- [6] J. Schützmann et al., Phys. Rev. B 52, 13665 (1995).
- [7] S. Tajima et al., Phys. Rev. B 55, 6051 (1997).
- [8] R. Hauff et al., Phys. Rev. Lett. 77, 4620 (1996).
- [9] C. Bernhard et al., Phys. Rev. Lett. 80, 1762 (1998).
- [10] C.C. Homes et al., Physica C 296, 230 (1998).
- [11] D. van der Marel, and A. Tsvetkov, Czech. J. Phys. 46, 3165 (1996).
- [12] H. Shibata, T. Yamada, Phys. Rev. Lett. 81, 3519 (1998).
- [13] A. Erb, E. Walker, and R. Flükiger, Physica C 245, 245 (1995); ibid. 258, 9 (1996).
- [14] A. Erb et al., Physica C 282-87, 89 and 459 (1997).
- [15] T.B. Lindemer et al., J.Am. Ceram. Soc. 72, 1775 (1989).
- [16] M. Tinkham, Introduction to Superconductivity, 2nd edition (McGraw-Hill, New York,1983).
- [17] A. Hosseini et al., Phys. Rev. Lett. 81, 1298 (1998).
- [18] M. Reedyk et al., Phys. Rev. B 49, 15984 (1994).
- [19] D.N. Basov et al., Phys. Rev. B 50, 3511 (1994).
- [20] M.C.Schabel et al., Phys. Rev. B 57, 6090 (1998).