Anisotropic resistivity of the antiferromagnetic insulator Bi2Sr2ErCu2O8
Abstract
The anisotropic resistivities of Bi2Sr2Ca1-xErxCu2O8 single crystals were measured and analyzed from 4.2 to 500 K with special interest taken in the parent antiferromagnetic insulator with =1.0. Although the resistivity is semiconducting along both the in-plane and out-of-plane directions, the temperature dependences are found to be significantly different. As a result, the resistivity ratio for =1.0 exhibits a broad maximum near room temperature. The electric conduction in the parent antiferromagnetic insulators is different from that in other semiconductors, and is as unconventional as that in high-temperature superconductors.
[Anisotropic resistivity of Bi2Sr2ErCu2O8]
1 Introduction
Anisotropic transport properties in the normal state are one of the most striking features of high-temperature superconductors (HTSC’s) [1]. The metallic in-plane resistivity () accompanied by the non-metallic out-of-plane resistivity () enhances at low temperature () [2, 3], whereas is independent of for conventional metals. The enhancement of is often called ‘confinement’ [4], and can be a key to the elucidation of the mechanism of high-temperature superconductivity. We have studied the anisotropic transport properties of slightly overdoped YBa2Cu3Oy crystals [5, 6]. Although their resistivities and are both metallic, the anisotropy is difficult to understand within the Fermi liquid theory.
The next question is that of whether is anomalous for a parent antiferromagnetic (AF) insulator, whose resistivities and are semiconducting. To our knowledge, very little investigation has been done on . Thio et al. [7] have found that for La2CuO4 decreases with decreasing below 200 K, which is significantly incompatible with for HTSC’s. Since it does not saturate near 200 K, a higher-temperature measurement is needed.
For studying over a wide temperature range, Bi2Sr2CaCu2O8 (: rare-earth) is most suitable for the following reasons: (i) Oxygens for =0 are chemically stable up to 600 K in air where remains “-linear” [8]. (ii) When reduces from 1 to 0, the doping level varies from that of a parent AF insulator to that of a (slightly) overdoped superconductor [9]. (iii) All of the Cu sites are equivalent, and only the CuO2 plane is responsible for the electric conduction. Here we report on measurements and analyses of Bi2Sr2Ca1-xErxCu2O8 single crystals with =0, 0.1, 0.5, and 1.0. We have found that for a parent AF insulator (=1.0) is quite unique; it increases with below 100 K, takes a broad maximum near 300 K, and decreases above room temperature. This obviously indicates that a parent AF insulator exhibits a quite different conduction mechanism from conventional semiconductors.
| Nominal | Actual Composition | Size | -axis |
|---|---|---|---|
| Bi : Sr : Ca : Er : Cu | (mm3) | (Å) | |
| 0 | 1.9 : 1.9 : 1.2 : 0 : 2 | 0.610.02 | 30.85 |
| 0.1 | 1.6 : 1.8 : 1.2 : 0.1 : 2 | 11.20.02 | 30.90 |
| 0.5 | 1.6 : 1.9 : 1.0 : 0.5 : 2 | 110.004 | 30.32 |
| 1.0 | 2.0 : 2.1 : 0 : 0.6 : 2 | 11.20.004 | 30.33 |
2 Experimental
Single crystals of Bi2Sr2Ca1-xErxCu2O8 were grown by a self-flux method [10]. Powders of Bi2O3, SrCO3, CuO, CaCO3, and Er2O3 of 99.9 % purity were mixed, well ground in an Al2O3 crucible, heated at 900∘C [1020∘C] for 10 h, and slowly cooled down to 760∘C [820∘C] by 2∘C/h for =0 [0]. Since the single crystals were very thin along the axis, the thickness was measured with a scanning electron microscope (SEM). The actual compositions were measured through inductively coupled plasma emission spectroscopy. The x-ray diffraction pattern showed no trace of impurities, and the -axis lattice parameter for =0 was evaluated to be 30.85 Å, which agrees with the value in the literature [10, 11]. The measured compositions, sizes, and -axis lattice parameters are listed in table 1. We should note that crystals grown by a flux method are produced with little stress, owing to the slow cooling rate near thermal equilibrium. In fact, we did not observe any serious cracks in the SEM images of our samples. In order to examine the influence of inhomogeneity and disorder on the resistivity, we made measurements for more than 30 samples including ones grown from different batches. The measured resistivities were reproducible enough to warrant the discussion in this paper.
The resistivity was measured with a current in a four-probe configuration along the in-plane direction (), and in a ring configuration along the out-of-plane direction (). We used two measurement systems below and above room temperature. From 4.2 to 300 K, the samples were slowly (100 K/h) cooled in a liquid-He cryostat, where was monitored through a cernox resistance thermometer. Above 300 K, the samples are slowly (50-100 K/h) heated in air in a cylinder furnace with a Pt resistance thermometer.
3 Results and discussion
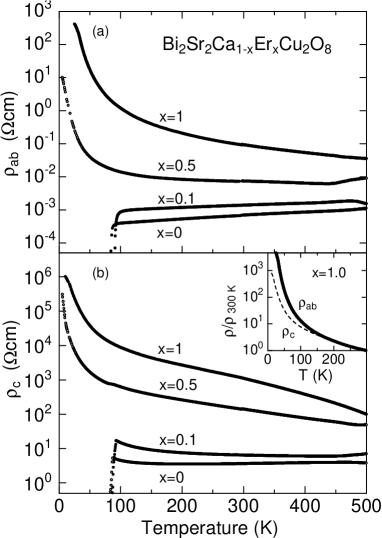
Figures 1(a) and 1(b) show and of Bi2Sr2Ca1-xErxCu2O8 single crystals, respectively. The magnitudes of and increase with , showing that the hole concentration is reduced by the Er substitution. As is seen in the literature, is four or five orders of magnitude lager than for all the samples. For superconducting samples (=0 and 0.1), metallic and semiconducting are observed above . Reflecting the slightly overdoped nature of =0, (84 K) for the =0 sample is lower than (87 K) for =0.1. These results attest to the quality of our crystals.
Both and for =1.0 are semiconducting, but they exhibit different dependences. Above room temperature, where decreases gradually in comparison with , decreases with increasing . On the other hand, becomes insulating more rapidly than , as shown in the inset of figure 1 where the resistivities are normalized at 300 K. Thus decreases with decreasing below 300 K. These results are not understandable on the basis of conventional theories. In the framework of a band picture, anisotropy is mainly determined by effective masses, implying that the dependence of is independent of the direction. In the case of a hole doped in the AF background, the situations are nearly the same. In fact, a nearly -independent has been observed for La2NiO4 [12] and BiCo2O9 (=Ca, Sr and Ba) [13].
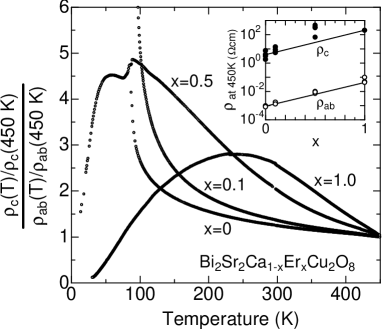
The magnitude of for a parent AF insulator is much more difficult to evaluate than that for a superconductor, in that it is an exponentially varying quantity divided by another exponentially varying quantity. Since we are interested in the dependence of , we normalize at 450 K in figure 2. As for the magnitude, we show and in the inset of figure 2, in which each symbol corresponds to a different sample. From the inset one can see that the magnitude of at 450 K is nearly independent of . Accordingly the normalization at 450 K will not adversely affect the discussion below.
We would like to point out three features in figure 2. First, changes smoothly with above room temperature; It increases with decreasing , and the dependence is steeper for larger (smaller hole concentration). If one looked at only above room temperature, one could not distinguish a parent AF insulator from a superconductor. Thus we may say that the holes are confined in a parent AF insulator as well as in HTSC. In this context the former is as unconventional as the latter. Secondly, for =1.0 and 0.5 decreases with decreasing below 100 K, which is consistent with of La2CuO4 [7]. The decrease of as 0 could be understood from the three-dimensional (3D) nature of the localization [14]. Thirdly, for =1.0 and 0.5 takes a maximum at a certain temperature , which is very close to the Néel temperature . (For =0.5, a tiny fraction of a superconducting phase causes a small drop of resistivity near 90 K, which obscures the position of .)
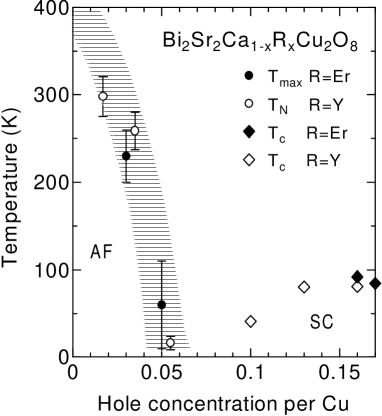
The localized spins of Er3+ make it difficult to measure of Cu2+ for =1.0 and 0.5. Instead, we will compare of Bi2Sr2Ca1-xYxCu2O8 [15], and we plot , and in the electronic phase diagram of Bi2Sr2CaCu2O8 in figure 3. We estimated the hole concentration using an empirical relation to the thermopower [16], which we measured with the same samples for =Er (not shown here), and used Ref. [17] for =Y. is found to lie around the AF boundary. Since no structural transitions and no phase separations are reported for Bi2Sr2CaCu2O8 [9], it would be natural to relate to the AF transition.
The confinement behavior above favors some theories based on the two-dimensional (2D) spin fluctuation, which exists in parent AF insulators above [18] and in HTSC’s above as well [19]. We therefore propose that holes are confined in a CuO2 plane in the presence of the 2D spin fluctuation, which occurs irrespective of doping levels. As the 3D AF order grows below , the confinement becomes less effective. A recent numerical analysis of the bilayer model has also led to the assertion that is substantially modified in the presence of the 2D spin fluctuation [20]. We further note that a similar case is seen for a layered ferromagnet La2-xSr1+xMn2O7 [21]. For 100 K 250 K, this compound is in a 2D ferromagnetic state, and exhibits a non-metallic together with a metallic . Once the 3D ferromagnetic order appears below 100 K, becomes metallic to behave in a 3D-like manner. We believe that the out-of-plane conduction in parent AF insulators includes essentially the same physics as for La2-xSr1+xMn2O7; the only difference is as regards whether the material is an antiferromagnetic insulator or a ferromagnetic metal.
4 Summary
We prepared Bi2Sr2Ca1-xErxCu2O8, single crystals for =0, 0.1, 0.5 and 1.0 and measured the in-plane and out-of-plane resistivities ( and ) from 4.2 to 500 K. The present study has revealed that for a parent antiferromagnetic insulator () strongly depends on temperature, and that the enhancement of with decreasing is observed above room temperature. In this sense, parent antiferromagnetic insulators are as unconventional as high-temperature superconductors. Their ratios take maxima at a certain temperature near the Néel temperature, and we propose that the confinement in the CuO2 plane is operative in the two-dimensional spin-fluctuation regime regardless of the doping level.
Acknowledgments
The authors would like to thank T Itoh, T Kawata, K Takahata and Y Iguchi for collaboration. They also wish to express their appreciation to S Kurihara and S Saito for fruitful discussions and valuable comments. One of the authors (I T) is indebted to S Tajima for the collaboration at a preliminary stage of this work. This work was partially supported by Waseda University Grant for Special Research Projects (97A-565, 98A-618).
References
References
- [1] For a recent review of the anisotropic charge dynamics, see Cooper S L and Gray K E 1994 Physical Properties of the High Temperature Superconductors IV, edited by Ginsberg D M (Singapore: World Scientific) p. 61
- [2] Takenaka K, Mizuhashi K, Takagi H and Uchida S 1994 Phys. Rev. B50 6534
- [3] Nakamura Y and Uchida S 1993 Phys. Rev. B47 8369
- [4] Anderson P W 1997 The Theory of Superconductivity in the High- Cuprates (Princeton: Princeton University Press)
- [5] Terasaki I, Sato Y, Miyamoto S, Tajima S and Tanaka S 1995 Phys. Rev. B52 16246
- [6] Terasaki I, Sato Y and Tajima S 1996 Phys. Rev. B55 15300
- [7] Thio T, Chen C Y, Freer B S, Gabbe D R, Jenssen H P, Kastner M A, Picone P J, Preyer N W and Birgeneau R J 1990 Phys. Rev. B41 231
- [8] Martin S, Fiory A T, Fleming R M, Schneemeyer L F and Waszczak J V 1988 Phys. Rev. Lett. 60 2194
- [9] Quitmann C, Andrich D A, Jarchow C, Fleuster M, Beschoten B, Güntherodt G, Moshchalkov V V, Mante G and Manzke R 1992 Phys. Rev. B46 11813
- [10] Kendziora C, Forro L, Mandrus D, Hartge J, Stephens P, Mihaly L, Reeder R, Moecher D, Rivers M and Sutton S 1992 Phys. Rev. B45 13025
- [11] Ilyushin A S, Shi L, Leonyuk L I, Mustafa B M, Nikanorova I A, Red’ko S V, Jia Y, Vetkin A G, Zhou G, Zubov I V 1993 J. Mater. Res. 8 1791
- [12] Rao C N R, Buttrey D J, Otsuka N, Ganguly P, Harrison H R, Sandberg C J and Honig J M 1984 J. Solid State. Chem. 51 266
- [13] Watanabe Y, Tui D C, Birminghem J T, Ong N P and Tarascon J M 1991 Phys. Rev. B43 3026
- [14] Shkolovskii B I 1977 Sov. Phys. Semicond. 11 1253
- [15] Nishida N, Okuma S, Miyatake H, Tamegai T, Iye Y, Yoshizaki R, Nishiyama K, Nagamine K, Kadono R and Brewer J H 1990 Physica C168 23
- [16] Obertelli S D, Cooper J R, and Tallon J L 1992 Phys. Rev. B46 14928
- [17] Mandrus D, Forro L, Kendziora C and Mihaly L 1991 Phys. Rev. B44 2418
- [18] Shirane G, Endoh Y, Birgeneau R J, Kastner M A, Hidaka Y, Oda M, Suzuki M and Murakami T 1987 Phys. Rev. Lett. 59 1613
- [19] Yamada K, Lee C H, Kurahashi K, Wada J, Wakimoto S, Ueki S, Kimura H, Endoh Y, Hosoya S, Shirane G, Birgeneau R J, Greven M, Kastner M A and Kim Y J 1998 Phys. Rev. B57 6165
- [20] Eder R, Ohta Y and Maekawa S 1995 Phys. Rev. B51 3265
- [21] Kimura T, Tomioka Y, Kuwahara H, Asamitsu A, Tamura M and Tokura Y 1996 Science 274 1698