Non-fermi-liquid single particle lineshape of the quasi-one-dimensional non-CDW metal Li0.9Mo6O17 : comparison to the Luttinger liquid
Abstract
We report the detailed non-Fermi liquid (NFL) lineshape of the dispersing excitation which defines the Fermi surface (FS) for quasi-one-dimensional Li0.9Mo6O17. The properties of Li0.9Mo6O17 strongly suggest that the NFL behavior has a purely electronic origin. Relative to the theoretical Luttinger liquid lineshape, we identify significant similarities, but also important differences.
pacs:
PACS numbers: 71.10.Pm, 71.18.+y, 79.60.-iA topic of high current interest and fundamental importance for condensed matter physics is the possible failure due to electron-electron interactions [2] of the Fermi liquid paradigm for metals. The paradigm lattice non-Fermi liquid (NFL) scenario for a metal is the Luttinger liquid (LL) behavior [3] of an interacting one-dimensional electron gas. The energy () and momentum (k) resolved single particle spectral function A(k,) for the dispersing excitation that defines the FS is much different for the LL than for a Fermi liquid [4, 5]. Since A(k,) can be measured by angle resolved photoemission spectroscopy (ARPES), there has been strong motivation for such studies of quasi-one-dimensional (q-1D) metals. An unfortunate complication for this line of research is that many q-1D metals display charge density wave (CDW) formation and that strong CDW fluctuations involving electron-phonon interactions above the CDW transition temperature can also cause A(k,) to have NFL behavior which in some ways resembles that of the LL [6, 7]. For example, both scenarios predict a substantial suppression of k-integrated spectral weight near EF, bringing ambiguity to the interpretation of pioneering angle integrated photoemission measurements [8, 9] which observed such a weight suppression, and to subsequent ARPES studies [10, 11] of dispersing lineshapes in q-1D CDW materials.
Thus far ARPES studies of non-CDW q-1D metals have not obtained dispersing lineshape data which could be compared meaningfully with many-body theories. Most of the non-CDW q-1D metals are organic and for these metals k-integrated weight suppression near EF occurs [9], but dispersing features have not been observed [12]. Li0.9Mo6O17 is a 3D material with bonding such that only q-1D bands define its FS. It is unusual as a q-1D inorganic metal which appears to be free of strong electron-phonon effects, as discussed further below, and which shows suppressed EF photoemission weight. An initial ARPES study [13] at 300K did not resolve individual valence band features but did observe for a single broad peak a general angle dependent shift and diminution of spectral weight which enabled a q-1D FS to be deduced. A second study [11] obtained similar data. A third study [14] resolved valence band structure but the peak dispersing to EF was too weak in the spectra for its lineshape to be discerned.
Here we report the detailed non-Fermi liquid (NFL) lineshape of the dispersing excitation which defines the FS for Li0.9Mo6O17. Obtaining the lineshape data was enabled by taking precautions to minimize photon-induced sample damage [15] and by studying a region in k-space where the near-EF ARPES intensity is especially large, as determined by first making a k-space map of the ARPES intensity near EF. The properties of Li0.9Mo6O17 strongly argue that the NFL behavior has a purely electronic origin, giving this set of data a special current importance. Li0.9Mo6O17 displays metallic -linear resistivity and temperature independent magnetic susceptibility for temperatures down to 24K, where a phase transition of unknown origin is signaled by a very weak anomaly in the specific heat [16]. As decreases below , increases, but is unchanged [16, 17]. Most significant, infrared optical studies which routinely detect CDW or spin density wave (SDW) gaps [18] in other materials, do not show any gap opening [19] for energies down to 1 meV, setting an upper limit of (11.6/3.52)3K for a mean field CDW or SDW transition temperature. Below 1.8K the material is a superconductor [20]. The properties of the 24K transition are not consistent with CDW (or SDW) gap formation, and in any case, the small value of permits the NFL ARPES lineshape to be studied from to nearly 10, a temperature high enough that any putative q-1D CDW fluctuations should be absent. Comparing the data to the theoretical Luttinger liquid lineshape, we identify significant similarities, but also find important differences.
Single-crystal samples were grown by the electrolytic reduction technique [16]. The ARPES was performed at the Ames/Montana beamline of the Synchrotron Radiation Center at the University of Wisconsin. Samples oriented by Laue diffraction were mounted on the tip of a helium refrigerator and cleaved in situ at a temperature of 30K just before measurement in a vacuum of torr, exposing a clean surface containing the crystallographic c- and q-1D b-axes. Monochromatized photons of h=24 eV were used to obtain the spectra reported here. All the data are normalized to the photon flux. The instrumental resolution E and EF were calibrated with a reference spectrum taken on a freshly sputtered Pt foil. E was 150 meV for the EF intensity map and 50 meV for the energy distribution curves (EDC’s). The angular resolution for the spectrometer was , which amounts to % of the distance from to Y in the Brillouin zone. The k-space near-EF intensity map was made by detecting electrons over the range E=150meV, centered 50 meV below EF, and sweeping analyzer angles along two orthogonal directions relative to the sample normal, in steps of 1o for one angle and 2o for the other. One can show [21] that such sweeps move the k-vector on a spherical surface with a radius which depends on the kinetic energy and hence on the photon energy. In an idealized geometrical description, one observes the intersection of this spherical surface and the FS. In a more realistic spectroscopic description, the FS pattern is generated because the intensity at EF reaches a local maximum when a dispersing peak passes sufficiently near the angle/energy resolution window, for given temperature and peak lineshape. Because of translational invariance parallel to the sample surface the photohole momentum parallel to the surface k∥ is the same as that of the photoelectron and so is determined unambiguously by the analyzer angles and the kinetic energy of the photoelectron [21]. To deduce the perpendicular photohole momentum (k⟂) the surface potential change must be modeled and in making our maps we have used a standard ansatz [21] of free photoelectron bands offset by an inner potential to which we give a nominal value of 10 eV.
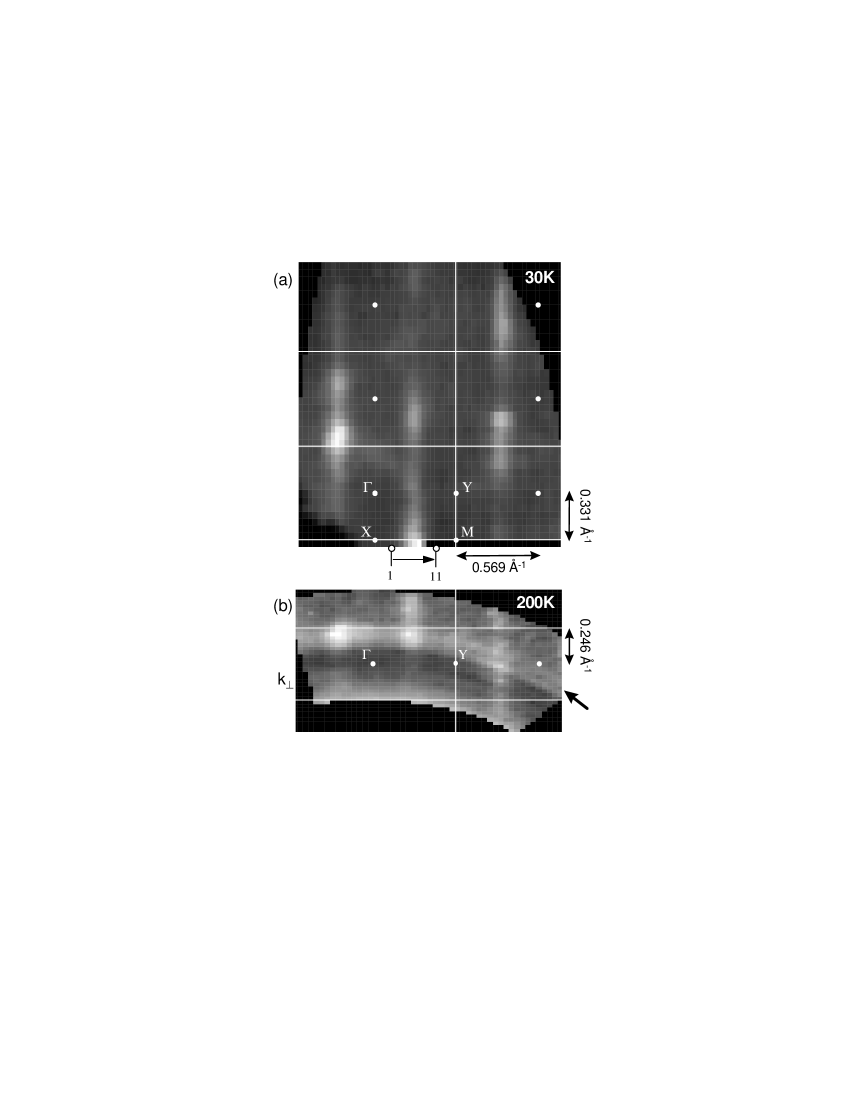
Fig. 1(a) shows the projection onto the k∥ plane of our near-EF intensity map made at a temperature of 30K by varying both analyzer angles for fixed h=24 eV. -Y and -X are the b* and c* directions, respectively. Fig. 1(b) shows the projection onto the k⟂/-Y plane of a map made at 200K by fixing one analyzer angle, while varying the other angle and also the photon energy. The spherical arcs for each photon energy are easily seen, and an arrow shows the arc corresponding to the fixed photon energy of the map of Fig. 1(a). The straightness of the FS segments in both maps shows that this material fulfills very well the band theory prediction of being q-1D [22, 23]. The Fermi wave-vector kF defined by the center of the left hand FS segment is 2kFÅ-1, somewhat larger than the band theory [22, 23] value of Å-1. Most significant for the rest of the paper is the existence of bright spots where the ARPES matrix element for the states near EF is maximum and where the dispersing peak lineshape can best be studied.
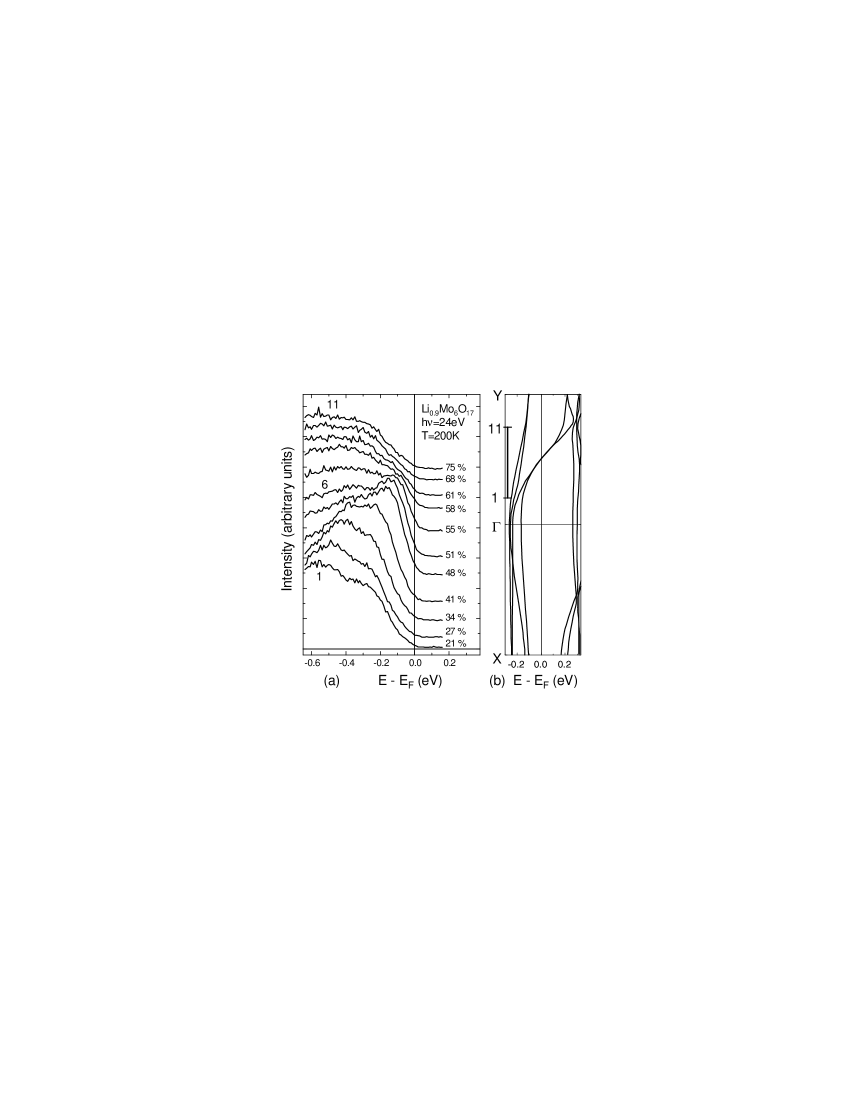
Fig. 2(a) shows a sequence of spectra taken at 200K 8 along a line Å-1 below an X-M Brillouin zone boundary and passing through the FS at one of the bright points, as indicated in Fig. 1(a). Over the corresponding k-range along -Y, the calculation of Fig. 2(b) shows two bands merging and crossing EF together. We identify the two dispersing peaks of Fig. 2(a) with these two bands, since both the calculation and our q-1D FS image show that the two bands disperse very weakly along -X. The calculated bands which do not cross EF are very weak for the special path of Fig. 2(a), but can still be seen as a small peak or general humping meV below EF in spectra 4 to 11. These bands are easily seen in other spectra, e.g. along -X and -Y. Thus we find a good general agreement with band theory except that the bandwidth is about twice the calculated value, as has been found for other molybdenum bronzes [11, 24]. Since LL models assume linear dispersion around EF, it is noteworthy that this aspect of the band theory is observed over an energy range of 200 meV for one band and 500 meV for the other. Of greatest interest is the detailed lineshape of the dispersing peak defining the FS. It moves toward EF from about 250 meV away until the leading edge shows a point of closest approach, after which the intensity then drops. Within the experimental resolution, very little intensity develops at EF. Fig. 3(a) shows the spectra overplotted so as to emphasize the defining behavior of the leading edge of the lineshape. In spectra 2 through 5 one sees the leading edge shift toward EF up to a certain limit, “the wall,” and in spectra 5 through 10 one sees the intensity fall, first without a change in the leading edge, and then accompanied by a shift of the leading edge away from EF. A set of spectra taken at 50K is identical with respect to all these features.
In the absence of any LL lineshape theory including interactions between two bands, we apply lineshapes calculated for the one-band Tomonaga-Luttinger (TL) model to the two degenerate bands crossing EF. Fig. 3(b) shows TL lineshapes for a spin independent repulsive interaction [5] and singularity index . The thick lines are spectra including our angle and energy resolutions. The thin lines accompanying two of the spectra show the purely theoretical curves without including the experimental resolutions. The k-values and format are exactly the same as for Fig. 3(a). Before discussing the considerable similarity to the experimental data for the behavior of the leading edge, we first describe the generic theoretical features. The LL has no single particle excitations, and the removal or addition of an electron results entirely in the generation of combinations of collective excitations of the spin and charge densities, known as spinons and holons, respectively. In this TL model the spinon dispersion is that of the underlying band, vFk with Fermi velocity vF, and the holon dispersion is vFk where depends on and is 1. For the lower group of spectra, with k inside the FS, there is an edge singularity onset at a non-zero low energy and then a rise to a power law singularity peak at higher energies. These sharp features are greatly broadened by the experimental resolutions and, except for the slight shoulder of curve 2, the spinon features of the theory curves are simply the leading edges of the lineshapes. The movements with k of the low energy onset and of the peak reflect the dispersions of the spinons and holons, respectively. That the onset occurs at a non-zero energy for kkF is a direct consequence of the restrictive kinematics of 1-D. For the four lowest members of the upper set of curves, k lies outside the FS. The k-dependence of the non-zero singular energy onset in this case reflects the holon dispersion.
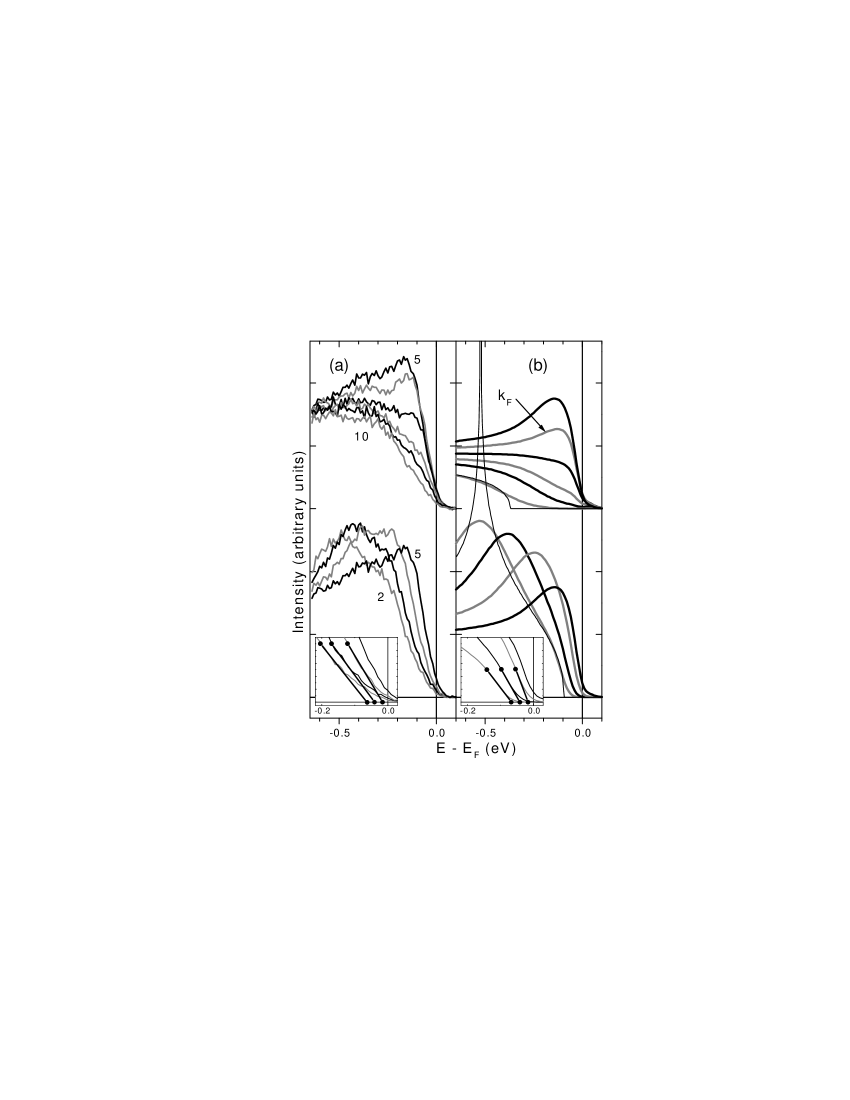
We now discuss the choice of parameters and the comparison to experiment, for which we associate the spectral peaks with the rapidly dispersing holon features and the leading edges with the slowly dispersing spinon features. We consider a range of because for the low energy edge singularity takes the form of a peak which is obviously not present in the data. Each determines a and vF is chosen so that vFk matches the experimental peak movements, linear to meV below EF for one peak, but only meV below EF for the other, so that the lowest energy peak in data curves 1 to 3 has no theoretical counterpart. One finds that for the broadened spectra, as increases from 1/2, (a) the peak maximum as k approaches kF decreases more rapidly, and (b) the amount of EF weight relative to the spectrum maximum in the k=kF spectrum decreases. As expected in the TL theory [4, 5], we have observed a power law onset at EF in a measurement of the angle-integrated photoemission spectrum, from which we deduce 0.6, nicely greater than 1/2. For = 0.6 () the behavior of (a) is similar to experiment but the value for (b) is about twice the experiment value of 16%. For = 0.9 (), it is noticeable that the behavior of (a) is faster than in experiment, but the fractional amount of EF weight for the k=kF spectrum is only slightly greater than in experiment. With the choice = 0.9 and vF = 0.7 eVÅ [25], the theory curves reproduce semiquantitatively the variation of the leading edge in spectra 2 to 5, the “wall” behavior in spectra 5 to 7, the loss of a peaky upturn at EF from spectrum 6 to 7 as k passes beyond kF, and qualitatively the movement of the leading edge away from EF for spectra 8 to 10. The agreement of the intercepts given by the straight line extrapolations shown in the two insets indicates a remnant in the data of the theoretical onset behavior of 1-D kinematics, and even a semi-quantitative agreement with the value. The general goodness of the agreement for spectra 5 through 7 leads us to take the value of 2kF=0.59 Å-1 from spectrum 6 as a better determination of 2kF than the slightly smaller value deduced above from the center of the FS image.
Looking in more detail, differences can be seen. First, considering the insets of Fig. 3, the amount of experimental weight in the energy range from EF to the theory onset definitely exceeds that for the corresponding broadened theory curve. This could reflect the ultimate 3-D character of the material relaxing the restrictive 1-D kinematics, consistent with the increasing magnitude of the disagreement as k moves further from the FS and the available phase space increases. We also report that the only difference between the spectra at 200K and 50K is a subtle change at lower temperature such that the leading edge extrapolates more to EF. At present this small temperature dependence is a tentative finding which requires further study, but might hint at a departure from LL behavior, perhaps an increased 3-D character, due to some lingering effects of whatever processes are important in the phase transition at . In any case, we note that this temperature dependence is opposite to that expected [7] for the case of a pseudogap associated with gap formation (e.g. CDW or SDW) at . Second, the magnitude of the edge movement for experimental spectra 8 to 10 is much less than in the theory, probably due to the interfering presence in the spectra of the contributions from the two bands further below EF. Thus the detailed differences can plausibly be attributed to the oversimplifications of the TL model, e.g. its one-band nature and its strict 1-D character, relative to the experimental situation. The fact that our value is much larger than the value 1/8 for the 1-D Hubbard model could also be a consequence of some 3-D coupling [26].
In summary we have presented spectra which are currently unique in showing the lineshape of the dispersing excitation that defines the FS for interacting electrons in a q-1D non-CDW metal. We have compared the data to the lineshape in the TL model of the LL. Although there are important differences in detail, nonetheless there is a remarkable similarity between theory and experiment for the anomalous behavior of the leading edge of the lineshape. In the TL model this behavior has its origin in the underlying charge-spin separation of the LL scenario. Previous ARPES reports [27] of charge-spin separation have been for q-1D materials where a Mott-Hubbard insulator precludes the LL. This is the first such report for a q-1D metal and provides strong motivation for further study of Li0.9Mo6O17 using other techniques.
Work at U-M was supported by the U.S. Department of Energy (DoE) under contract No. DE-FG02-90ER45416 and by the U.S. National Science Foundation (NSF) grant No. DMR-94-23741. Work at the Ames lab was supported by the DoE under contract No. W-7405-ENG-82. The Synchrotron Radiation Center is supported by the NSF under grant DMR-95-31009.
REFERENCES
- [1] Department of Physics, National Chang-Hua University of Education, Chang-Hua 50058, Taiwan, Republic of China.
- [2] P.W. Anderson, Phys. Rev. Lett. 64, 1839 (1990); Phys. Rev. Lett. 65, 2306 (1990).
- [3] F.D. M. Haldane, J. Phys. C 14, 2585 (1981).
- [4] J. Voit, Phys. Rev. B 47, 6740 (1993).
- [5] V. Meden and K. Schönhammer, Phys. Rev. B 46, 15753 (1992).
- [6] P.A. Lee et al., Phys. Rev. Lett. 31, 462 (1973).
- [7] R.H. McKenzie and D. Scarratt, Phys. Rev. B 54 R12709 (1996).
- [8] B. Dardel et al., Phys. Rev. Lett. 67, 3144 (1991)
- [9] B. Dardel et al., Europhys. Lett. 24, 687 (1993).
- [10] R. Claessen et al., J. Elec. Spec. Rel. Phenom. 76, 121 (1995); J.W. Allen et al., J. Phys. Chem. Solids 56, 1849 (1995)
- [11] G.-H. Gweon et al., J. Phys. Condens. Matter 8, 9923 (1996).
- [12] F. Zwick et al., Phys. Rev. Lett. 79, 3982 (1997).
- [13] K.E. Smith et al, Phys. Rev. Lett. 70, 3772 (1993).
- [14] M. Grioni et al., Phys. Scripta T66, 172 (1996).
- [15] K. Breuer et al., J. Vac. Sci. Tech. A 12, 2196 (1994); The beamline has a negligible amount of 2nd order light of energy higher than 35 eV, due to its low energy grating.
- [16] C. Schlenker et al., Physica 135B, 511 (1985).
- [17] Y. Matsuda et al., J. Phys. C 19, 6039 (1986).
- [18] For examples, see G. Travaglini and P. Wachter, Phys. Rev. B 30, 1971 (1984) (CDW) or L. Degiorgi et al., Phys. Rev. Lett. 76, 3838 (1996) (SDW).
- [19] L. Degiorgi et al., Phys. Rev. B 38, 5821 (1988).
- [20] M. Greenblatt et al., Solid State Comm. 51, 671 (1984).
- [21] F.J. Himpsel, Adv. Phys. 32, 1 (1983).
- [22] M.-H. Whangbo and E. Canadell, J. Am. Chem. Soc. 110, 358 (1988).
- [23] Ref. REFERENCES found larger dispersion perpendicular to the sample surface than we do and a different 2kF 0.7 Å-1. Both differences can be attributed to our better resolution of the near-EF peak which defines the FS.
- [24] G.-H. Gweon et al., Phys. Rev. B 55, R13353 (1997).
- [25] For the large k, range of the linear dispersion, the universal spectral function used here is valid if the potential range parameter Å[5]. The dependence is then too weak to discern in the comparison to the data and we conservatively chose Å.
- [26] P. Kopietz et al., Phys. Rev. Lett. 74, 2997 (1995).
- [27] C. Kim et al., Phys. Rev. Lett. 77, 4054 (1996); H. Fujisawa et al., Solid State Comm. 106, 543 (1998).